

The DOI matches its Crossref record; 55 of the 55 references it cites were found in a registry or an index.
From de novo to ‘de nono’: The majority of novel protein coding genes identified with phylostratigraphy are old genes or recent duplicates
Published version of a preprint
Abstract
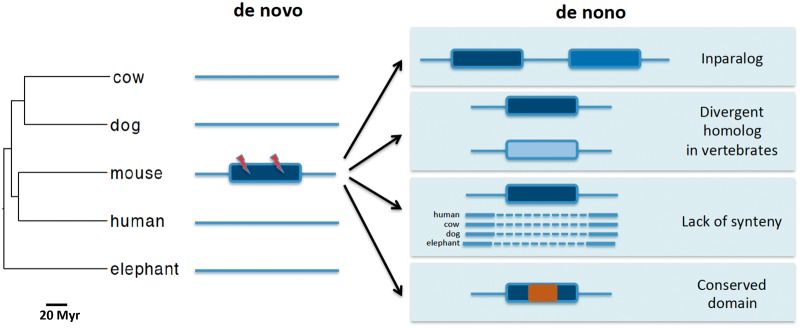
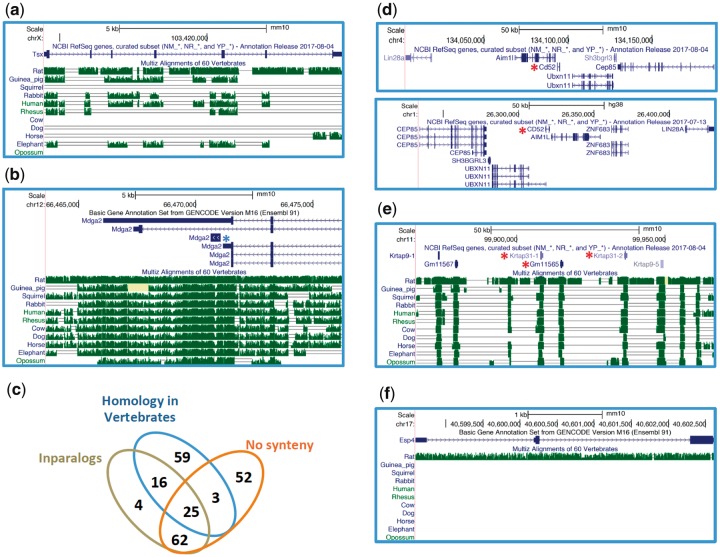
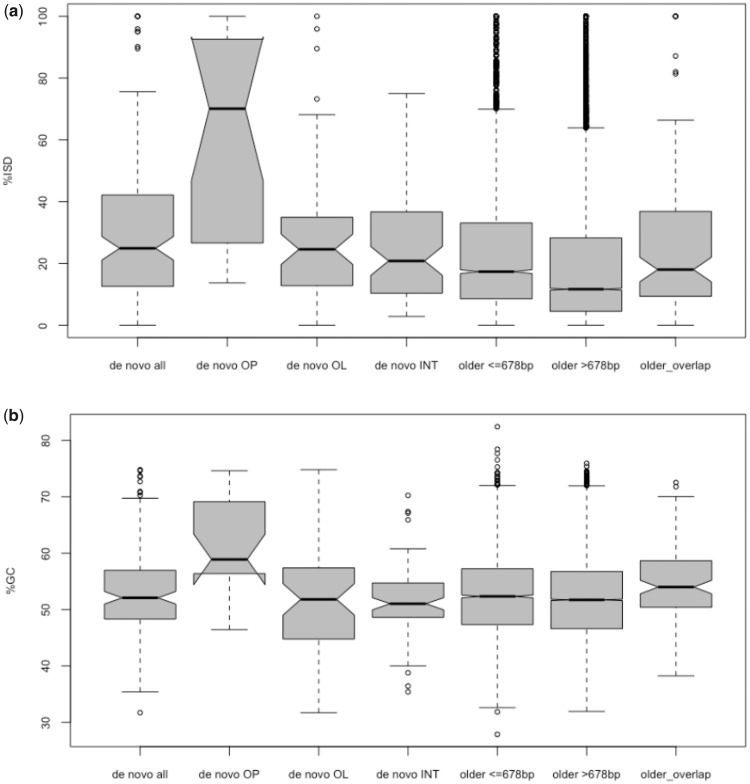
The evolution of novel protein-coding genes from noncoding regions of the genome is one of the most compelling pieces of evidence for genetic innovations in nature. One popular approach to identify de novo genes is phylostratigraphy, which consists of determining the approximate time of origin (age) of a gene based on its distribution along a species phylogeny. Several studies have revealed significant flaws in determining the age of genes, including de novo genes, using phylostratigraphy alone. However, the rate of false positives in de novo gene surveys, based on phylostratigraphy, remains unknown. Here, I reanalyze the findings from three studies, two of which identified tens to hundreds of rodent-specific de novo genes adopting a phylostratigraphy-centered approach. Most putative de novo genes discovered in these investigations are no longer included in recently updated mouse gene sets. Using a combination of synteny information and sequence similarity searches, I show that ∼60% of the remaining 381 putative de novo genes share homology with genes from other vertebrates, originated through gene duplication, and/or share no synteny information with nonrodent mammals. These results led to an estimated rate of ∼12 de novo genes per million years in mouse. Contrary to a previous study (Wilson BA, Foy SG, Neme R, Masel J. 2017. Young genes are highly disordered as predicted by the preadaptation hypothesis of de novo gene birth. Nat Ecol Evol. 1:0146), I found no evidence supporting the preadaptation hypothesis of de novo gene formation. Nearly half of the de novo genes confirmed in this study are within older genes, indicating that co-option of preexisting regulatory regions and a higher GC content may facilitate the origin of novel genes.
Overview
The claims and statistics of this paper haven’t been checked yet.
Run the check — free, no account needed. It reads the open-access text and checks the sources it cites.
Integrity signals
Registry
Cites
Statistics
Figures
Verification
Claims the paper makes
The claims and statistics of this paper haven’t been checked yet.
Run the check — free, no account needed. It reads the open-access text and checks the sources it cites.
Claims other papers make about this one
Each is checked against this paper’s own text: does it say what the citing paper says it does?
The source backs part of the claim, not all of it — or backs it for a different population, condition or comparison.
In the citing paper
“It appears that most of the ab initio potential lineage-specific genes are artifacts, as the number of singletons is too high considering estimates of the rate of emergence of new genes (Casola 2018, Zhang et al. 2019, Zile et al. 2020, Vakirlis et al. 2024).”
From Annotation matters: the effect of structural gene annotation on orthology inference (2025) · cites this paper as Casola 2018
Experimental — accuracy not yet measured
Self-check
Percentages, sums and reported differences re-computed from the paper’s own numbers.
The self-check needs the paper’s full text.
Citations
Cites
BLAST+: architecture and applications
Camacho, C., Coulouris, G., Avagyan, V., Ma, N., Papadopoulos, J., Bealer, K., & Madden, T. L. (2009) · BMC Bioinformatics · doi:10.1186/1471-2105-10-421 · Cited by 22,074
O'Leary, N. A., Wright, M. W., Brister, J. R., Ciufo, S., Haddad, D., McVeigh, R., Rajput, B., Robbertse, B., Smith-White, B., Ako-Adjei, D., et al. (2016) · Nucleic Acids Research · doi:10.1093/nar/gkv1189 · Cited by 6,357
GENCODE: The reference human genome annotation for The ENCODE Project
Harrow, J., Frankish, A., Gonzalez, J. M., Tapanari, E., Diekhans, M., Kokocinski, F., Aken, B. L., Barrell, D., Zadissa, A., Searle, S., et al. (2012) · Genome Research · doi:10.1101/gr.135350.111 · Cited by 4,585
CDD/SPARCLE: functional classification of proteins via subfamily domain architectures
Marchler-Bauer, A., Bo, Y., Han, L., He, J., Lanczycki, C. J., Lu, S., Chitsaz, F., Derbyshire, M. K., Geer, R. C., Gonzales, N. R., et al. (2017) · Nucleic Acids Research · doi:10.1093/nar/gkw1129 · Cited by 2,713
Genome sequence of the Brown Norway rat yields insights into mammalian evolution
Gibbs, R. A., Weinstock, G. M., Metzker, M. L., Muzny, D. M., Sodergren, E. J., Scherer, S. E., Scott, G., Steffen, D. L., Worley, K. C., Burch, P. E., et al. (2004) · Nature · doi:10.1038/nature02426 · Cited by 2,175
Human–Mouse Alignments with BLASTZPreprint
Schwartz, S., Kent, W. J., Smit, A., Zhang, Z., Baertsch, R., Hardison, R. C., Haussler, D. H., & Miller, W. (2002) · Genome Research · doi:10.1101/gr.809403 · Cited by 1,249
Han, M., Thomas, G. W. C., Lugo-Martinez, J., & Hahn, M. W. (2013) · Molecular Biology and Evolution · doi:10.1093/molbev/mst100 · Cited by 834
The evolutionary origin of orphan genes
Tautz, D., & Domazet-Lošo, T. (2011) · Nature Reviews Genetics · doi:10.1038/nrg3053 · Cited by 764
Proto-genes and de novo gene birth
Carvunis, A.-R., Rolland, T., Wapinski, I., Calderwood, M. A., Yildirim, M. A., Simonis, N., Charloteaux, B., Hidalgo, C. A., Barbette, J., Santhanam, B., et al. (2012) · Nature · doi:10.1038/nature11184 · Cited by 669
High Guanine and Cytosine Content Increases mRNA Levels in Mammalian Cells
Kudla, G., Lipinski, L., Caffin, F., Helwak, A., & Zylicz, M. (2006) · PLoS Biology · doi:10.1371/journal.pbio.0040180 · Cited by 476
PASTA 2.0: an improved server for protein aggregation prediction
Walsh, I., Seno, F., Tosatto, S. C. E., & Trovato, A. (2014) · Nucleic Acids Research · doi:10.1093/nar/gku399 · Cited by 475
More than just orphans: are taxonomically-restricted genes important in evolution?
Khalturin, K., Hemmrich, G., Fraune, S., Augustin, R., & Bosch, T. C. G. (2009) · Trends in Genetics · doi:10.1016/j.tig.2009.07.006 · Cited by 430
Domazet‐Lošo, T., Brajković, J., & Tautz, D. (2007) · Trends in Genetics · doi:10.1016/j.tig.2007.08.014 · Cited by 421
Recent de novo origin of human protein-coding genes
Knowles, D. G., & McLysaght, A. (2009) · Genome Research · doi:10.1101/gr.095026.109 · Cited by 291
The common marmoset genome provides insight into primate biology and evolution
The Marmoset Genome Sequencing and Analysis Consortium (2014) · Nature Genetics · doi:10.1038/ng.3042 · Cited by 267
Mouse Genome Database (MGD)-2017: community knowledge resource for the laboratory mouse
Blake, J. A., Eppig, J. T., Kadin, J. A., Richardson, J. E., Smith, C. L., Bult, C. J., & the Mouse Genome Database Group (2016) · Nucleic Acids Research · doi:10.1093/nar/gkw1040 · Cited by 262
Origin and Spread of de Novo Genes in Drosophila melanogaster Populations
Zhao, L., Saelao, P., Jones, C. D., & Begun, D. J. (2014) · Science · doi:10.1126/science.1248286 · Cited by 248
Prevention of amyloid‐like aggregation as a driving force of protein evolution
Monsellier, É., & Chiti, F. (2007) · EMBO Reports · doi:10.1038/sj.embor.7401034 · Cited by 243
Phylogenetic patterns of emergence of new genes support a model of frequent de novo evolution
Neme, R., & Tautz, D. (2013) · BMC Genomics · doi:10.1186/1471-2164-14-117 · Cited by 226
Begun, D. J., Lindfors, H. A., Kern, A. D., & Jones, C. D. (2007) · Genetics · doi:10.1534/genetics.106.069245 · Cited by 222
Emergence of a New Gene from an Intergenic Region
Heinen, T. J. A. J., Staubach, F., Häming, D., & Tautz, D. (2009) · Current Biology · doi:10.1016/j.cub.2009.07.049 · Cited by 215
Open questions in the study of de novo genes: what, how and why
McLysaght, A., & Hurst, L. D. (2016) · Nature Reviews Genetics · doi:10.1038/nrg.2016.78 · Cited by 213
Young genes are highly disordered as predicted by the preadaptation hypothesis of de novo gene birth
Wilson, B. A., Foy, S. G., Neme, R., & Masel, J. (2017) · Nature Ecology & Evolution · doi:10.1038/s41559-017-0146 · Cited by 171
Inverse Relationship Between Evolutionary Rate and Age of Mammalian Genes
Albà, M. M., & Castresana, J. (2004) · Molecular Biology and Evolution · doi:10.1093/molbev/msi045 · Cited by 170
Hominoid-Specific De Novo Protein-Coding Genes Originating from Long Non-Coding RNAs
Xie, C., Zhang, Y. E., Chen, J., Liu, C., Zhou, W., Li, Y., Zhang, M., Zhang, R., Wei, L., & Li, C. (2012) · PLoS Genetics · doi:10.1371/journal.pgen.1002942 · Cited by 164
McLysaght, A., & Guerzoni, D. (2015) · Philosophical Transactions of the Royal Society B Biological Sciences · doi:10.1098/rstb.2014.0332 · Cited by 162
Origins of De Novo Genes in Human and Chimpanzee
Ruiz-Orera, J., Hernandez-Rodriguez, J., Chiva, C., Sabidó, E., Kondova, I., Bontrop, R., Marqués-Bonet, T., & Albà, M. M. (2015) · PLOS Genetics · doi:10.1371/journal.pgen.1005721 · Cited by 160
Reinhardt, J. A., Wanjiru, B. M., Brant, A. T., Saelao, P., Begun, D. J., & Jones, C. D. (2013) · PLoS Genetics · doi:10.1371/journal.pgen.1003860 · Cited by 132
A Human-Specific De Novo Protein-Coding Gene Associated with Human Brain Functions
Li, C.-Y., Zhang, Y., Wang, Z., Zhang, Y., Cao, C., Zhang, P.-W., Lu, S.-J., Li, X.-M., Yu, Q., Zheng, X., et al. (2010) · PLoS Computational Biology · doi:10.1371/journal.pcbi.1000734 · Cited by 130
A Molecular Portrait of De Novo Genes in Yeasts
Vakirlis, N., Hebert, A. S., Opulente, D. A., Achaz, G., Hittinger, C. T., Fischer, G., Coon, J. J., & Lafontaine, I. (2017) · Molecular Biology and Evolution · doi:10.1093/molbev/msx315 · Cited by 126
Neme, R., & Tautz, D. (2016) · eLife · doi:10.7554/elife.09977 · Cited by 120
A Relationship Between GC Content and Coding-Sequence Length
Oliver, J. L. T., & Marín, A. (1996) · Journal of Molecular Evolution · doi:10.1007/bf02338829 · Cited by 119
Phylostratigraphic Bias Creates Spurious Patterns of Genome Evolution
Moyers, B. A., & Zhang, J. (2014) · Molecular Biology and Evolution · doi:10.1093/molbev/msu286 · Cited by 115
Elhaik, E., Sabath, N., & Graur, D. (2005) · Molecular Biology and Evolution · doi:10.1093/molbev/msj006 · Cited by 99
Vakirlis, N., Sarilar, V., Drillon, G., Fleiss, A., Agier, N., Meyniel, J.-P., Blanpain, L. T., Carbone, A., Devillers, H., Dubois, K., et al. (2016) · Genome Research · doi:10.1101/gr.204420.116 · Cited by 96
Incipient de novo genes can evolve from frozen accidents that escaped rapid transcript turnover
Schmitz, J. F., Ullrich, K. K., & Bornberg‐Bauer, E. (2018) · Nature Ecology & Evolution · doi:10.1038/s41559-018-0639-7 · Cited by 94
Evaluating Phylostratigraphic Evidence for Widespread De Novo Gene Birth in Genome Evolution
Moyers, B. A., & Zhang, J. (2016) · Molecular Biology and Evolution · doi:10.1093/molbev/msw008 · Cited by 86
A Relationship Between GC Content and Coding-Sequence Length
Oliver, J. L. T., & Marín, A. (1996) · Journal of Molecular Evolution · doi:10.1007/pl00006080 · Cited by 82
A First Look at ARFome: Dual-Coding Genes in Mammalian Genomes
Chung, W., Wadhawan, S., Szklarczyk, R., Pond, S. L. K., & Nekrutenko, A. (2007) · PLoS Computational Biology · doi:10.1371/journal.pcbi.0030091 · Cited by 76
Pavesi, A., Magiorkinis, G., & Karlin, D. (2013) · PLoS Computational Biology · doi:10.1371/journal.pcbi.1003162 · Cited by 70
High GC content causes orphan proteins to be intrinsically disordered
Basile, W., Sachenkova, O., Light, S., & Elofsson, A. (2017) · PLoS Computational Biology · doi:10.1371/journal.pcbi.1005375 · Cited by 70
Chen, J., Shen, Q. S., Zhou, W., Peng, J., He, B., Li, Y., Liu, C., Luan, X., Ding, W., Li, S., et al. (2015) · PLoS Genetics · doi:10.1371/journal.pgen.1005391 · Cited by 68
Kimura, Y., Hawkins, M. T. R., McDonough, M. M., Jacobs, L. L., & Flynn, L. J. (2015) · Scientific Reports · doi:10.1038/srep14444 · Cited by 66
Are Human Translated Pseudogenes Functional?
Xu, J., & Zhang, J. (2015) · Molecular Biology and Evolution · doi:10.1093/molbev/msv268 · Cited by 57
Further Simulations and Analyses Demonstrate Open Problems of Phylostratigraphy
Moyers, B. A., & Zhang, J. (2017) · Genome Biology and Evolution · doi:10.1093/gbe/evx109 · Cited by 53
De Novo Origin of Protein-Coding Genes in Murine Rodents
Murphy, D. N., & McLysaght, A. (2012) · PLoS ONE · doi:10.1371/journal.pone.0048650 · Cited by 52
Making whole genome multiple alignments usable for biologists
Blankenberg, D. J., Taylor, J., Nekrutenko, A., & The Galaxy Team (2011) · Bioinformatics · doi:10.1093/bioinformatics/btr398 · Cited by 52
Guerzoni, D., & McLysaght, A. (2016) · Genome Biology and Evolution · doi:10.1093/gbe/evw074 · Cited by 47
Faster Evolving Primate Genes Are More Likely to Duplicate
O’Toole, Á., Hurst, L. D., & McLysaght, A. (2017) · Molecular Biology and Evolution · doi:10.1093/molbev/msx270 · Cited by 41
Smith, S. A., & Pease, J. B. (2016) · Briefings in Bioinformatics · doi:10.1093/bib/bbw034 · Cited by 39
A Comprehensive Analysis of Transcript-Supported De Novo Genes in Saccharomyces sensu stricto Yeasts
Lu, T., Leu, J., & Lin, W. (2017) · Molecular Biology and Evolution · doi:10.1093/molbev/msx210 · Cited by 31
Understanding and predicting protein misfolding and aggregation: Insights from proteomics
Pallarès, I., & Ventura, S. (2016) · PROTEOMICS · doi:10.1002/pmic.201500529 · Cited by 26
Benchmarking the next generation of homology inference tools
Saripella, G. V., Sonnhammer, E. L. L., & Forslund, S. K. (2016) · Bioinformatics · doi:10.1093/bioinformatics/btw305 · Cited by 19
Phylostratigraphic Bias Creates Spurious Patterns of Genome Evolution
Moyers, B. A., & Zhang, J. (2016) · Molecular Biology and Evolution · doi:10.1093/molbev/msw202 · Cited by 13
Yomo, T., & Urabe, I. (1994) · Journal of Molecular Evolution · doi:10.1007/bf00166158 · Cited by 10
Cited by
Weisman, C. M., Murray, A. W., & Eddy, S. R. (2022) · Current Biology · doi:10.1016/j.cub.2022.04.085 · Cited by 101
Zhao, L., Svetec, N., & Begun, D. J. (2024) · Annual Review of Genetics · doi:10.1146/annurev-genet-111523-102413 · Cited by 38
Annotation matters: the effect of structural gene annotation on orthology inference
Prieto-Baños, S., Nevers, Y., Altenhoff, A., Warwick Vesztrocy, A., Dessimoz, C., & Glover, N. M. (2025) · Bioinformatics · doi:10.1093/bioinformatics/btaf365 · Cited by 19
Zile, K., Dessimoz, C., Wurm, Y., & Masel, J. (2020) · Genome Biology and Evolution · doi:10.1093/gbe/evaa127 · Cited by 18
Metadata
- Authors
- Casola, C.
- Affiliations
- Department of Ecosystem Science and Management, Texas A&M University, College Station, TX
- Venue
- Genome Biology and Evolution
- Publisher
- Oxford University Press (OUP)
- Published
- 2018-10-22
- ISSN
- 1759-6653
- PMC
- PMC6239577
- Cited by
- 28
- References
- 55
- Language
- en
About these checks
Registry, retraction, Cites and statistics results are computed, not judged, with one exception: a printed reference that no index lists is read once by a model before it counts as a citation error. Claims are extracted by a model and kept only when their quote appears verbatim in the text; each cited source is then checked, with a model’s help, for whether it says what the claim relies on. Those verdicts can be wrong — read the claim’s quote and the cited source before relying on one.
Statistics and arithmetic are recomputed, not judged.
Confidence bands are shown only for fields calibrated on our annotated test set. None is calibrated yet, so no band is shown.
What counts as a claim ›How we measure confidence ›How we check this ›
Are you an author, or do you see a problem with this page? Request a review
Data sources
Bibliographic data: Semantic Scholar, OpenAlex, Crossref.
Contains information from the Semantic Scholar Academic Graph Datasets, made available under the ODC Attribution License (ODC-BY 1.0).
Semantic Scholar’s data is described in: Kinney, R., et al. (2023). The Semantic Scholar Open Data Platform. arXiv:2301.10140.
