

The DOI matches its Crossref record; 68 of the 68 references it cites were found in a registry or an index.
Elucidation of the O-antigen structure of Escherichia coli O93 and characterization of its biosynthetic genes
Open accessPublished version of a preprint
Abstract
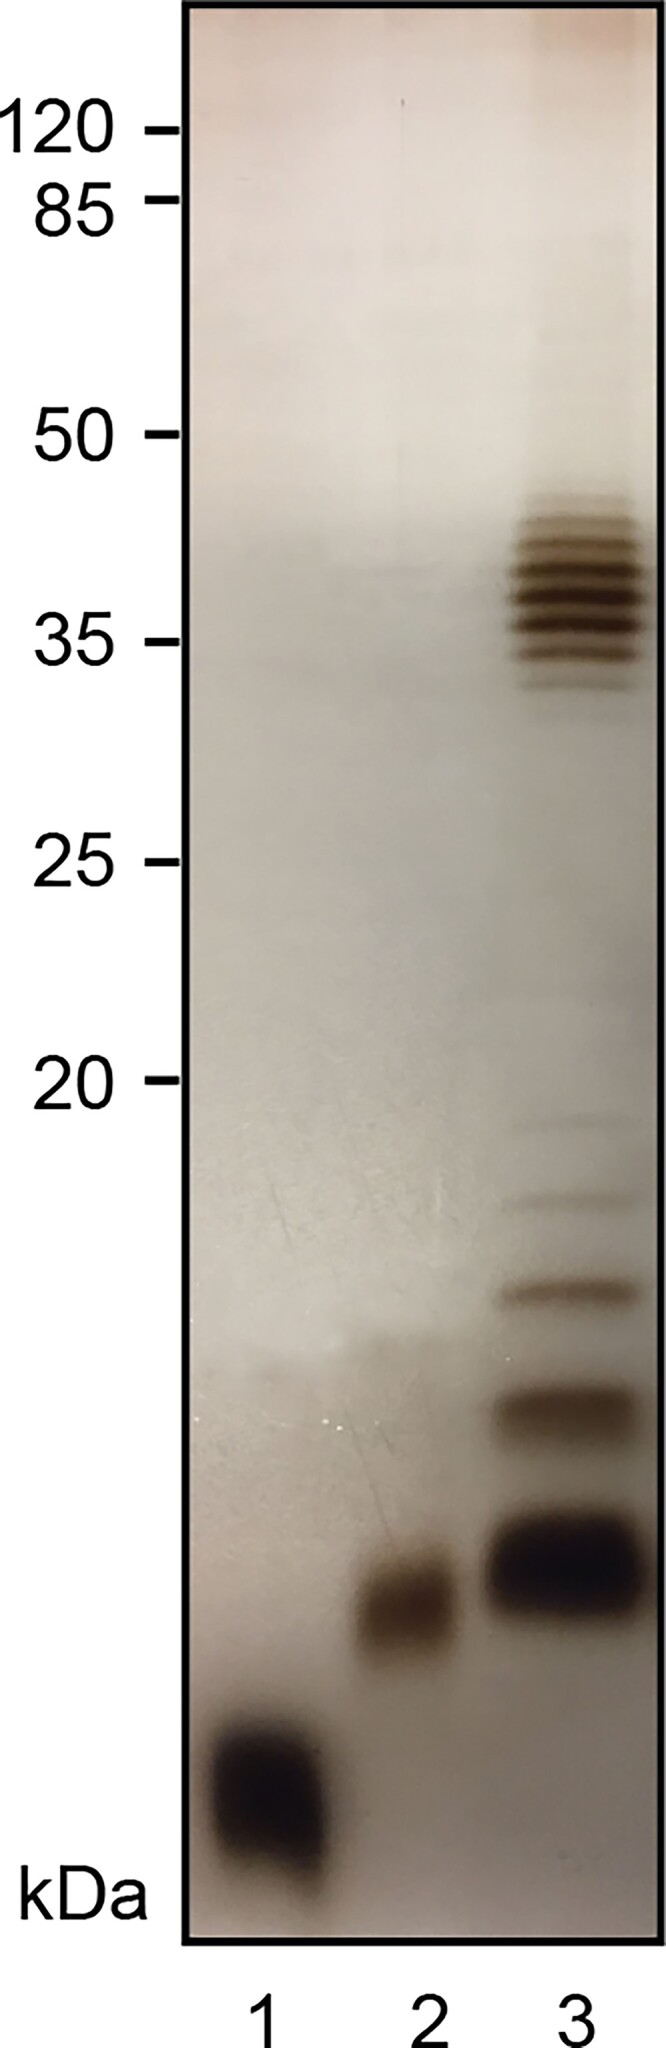
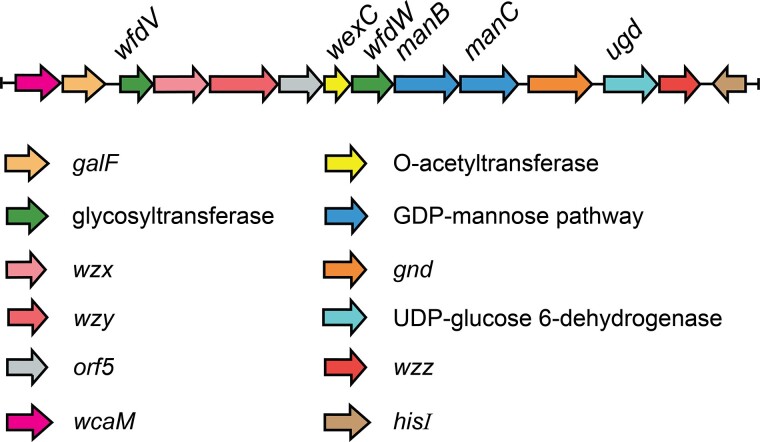
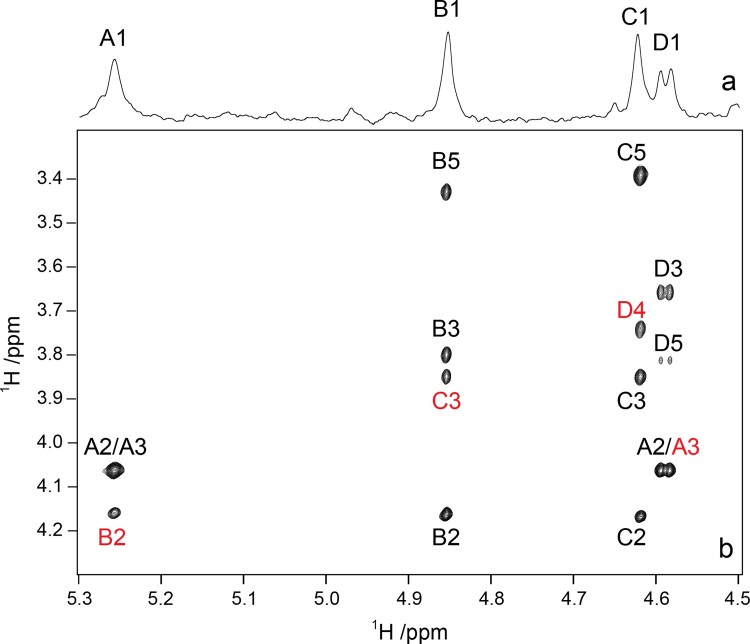
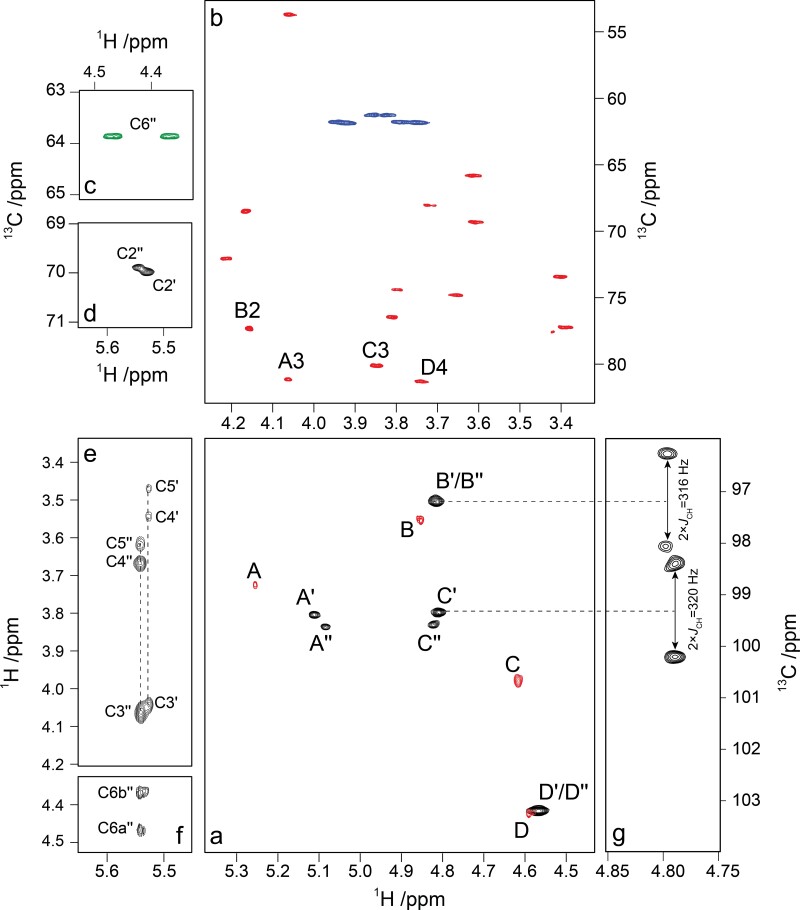
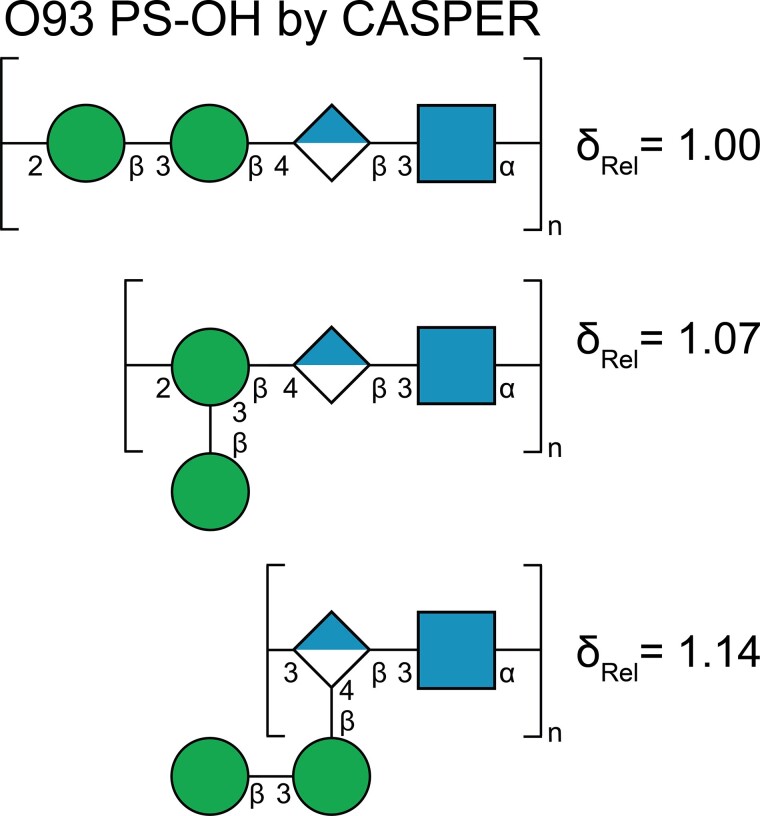
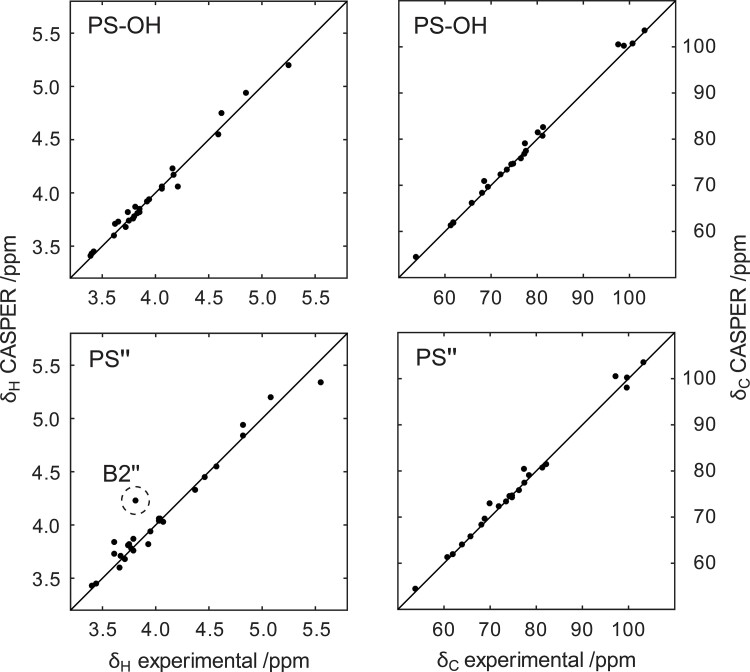
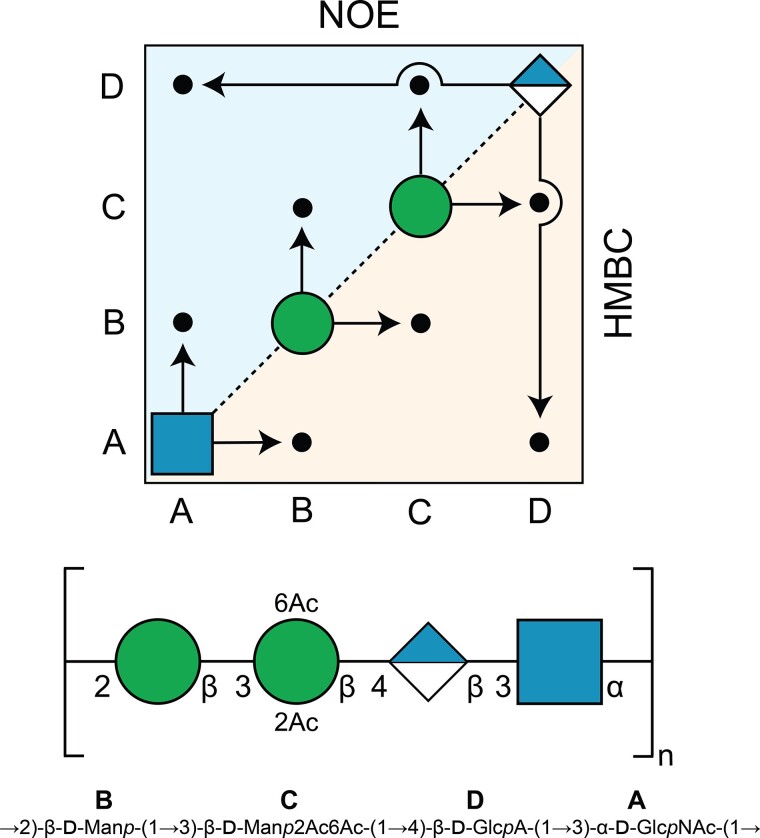
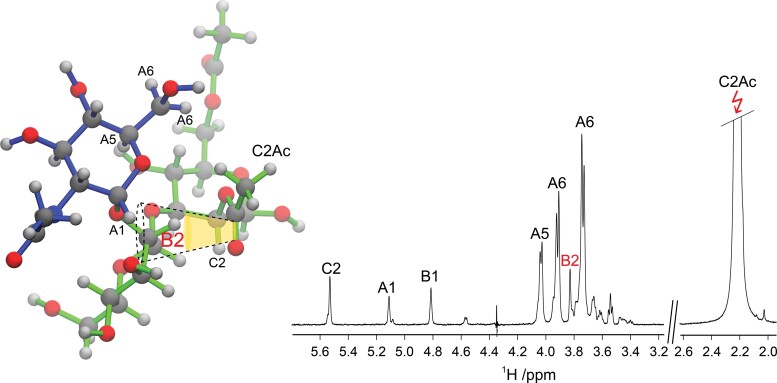
The structure of the O-antigen from the international reference strain Escherichia coli O93:−:H16 has been determined. A nonrandom modal chain-length distribution was observed for the lipopolysaccharide, a pattern which is typical when long O-specific polysaccharides are expressed. By a combination of (i) bioinformatics information on the gene cluster related to O-antigen synthesis including putative function on glycosyl transferases, (ii) the magnitude of NMR coupling constants of anomeric protons, and (iii) unassigned 2D 1H, 13C-HSQC, and 1H,1H-TOCSY NMR spectra it was possible to efficiently elucidate the structure of the carbohydrate polymer in an automated fashion using the computer program CASPER. The polysaccharide also carries O-acetyl groups and their locations were determined by 2D NMR experiments showing that ~½ of the population was 2,6-di-O-acetylated, ~¼ was 2-O-acetylated, whereas ~¼ did not carry O-acetyl group(s) in the 3-O-substituted mannosyl residue of the repeating unit. The structure of the tetrasaccharide repeating unit of the O-antigen is given by: →2)-β-d-Manp-(1→3)-β-d-Manp2Ac6Ac-(1→4)-β-d-GlcpA-(1→3)-α-d-GlcpNAc-(1→, which should also be the biological repeating unit and it shares structural elements with capsular polysaccharides from E. coli K84 and K50. The structure of the acidic O-specific polysaccharide from Cellulophaga baltica strain NN015840T differs to that of the O-antigen from E. coli O93 by lacking the O-acetyl group at O6 of the O-acetylated mannosyl residue.
Overview
The claims and statistics of this paper haven’t been checked yet.
Run the check — free, no account needed. It reads the open-access text and checks the sources it cites.
Integrity signals
Registry
Cites
Statistics
Figures
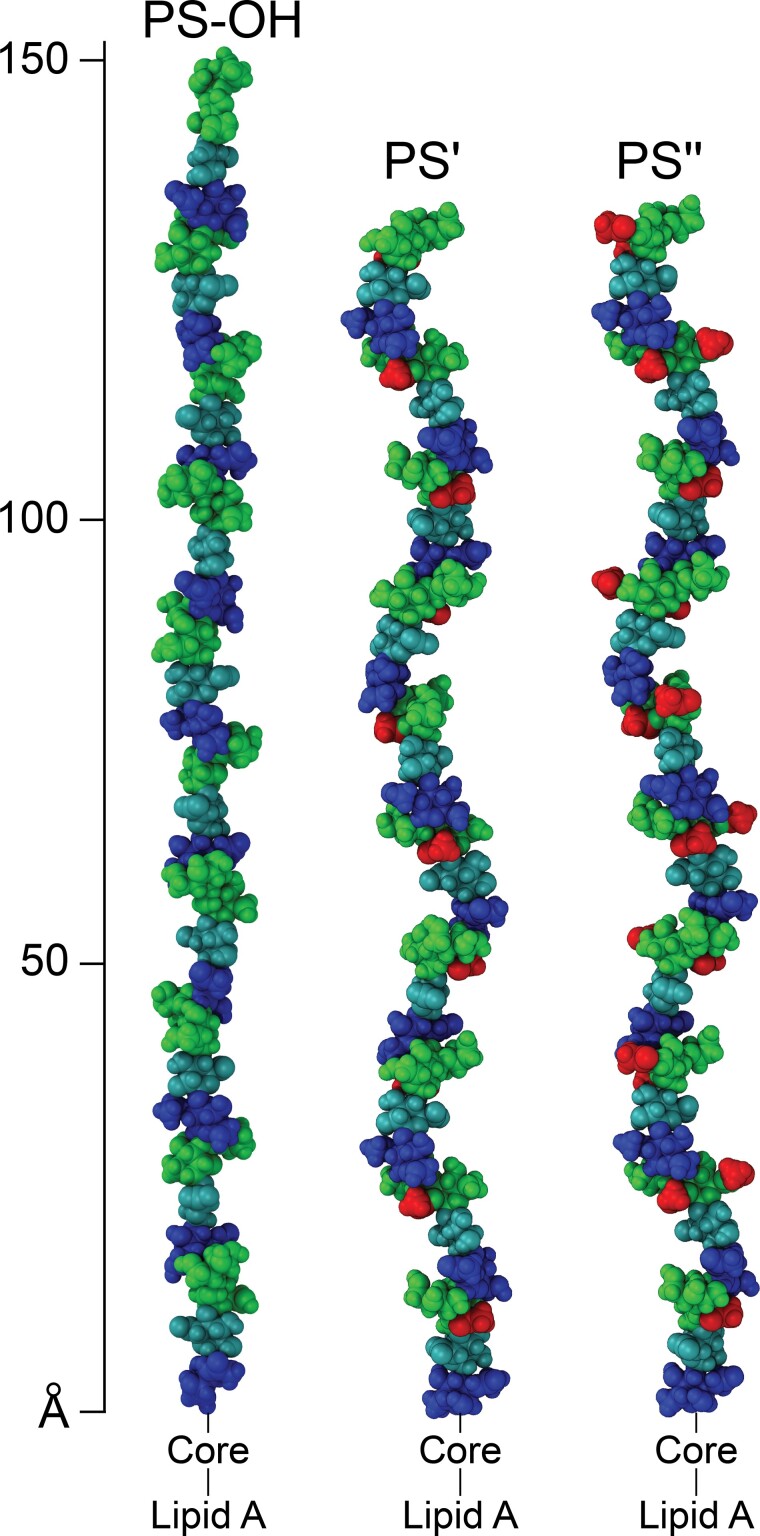
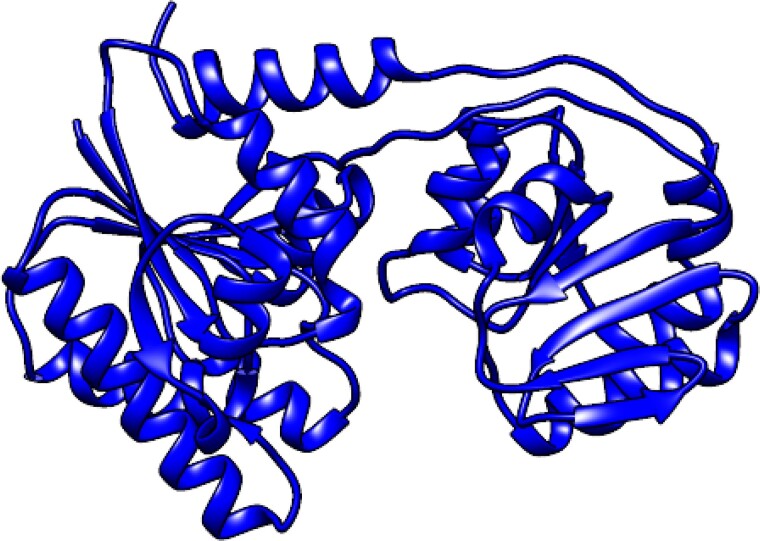
Verification
Claims the paper makes
The claims and statistics of this paper haven’t been checked yet.
Run the check — free, no account needed. It reads the open-access text and checks the sources it cites.
Self-check
Percentages, sums and reported differences re-computed from the paper’s own numbers.
The self-check needs the paper’s full text.
Citations
Cites
VMD: visual molecular dynamics
Humphrey, W., Dalke, A., & Schulten, K. (1996) · Journal of Molecular Graphics · doi:10.1016/0263-7855(96)00018-5 · Cited by 66,952
UCSF Chimera—A visualization system for exploratory research and analysis
Pettersen, E. F., Goddard, T. D., Huang, C. C., Couch, G. S., Greenblatt, D. M., Meng, E. C., & Ferrin, T. E. (2004) · Journal of Computational Chemistry · doi:10.1002/jcc.20084 · Cited by 45,828
Highly accurate protein structure prediction with AlphaFold
Jumper, J., Evans, R., Pritzel, A., Green, T., Figurnov, M., Ronneberger, O., Tunyasuvunakool, K., Bates, R., Žídek, A., Potapenko, A., et al. (2021) · Nature · doi:10.1038/s41586-021-03819-2 · Cited by 43,764
BLAST+: architecture and applications
Camacho, C., Coulouris, G., Avagyan, V., Ma, N., Papadopoulos, J., Bealer, K., & Madden, T. L. (2009) · BMC Bioinformatics · doi:10.1186/1471-2105-10-421 · Cited by 22,074
Varadi, M., Anyango, S., Deshpande, M., Nair, S., Natassia, C., Yordanova, G., Yuan, D., Stroe, O., Wood, G., Laydon, A., et al. (2022) · Nucleic Acids Research · doi:10.1093/nar/gkab1061 · Cited by 7,850
The carbohydrate-active enzyme database: functions and literature
Drula, E., Garron, M.-L., Dogan, S., Lombard, V., Henrissat, B., & Terrapon, N. (2022) · Nucleic Acids Research · doi:10.1093/nar/gkab1045 · Cited by 2,439
Horizontal gene transfer and adaptive evolution in bacteria.
Arnold, B. J., Huang, I.-T., & Hanage, W. P. (2022) · Nature Reviews Microbiology · doi:10.1038/s41579-021-00650-4 · Cited by 869 · cited 1×
“If one of the bacteria obtained the gene cluster coding for the O-antigen from the other via “horizontal gene transfer” (Liu et al. 2020; Arnold et al. 2022) remains to be elucidated.”
BackgroundShiga Toxin (Stx) Classification, Structure, and Function
Melton‐Celsa, A. R. (2014) · Microbiology Spectrum · doi:10.1128/microbiolspec.ehec-0024-2013 · Cited by 575
Jansson, P., Kenne, L., & Widmalm, G. (1989) · Carbohydrate Research · doi:10.1016/0008-6215(89)84069-8 · Cited by 517
Self-citationUpdates to the Symbol Nomenclature for Glycans guidelines
Neelamegham, S., Aoki-Kinoshita, K. F., Bolton, E., Frank, M., Lisacek, F., Lütteke, T., O’Boyle, N. M., Packer, N. H., Stanley, P., Toukach, F. V., et al. (2019) · Glycobiology · doi:10.1093/glycob/cwz045 · Cited by 498
Metadata
- Authors
- Furevi, A., Ståhle, J., Muheim, C., Gkotzis, S., Daley, D. O., Udekwu, K. I., & Widmalm, G.
- Affiliations
- Stockholm University (SE)
- Corresponding author
- Widmalm, Göran
- Venue
- Glycobiology
- Publisher
- Oxford University Press (OUP)
- Published
- 2022-10-14
- Volume
- 33
- Issue
- 4
- Pages
- 289-300
- ISSN
- 0959-6658 (ISSN-L)
- 1460-2423
- PMC
- PMC10191223
- OpenAlex
- W4306174605
- Cited by
- 2
- References
- 68
- Citations by year
- 2024: 2
- FWCI
- 0.32
- Type
- journal article
- Language
- en
- Open access
- hybrid
- doi.org
- Licence
- Locations
- Glycobiology (publishedVersion, cc-by)
- ChemRxiv (acceptedVersion, cc-by-nc-nd)
- PubMed Central (publishedVersion, cc-by)
- PubMed (publishedVersion)
- Epsilon Open Archive (Sveriges lantbruksuniversitet biblioteket (Swedish University of Agricultural Sciences)) (submittedVersion)
- Funders
- Swedish Research Council (2017-03703)
- Knut and Alice Wallenberg Foundation
- Topics
- Life Sciences › Immunology and Microbiology › Microbiology › Escherichia coli research studies
- Physical Sciences › Chemistry › Organic Chemistry › Carbohydrate Chemistry and Synthesis
- Life Sciences › Biochemistry, Genetics and Molecular Biology › Molecular Biology › Glycosylation and Glycoproteins Research
- Keywords
- lipopolysaccharide, O-antigen, tetrasaccharide repeating unit, O-acetylation, glycosyltransferases, biosynthetic gene clusters, chain length distribution, capsular polysaccharide, NMR structure elucidation, CASPER
- MeSH terms
- Escherichia coli, Multigene Family, Lipopolysaccharides, Magnetic Resonance Spectroscopy, O Antigens
About these checks
Registry, retraction, Cites and statistics results are computed, not judged, with one exception: a printed reference that no index lists is read once by a model before it counts as a citation error. Claims are extracted by a model and kept only when their quote appears verbatim in the text; each cited source is then checked, with a model’s help, for whether it says what the claim relies on. Those verdicts can be wrong — read the claim’s quote and the cited source before relying on one.
Statistics and arithmetic are recomputed, not judged.
Confidence bands are shown only for fields calibrated on our annotated test set. None is calibrated yet, so no band is shown.
What counts as a claim ›How we measure confidence ›How we check this ›
Are you an author, or do you see a problem with this page? Request a review
How to cite
Cite CoChat for the checks on this page, and the paper for its own findings.
- This page
- CoChat. (2026). Citation check: Elucidation of the O-antigen structure of Escherichia coli O93 and characterization of its biosynthetic genes. https://app.cochat.ai/papers/10.1093/glycob/cwac069
- The paper
- Furevi, A., Ståhle, J., Muheim, C., Gkotzis, S., Daley, D. O., Udekwu, K. I., & Widmalm, G. (2023). Elucidation of the O-antigen structure of Escherichia coli O93 and characterization of its biosynthetic genes. Glycobiology. https://doi.org/10.1093/glycob/cwac069
Data sources
Bibliographic data: Semantic Scholar, OpenAlex, Crossref.
Contains information from the Semantic Scholar Academic Graph Datasets, made available under the ODC Attribution License (ODC-BY 1.0).
Semantic Scholar’s data is described in: Kinney, R., et al. (2023). The Semantic Scholar Open Data Platform. arXiv:2301.10140.
