

The DOI matches its Crossref record; 48 of the 48 references it cites were found in a registry or an index.
Heterozygous mutations of the voltage-gated sodium channel SCN8A are associated with spike-wave discharges and absence epilepsy in mice
Open accessAbstract
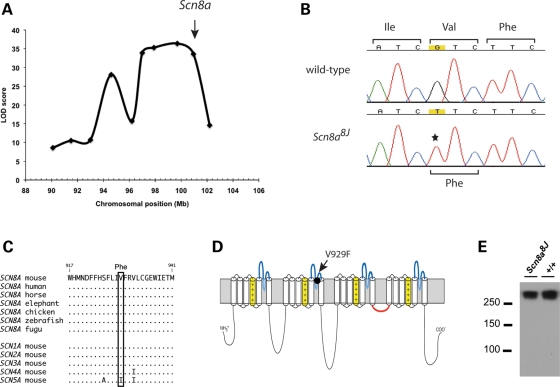
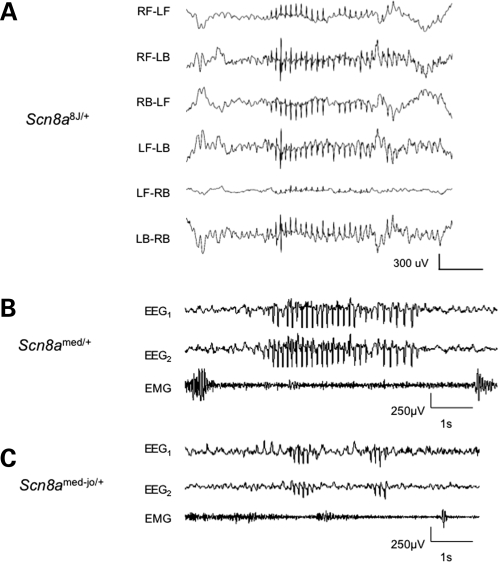
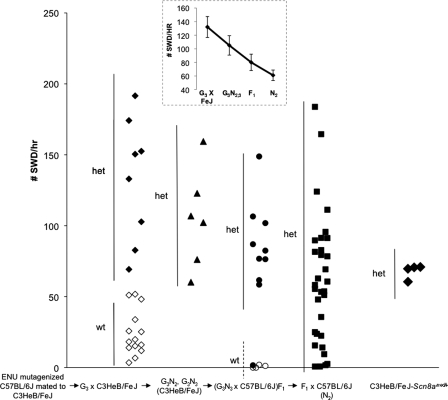
In a chemical mutagenesis screen, we identified the novel Scn8a(8J) allele of the gene encoding the neuronal voltage-gated sodium channel Na(v)1.6. The missense mutation V929F in this allele alters an evolutionarily conserved residue in the pore loop of domain 2 of Na(v)1.6. Electroencephalography (EEG) revealed well-defined spike-wave discharges (SWD), the hallmark of absence epilepsy, in Scn8a(8J) heterozygotes and in heterozygotes for two classical Scn8a alleles, Scn8a(med) (null) and Scn8a(med-jo) (missense). Mouse strain background had a significant effect on SWD, with mutants on the C3HeB/FeJ strain showing a higher incidence than on C57BL/6J. The abnormal EEG patterns in heterozygous mutant mice and the influence of genetic background on SWD make SCN8A an attractive candidate gene for common human absence epilepsy, a genetically complex disorder.
Overview
The claims and statistics of this paper haven’t been checked yet.
Run the check — free, no account needed. It reads the open-access text and checks the sources it cites.
Integrity signals
Registry
Cites
Statistics
Figures
Verification
Claims the paper makes
The claims and statistics of this paper haven’t been checked yet.
Run the check — free, no account needed. It reads the open-access text and checks the sources it cites.
Claims other papers make about this one
Each is checked against this paper’s own text: does it say what the citing paper says it does?
The check wasn’t confident either way, so it gives no verdict — never disputed.
In the citing paper
“However, these splicing changes affect transcripts encoding ion channels, neurotransmitter receptors, structural proteins and Ca2+ signalling molecules”
From The neurogenetics of alternative splicing (2016) · cites this paper as [136]
Experimental — accuracy not yet measuredIn the citing paper
“many of which are associated with seizure disorders in humans or mice, such as the GABAA receptor subunit Gabrg2, Grin1, the voltage-gated sodium channel Scn8a (which encodes NaV1.6), and synaptosomal-associated protein 25 (Snap25)133–137”
From The neurogenetics of alternative splicing (2016) · cites this paper as [136]
Self-check
Percentages, sums and reported differences re-computed from the paper’s own numbers.
The self-check needs the paper’s full text.
Citations
Cites
Yu, F. H., Mantegazza, M., Westenbroek, R. E., Robbins, C. A., Kalume, F., Burton, K. A., Spain, W. J., McKnight, G. S., Scheuer, T., & Catterall, W. A. (2006) · Nature Neuroscience · doi:10.1038/nn1754 · Cited by 1,173
Mutant GABAA receptor γ2-subunit in childhood absence epilepsy and febrile seizures
Wallace, R. H., Marini, C., Petrou, S., Harkin, L. A., Bowser, D. N., Panchal, R. G., Williams, D. A., Sutherland, G. R., Mulley, J. C., Scheffer, I. E., et al. (2001) · Nature Genetics · doi:10.1038/ng0501-49 · Cited by 780
Absence Epilepsy in Tottering Mutant Mice Is Associated with Calcium Channel Defects
Fletcher, C., Lutz, C. M., O’Sullivan, T. N., Shaughnessy, J. D., Hawkes, R. B., Frankel, W. N., Copeland, N. G., & Jenkins, N. A. (1996) · Cell · doi:10.1016/s0092-8674(00)81381-1 · Cited by 772
Self-citationThe Treatment of Epilepsy : Principles and Practice
Wyllie, E. (1997) · Cited by 707
Sodium channel Na v 1.6 is localized at nodes of Ranvier, dendrites, and synapses
Caldwell, J. H., Schaller, K. L., Lasher, R. S., Peles, E., & Levinson, S. R. (2000) · Proceedings of the National Academy of Sciences · doi:10.1073/pnas.090034797 · Cited by 649
The mouse stargazer gene encodes a neuronal Ca2+-channel γ subunit
Letts, V. A., Felix, R., Biddlecome, G. H., Arikkath, J., Mahaffey, C. L., Valenzuela, A., Bartlett, F. S., Mori, Y., Campbell, K. P., & Frankel, W. N. (1998) · Nature Genetics · doi:10.1038/1228 · Cited by 586
Self-citationGenetic Animal Models for Absence Epilepsy: A Review of the WAG/Rij Strain of Rats
Coenen, A. M. L., & van Luijtelaar, E. L. J. M. (2003) · Behavior Genetics · doi:10.1023/a:1026179013847 · Cited by 536
Absence epilepsy and sinus dysrhythmia in mice lacking the pacemaker channel HCN2
Ludwig, A., Budde, T., Stieber, J., Moosmang, S., Wahl, C., Holthoff, K., Langebartels, A., Wotjak, C., Munsch, T., Zong, X., et al. (2003) · The EMBO Journal · doi:10.1093/emboj/cdg032 · Cited by 534
Kim, D., Song, I., Keum, S., Lee, T., Jeong, M.-J., Kim, S.-S., McEnery, M. W., & Shin, H. (2001) · Neuron · doi:10.1016/s0896-6273(01)00343-9 · Cited by 523
Sodium channel mutations in epilepsy and other neurological disorders
Meisler, M. H. (2005) · Journal of Clinical Investigation · doi:10.1172/jci25466 · Cited by 512
Self-citationA single sodium channel mutation produces hyper- or hypoexcitability in different types of neurons
Rush, A. M., Dib‐Hajj, S. D., Liu, S., Cummins, T., Black, J. A., & Waxman, S. G. (2006) · Proceedings of the National Academy of Sciences · doi:10.1073/pnas.0602813103 · Cited by 407
Burgess, D. L., Jones, J. M., Meisler, M. H., & Noebels, J. L. (1997) · Cell · doi:10.1016/s0092-8674(00)81877-2 · Cited by 397
Self-citationRaman, I. M., Sprunger, L. K., Meisler, M. H., & Bean, B. P. (1997) · Neuron · doi:10.1016/s0896-6273(00)80969-1 · Cited by 390
Self-citationBarclay, J., Balaguero, N., Mione, M., Ackerman, S. L., Letts, V. A., Brodbeck, J., Canti, C., Meir, A., Page, K. M., Kusumi, K., et al. (2001) · The Journal of Neuroscience · doi:10.1523/jneurosci.21-16-06095.2001 · Cited by 326
Self-citationCorticothalamic Inputs Control the Pattern of Activity Generated in Thalamocortical Networks
Blumenfeld, H., & McCormick, D. A. (2000) · Journal of Neuroscience · doi:10.1523/jneurosci.20-13-05153.2000 · Cited by 308
The treatment of epilepsy: Principles and practice
Talwar, D. (1993) · Pediatric Neurology · doi:10.1016/0887-8994(93)90119-w · Cited by 235
Polarized distribution of ion channels within microdomains of the axon initial segment
Wart, A. V., Trimmer, J. S., & Matthews, G. (2006) · The Journal of Comparative Neurology · doi:10.1002/cne.21173 · Cited by 222
Reduced cortical inhibition in a mouse model of familial childhood absence epilepsy
Tan, H. O., Reid, C. A., Single, F. N., Davies, P. J., Chiu, C. H., Murphy, S. M., Clarke, A. L., Dibbens, L. M., Krestel, H. E., Mulley, J. C., et al. (2007) · Proceedings of the National Academy of Sciences · doi:10.1073/pnas.0708440104 · Cited by 220
Maurice, N., Tkatch, T., Meisler, M. H., Sprunger, L. K., & Surmeier, D. J. (2001) · Journal of Neuroscience · doi:10.1523/jneurosci.21-07-02268.2001 · Cited by 214
Self-citationThe voltage-gated sodium channel Scn8a is a genetic modifier of severe myoclonic epilepsy of infancy
Martin, M. S., Tang, B., Papale, L. A., Yu, F. H., Catterall, W. A., & Escayg, A. (2007) · Human Molecular Genetics · doi:10.1093/hmg/ddm248 · Cited by 202
Self-citationPowell, K. L., Cain, S. M., Ng, C. L., Sirdesai, S., David, L. S., Kyi, M., Garcı́a, E., Tyson, J. R., Reid, C. A., Bahlo, M., et al. (2009) · Journal of Neuroscience · doi:10.1523/jneurosci.5295-08.2009 · Cited by 192
Trudeau, M., Dalton, J. C., Day, J., Ranum, L. P. W., & Meisler, M. H. (2005) · Journal of Medical Genetics · doi:10.1136/jmg.2005.035667 · Cited by 187
Self-citationCortical-area specific block of genetically determined absence seizures by ethosuximide
Manning, J.-P., Richards, D. A., Leresche, N., Crunelli, V., & Bowery, N. G. (2003) · Neuroscience · doi:10.1016/j.neuroscience.2003.09.026 · Cited by 171
Mutation of sodium channel SCN3A in a patient with cryptogenic pediatric partial epilepsy
Holland, K. D., Kearney, J. A., Glauser, T. A., Buck, G., Keddache, M. A., Blankston, J. R., Glaaser, I. W., Kass, R. S., & Meisler, M. H. (2008) · Neuroscience Letters · doi:10.1016/j.neulet.2007.12.064 · Cited by 166
Self-citationRole of hippocampal sodium channel Nav1.6 in kindling epileptogenesis
Blumenfeld, H., Lampert, A., Klein, J. P., Mission, J. F., Chen, M. C., Rivera, M., Dib‐Hajj, S. D., Brennan, A. R., Hains, B. C., & Waxman, S. G. (2008) · Epilepsia · doi:10.1111/j.1528-1167.2008.01710.x · Cited by 149
Spike-wave discharges and sleep-wake states in rats with absence epilepsy
Drinkenburg, W. H. I. M., Coenen, A. M. L., Vossen, J. M. H., & van Luijtelaar, E. L. J. M. (1991) · Epilepsy Research · doi:10.1016/0920-1211(91)90055-k · Cited by 147
Mutation Detection in the and Alleles of the Sodium Channel
Kohrman, D. C., Harris, J. B., & Meisler, M. H. (1996) · Journal of Biological Chemistry · doi:10.1074/jbc.271.29.17576 · Cited by 140
Self-citationLevin, S. I., Khaliq, Z. M., Aman, T. K., Grieco, T. M., Kearney, J. A., Raman, I. M., & Meisler, M. H. (2006) · Journal of Neurophysiology · doi:10.1152/jn.01193.2005 · Cited by 138
Self-citationDysregulation of sodium channel expression in cortical neurons in a rodent model of absence epilepsy
Klein, J. P., Khera, D. S., Nersesyan, H., Kimchi, E. Y., Waxman, S. G., & Blumenfeld, H. (2003) · Brain Research · doi:10.1016/j.brainres.2003.11.051 · Cited by 137
Absence epilepsy and the level of vigilance in rats of the WAG/Rij strain
Coenen, A. M. L., Drinkenburg, W. H. I. M., Peeters, B. W. M. M., Vossen, J. M. H., & van Luijtelaar, E. L. J. M. (1991) · Neuroscience & Biobehavioral Reviews · doi:10.1016/s0149-7634(05)80005-3 · Cited by 137
Impaired Firing and Cell-Specific Compensation in Neurons Lacking Na v 1.6 Sodium Channels
Wart, A. V., & Matthews, G. (2006) · Journal of Neuroscience · doi:10.1523/jneurosci.1101-06.2006 · Cited by 132
Kohrman, D. C., Smith, M. R., Goldin, A. L., Harris, J. B., & Meisler, M. H. (1996) · Journal of Neuroscience · doi:10.1523/jneurosci.16-19-05993.1996 · Cited by 132
Self-citationSodium channel Nav1.6 accumulates at the site of infraorbital nerve injury
Henry, M. A., Freking, A. R., Johnson, L. R., & Levinson, S. R. (2007) · BMC Neuroscience · doi:10.1186/1471-2202-8-56 · Cited by 124
Efficient expression of rat brain type IIA Na+ channel α subunits in a somatic cell line
West, J. W., Scheuer, T., Maechler, L., & Catterall, W. A. (1992) · Neuron · doi:10.1016/0896-6273(92)90108-p · Cited by 117
Nav1.6 channels generate resurgent sodium currents in spinal sensory neurons
Cummins, T., Dib‐Hajj, S. D., Herzog, R. I., & Waxman, S. G. (2005) · FEBS Letters · doi:10.1016/j.febslet.2005.03.009 · Cited by 112
Mutational analysis ofCACNA1Gin idiopathic generalized epilepsy
Singh, B., Monteil, A., Bidaud, I., Sugimoto, Y., Suzuki, T., Hamano, S., Oguni, H., Ōsawa, M., Alonso, M. E., Delgado‐Escueta, A. V., et al. (2007) · Human Mutation · doi:10.1002/humu.9491 · Cited by 90
Absence seizures in C3H/HeJ and knockout mice caused by mutation of the AMPA receptor subunit Gria4
Beyer, B. J., Deleuze, C., Letts, V. A., Mahaffey, C. L., Boumil, R. M., Lew, T. A., Huguenard, J. R., & Frankel, W. N. (2008) · Human Molecular Genetics · doi:10.1093/hmg/ddn064 · Cited by 85
Self-citationEncyclopedia of basic epilepsy research
Schwartzkroin, P. A. (2009) · Elsevier eBooks · Cited by 79
Sodium Currents in Subthalamic Nucleus Neurons From Na v 1.6-Null Mice
Do, M. T. H., & Bean, B. P. (2004) · Journal of Neurophysiology · doi:10.1152/jn.00186.2004 · Cited by 78
Encyclopedia of Basic Epilepsy Research
(2009) · Elsevier eBooks · doi:10.1016/c2009-1-03727-7 · Cited by 74
Allelic mutations of the sodium channel SCN8A reveal multiple cellular and physiological functions
Meisler, M. H., Plummer, N. W., Burgess, D. L., Buchner, D. A., & Sprunger, L. K. (2004) · Genetica · doi:10.1007/s10709-004-1441-9 · Cited by 67
Self-citationRudolf, G., Bihoreau, M. T., Godfrey, R. F., Wilder, S. P., Cox, R., Lathrop, M. G., Marescaux, C., & Gauguier, D. (2004) · Epilepsia · doi:10.1111/j.0013-9580.2004.50303.x · Cited by 65
Chromosomal Mapping of Genetic Loci Controlling Absence Epilepsy Phenotypes in the WAG/Rij Rat
Gauguier, D., van Luijtelaar, G., Bihoreau, M. T., Wilder, S. P., Godfrey, R. F., Vossen, J. M. H., Coenen, A. M. L., & Cox, R. (2004) · Epilepsia · doi:10.1111/j.0013-9580.2004.13104.x · Cited by 56
Exaggerated emotional behavior in mice heterozygous null for the sodium channel Scn8a (Nav1.6)
McKinney, B. C., Chow, C. Y., Meisler, M. H., & Murphy, G. G. (2008) · Genes Brain & Behavior · doi:10.1111/j.1601-183x.2008.00399.x · Cited by 48
Self-citationFloxed allele for conditional inactivation of the voltage‐gated sodium channel Scn8a (Nav1.6)
Levin, S. I., & Meisler, M. H. (2004) · genesis · doi:10.1002/gene.20050 · Cited by 39
Self-citationFrankel, W. N., Beyer, B. J., Maxwell, C. R., Pretel, S., Letts, V. A., & Siegel, S. J. (2005) · Journal of Neuroscience · doi:10.1523/jneurosci.0231-05.2005 · Cited by 37
Self-citationBuchner, D. A., Seburn, K. L., Frankel, W. N., & Meisler, M. H. (2004) · Mammalian Genome · doi:10.1007/s00335-004-2332-1 · Cited by 24
Self-citationSleep-Related Epilepsy in the A/J Mouse
Strohl, K. P., Gallaugher, L., Lynn, A., Friedman, L., Hill, A. E., Singer, J. B., Lander, E. S., & Nadeau, J. H. (2007) · SLEEP · doi:10.1093/sleep/30.2.169 · Cited by 23
Cited by
Sorted by citations
Veeramah, K. R., O'Brien, J. E., Meisler, M. H., Cheng, X., Dib-Hajj, S. D., Waxman, S. G., Talwar, D., Girirajan, S., Eichler, E. E., Restifo, L. L., et al. (2012) · The American Journal of Human Genetics · doi:10.1016/j.ajhg.2012.01.006 · Cited by 438
Self-citationThe neurogenetics of alternative splicing
Vuong, C. K., Black, D. L., & Zheng, S. (2016) · Nature Reviews Neuroscience · doi:10.1038/nrn.2016.27 · Cited by 340
The splicing regulator Rbfox1 (A2BP1) controls neuronal excitation in the mammalian brain
Gehman, L. T., Stoilov, P., Maguire, J., Damianov, A., Lin, C.-H., Shiue, L., Ares, M., Mody, I., & Black, D. L. (2011) · Nature Genetics · doi:10.1038/ng.841 · Cited by 331
Ion Channels in Genetic Epilepsy: From Genes and Mechanisms to Disease-Targeted Therapies
Oyrer, J., Maljevic, S., Scheffer, I. E., Berkovic, S. F., Petrou, S., & Reid, C. A. (2018) · Pharmacological Reviews · doi:10.1124/pr.117.014456 · Cited by 315
Sodium channel gene family: epilepsy mutations, gene interactions and modifier effects
Meisler, M. H., O’Brien, J. E., & Sharkey, L. M. (2010) · The Journal of Physiology · doi:10.1113/jphysiol.2010.188482 · Cited by 215
Self-citation
Metadata
- Authors
- Papale, L. A., Beyer, B., Jones, J. M., Sharkey, L. M., Tufik, S., Epstein, M., Letts, V. A., Meisler, M. H., Frankel, W. N., & Escayg, A.
- Affiliations
- Emory University (US)
- Jackson Laboratory (US)
- University of Michigan (US)
- Corresponding author
- Frankel, Wayne N.
- ORCID
- Venue
- Human Molecular Genetics
- Publisher
- Oxford University Press (OUP)
- Published
- 2009-03-02
- Volume
- 18
- Issue
- 9
- Pages
- 1633-1641
- ISSN
- 0964-6906 (ISSN-L)
- 1460-2083
- PMC
- PMC2667290
- OpenAlex
- W2120758016
- Cited by
- 127
- References
- 48
- Citations by year
- 2026: 1 · 2025: 6 · 2024: 9 · 2023: 5 · 2022: 3 · 2021: 13 · 2020: 9 · 2019: 11 · 2018: 5 · 2017: 7 · 2016: 5 · 2015: 8 · 2014: 16 · 2013: 11 · 2012: 6
- FWCI
- 3.49
- Type
- journal article
- Language
- en
- Open access
- hybrid
- doi.org
- Licence
- cc-by-nc
- Locations
- Human Molecular Genetics (publishedVersion, cc-by-nc)
- PubMed Central (publishedVersion)
- PubMed (publishedVersion)
- Americanae (AECID Library) (submittedVersion)
- The Mouseion at the JAXlibrary (Jackson Laboratory) (submittedVersion)
- HighWire Press Open Archive (submittedVersion)
- LA Referencia (Red Federada de Repositorios Institucionales de Publicaciones Científicas) (submittedVersion, other-oa)
- Funders
- University of Michigan
- National Institutes of Health
- National Institute of Neurological Disorders and Stroke (NS32801, NS046484, NS 34509, NS31348, R01NS046484, R01NS034509)
- Eunice Kennedy Shriver National Institute of Child Health and Human Development (P01HD042137)
- Topics
- Health Sciences › Medicine › Clinical Neurology › Epilepsy research and treatment
- Life Sciences › Biochemistry, Genetics and Molecular Biology › Molecular Biology › Ion channel regulation and function
- Health Sciences › Medicine › Cardiology and Cardiovascular Medicine › Cardiac electrophysiology and arrhythmias
- Keywords
- SCN8A, absence epilepsy, spike-wave discharges, heterozygous mutation, chemical mutagenesis, mouse genetic background, C57BL/6J mice, candidate genes
- MeSH terms
- Animals, Base Sequence, Disease Models, Animal, Electrophysiology, Epilepsy, Absence, Heterozygote, Humans, Mice, Inbred C3H, Mice, Inbred C57BL, Mice, Transgenic, Molecular Sequence Data, Mutation, Nerve Tissue Proteins, Phenotype, Sodium Channels, Mutation, Missense, Mice, NAV1.6 Voltage-Gated Sodium Channel
About these checks
Registry, retraction, Cites and statistics results are computed, not judged, with one exception: a printed reference that no index lists is read once by a model before it counts as a citation error. Claims are extracted by a model and kept only when their quote appears verbatim in the text; each cited source is then checked, with a model’s help, for whether it says what the claim relies on. Those verdicts can be wrong — read the claim’s quote and the cited source before relying on one.
Statistics and arithmetic are recomputed, not judged.
Confidence bands are shown only for fields calibrated on our annotated test set. None is calibrated yet, so no band is shown.
What counts as a claim ›How we measure confidence ›How we check this ›
Are you an author, or do you see a problem with this page? Request a review
