CoChat

Quantifying microbial guilds

Open access
Rivas-Santisteban, Juan, Yubero, Pablo, Robaina-Estévez, Semidán, González, José M, Tamames, Javier, Pedrós-Alió, Carlos · 2024 · ISME Communications

Published version of a preprint

The DOI matches its Crossref record; 122 of the 122 references it cites were found in a registry or an index.

Abstract

The ecological role of microorganisms is of utmost importance due to their multiple interactions with the environment. However, assessing the contribution of individual taxonomic groups has proven difficult despite the availability of high throughput data, hindering our understanding of such complex systems. Here, we propose a quantitative definition of guild that is readily applicable to metagenomic data. Our framework focuses on the functional character of protein sequences, as well as their diversifying nature. First, we discriminate functional sequences from the whole sequence space corresponding to a gene annotation to then quantify their contribution to the guild composition across environments. In addition, we identify and distinguish functional implementations, which are sequence spaces that have different ways of carrying out the function. In contrast, we found that orthology delineation did not consistently align with ecologically (or functionally) distinct implementations of the function. We demonstrate the value of our approach with two case studies: the ammonia oxidation and polyamine uptake guilds from the Malaspina circumnavigation cruise, revealing novel ecological dynamics of the latter in marine ecosystems. Thus, the quantification of guilds helps us to assess the functional role of different taxonomic groups with profound implications on the study of microbial communities.

Overview

The claims and statistics of this paper haven’t been checked yet.

Free: it reads the open-access text and checks the first 5 claims that cite a source we can check. Create a free account to check every claim.

A few free checks a day · papers already verified open instantly · results are public

Integrity signals

Registry

Crossref · 10.1093/ismeco/ycae042

Cites

122 of 122 references verified0 citation errors · 0 not checkable

Statistics

Figures

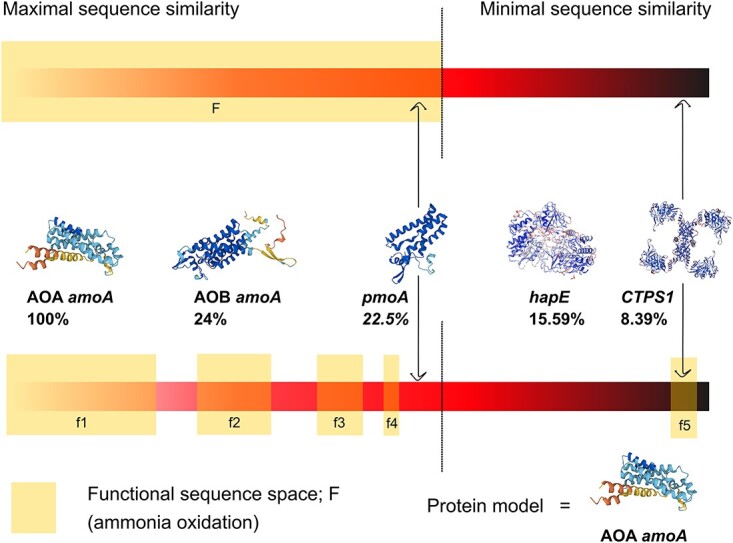
Figure 1 Protein sequence similarity cannot fully anticipate functional activity. Notes: Any particular function can be performed by a plethora of different protein sequences, generated by adaptive evolution and drift. Top: traditionally, automatic annotation considers any given protein sequence below a dissimilarity threshold as functional. Although the threshold can be adjusted, there are several pitfalls: (i) the threshold value is prone to errors; (ii) the functional space may display discontinuities or gaps; and (iii) proteins beyond the dissimilarity threshold may be able to perform the function. Bottom: we exemplify these scenarios with real protein sequences related to the \alpha-subunit of the ammonia monooxygenase (amoA). We show: AOA (archaeal) and AOB (bacterial) amoA sequences well within the similarity threshold; pmoA, which mainly oxidize n-alkanes and usually does not carry out the function but falls within the threshold; hapE, which can oxidize a wide range of acetophenone derivatives, but not ammonia, is beyond the threshold; and CTP-synthase-1, which oxidizes L-glutamine to form a nucleic acid precursor, but it also can oxidize ammonia, thus performing the molecular function, falls well beyond any reasonable sequence similarity to AOA-amoA.
Figure 1 Protein sequence similarity cannot fully anticipate functional activity. Notes: Any particular function can be performed by a plethora of different protein sequences, generated by adaptive evolution and drift. Top: traditionally, automatic annotation considers any given protein sequence below a dissimilarity threshold as functional. Although the threshold can be adjusted, there are several pitfalls: (i) the threshold value is prone to errors; (ii) the functional space may display discontinuities or gaps; and (iii) proteins beyond the dissimilarity threshold may be able to perform the function. Bottom: we exemplify these scenarios with real protein sequences related to the \alpha-subunit of the ammonia monooxygenase (amoA). We show: AOA (archaeal) and AOB (bacterial) amoA sequences well within the similarity threshold; pmoA, which mainly oxidize n-alkanes and usually does not carry out the function but falls within the threshold; hapE, which can oxidize a wide range of acetophenone derivatives, but not ammonia, is beyond the threshold; and CTP-synthase-1, which oxidizes L-glutamine to form a nucleic acid precursor, but it also can oxidize ammonia, thus performing the molecular function, falls well beyond any reasonable sequence similarity to AOA-amoA.CC BY · PubMed Central
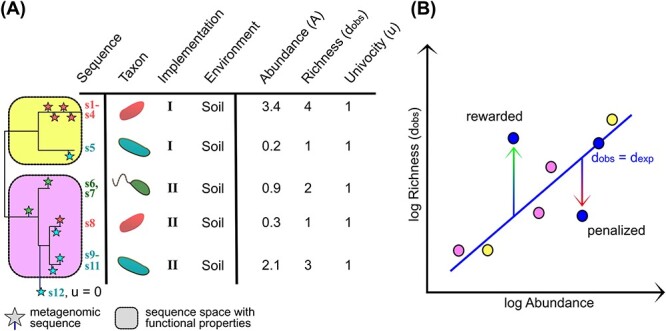
Figure 2 Guild quantification method. Notes: (A) Example showing how abundance, observed diversity, and univocity are calculated. A tree is constructed with reference sequences (lines, far left). Different clusters are (u=1) or are not (u=0) assigned to the function based on available evidence. Metagenomic sequences (stars) are placed in the reference tree. Sequence s_{12} does not fall within the known u=1 clusters and is discarded. The remaining sequences fall in two different clusters (implementations I in yellow and II in pink). A given taxon may have different implementations and different taxa may hold the same. Next, abundance of reads for each cluster (column A, arbitrary abundances are shown as examples) and observed diversity (column d_{\text{obs}}, counting the different unique sequences in each cluster) are calculated. Real metagenomic data quantification is available in Table S4. (B) Calculation of expected diversity, d_{\text{exp}}. In general, the more abundant a gene is, the larger the diversity of sequences. For each gene, these variables show a log–log relationship. When real data from a metagenome are placed in the graph, some show either higher or lower diversity than expected from their abundance. By calculating d_{\text{obs}}/d_{\text{exp}}, we reward the former and penalize the latter.
Figure 2 Guild quantification method. Notes: (A) Example showing how abundance, observed diversity, and univocity are calculated. A tree is constructed with reference sequences (lines, far left). Different clusters are (u=1) or are not (u=0) assigned to the function based on available evidence. Metagenomic sequences (stars) are placed in the reference tree. Sequence s_{12} does not fall within the known u=1 clusters and is discarded. The remaining sequences fall in two different clusters (implementations I in yellow and II in pink). A given taxon may have different implementations and different taxa may hold the same. Next, abundance of reads for each cluster (column A, arbitrary abundances are shown as examples) and observed diversity (column d_{\text{obs}}, counting the different unique sequences in each cluster) are calculated. Real metagenomic data quantification is available in Table S4. (B) Calculation of expected diversity, d_{\text{exp}}. In general, the more abundant a gene is, the larger the diversity of sequences. For each gene, these variables show a log–log relationship. When real data from a metagenome are placed in the graph, some show either higher or lower diversity than expected from their abundance. By calculating d_{\text{obs}}/d_{\text{exp}}, we reward the former and penalize the latter.CC BY · PubMed Central
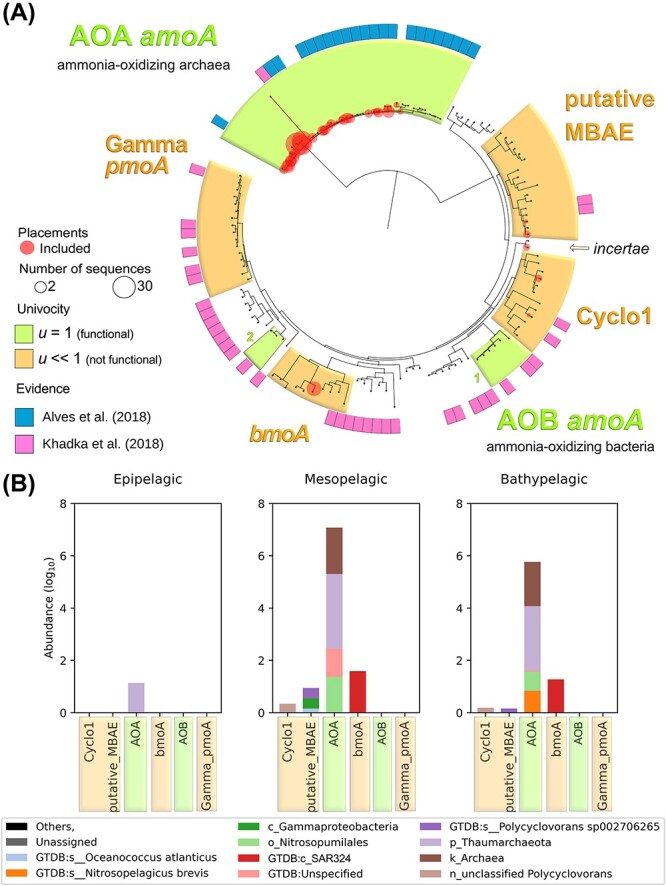
Figure 3 Distinguishing functional from non-functional sequences improves the assessment of the ammonia oxidation guild. Notes: (A) Reconstructed phylogeny of amoA, used as a reference tree to classify ammonia-oxidizing capable sequences. The tree contains 135 sequences with strong functional evidence based on either biochemical or physiological features, or inferred by homology to quality sequences (see Methods). For clarity, we only highlight clusters of sequences where metagenomic Malaspina samples have been successfully placed (full clustering in Fig. S4). Among those, we distinguish sequence clusters with proven ammonium oxidation function (shaded greens) from sequences with a broader substrate spectrum and sequences with evidence of being non-functional for ammonia oxidation (shaded orange). Note that AOA-amoA form a single cluster, but AOB-amoA comprises two dissimilar clusters. Evidence of function was gathered from various sources, albeit the main ones are marked in pink and blue in the outer circle. The size of red circles is proportional to the number of reads. (B) Log representation of abundance values (TPM) of the amoA classified queries found in Malaspina metagenomes (red circles from panel A). We excluded 31% of unique sequences (1.01% of total TPM) corresponding to the non-univocal tree clusters, keeping a conservative criterion.
Figure 3 Distinguishing functional from non-functional sequences improves the assessment of the ammonia oxidation guild. Notes: (A) Reconstructed phylogeny of amoA, used as a reference tree to classify ammonia-oxidizing capable sequences. The tree contains 135 sequences with strong functional evidence based on either biochemical or physiological features, or inferred by homology to quality sequences (see Methods). For clarity, we only highlight clusters of sequences where metagenomic Malaspina samples have been successfully placed (full clustering in Fig. S4). Among those, we distinguish sequence clusters with proven ammonium oxidation function (shaded greens) from sequences with a broader substrate spectrum and sequences with evidence of being non-functional for ammonia oxidation (shaded orange). Note that AOA-amoA form a single cluster, but AOB-amoA comprises two dissimilar clusters. Evidence of function was gathered from various sources, albeit the main ones are marked in pink and blue in the outer circle. The size of red circles is proportional to the number of reads. (B) Log representation of abundance values (TPM) of the amoA classified queries found in Malaspina metagenomes (red circles from panel A). We excluded 31% of unique sequences (1.01% of total TPM) corresponding to the non-univocal tree clusters, keeping a conservative criterion.CC BY · PubMed Central
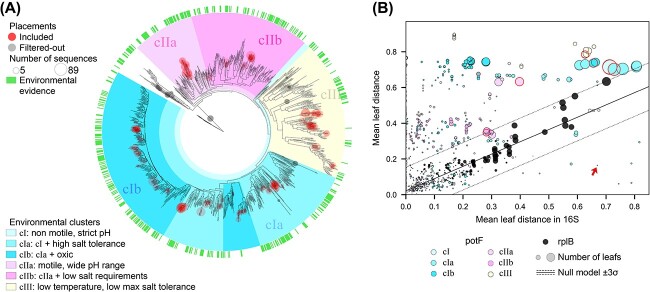
Figure 4 Polyamine uptake implementations revealed by environmental cues are non-synonymous with phylogeny. Notes: (A) A phylogenetic reconstruction of potF, a polyamine-binding subunit of an ABC transporter. Due to the very scarce experimental evidence available, we here determine the different implementations as sequence spaces adapted to specific environmental conditions (see Methods, and Tables S1 and S2). We gathered environmental data for 478 tree locations representing 321 organisms (green tags). We found six nodes enriched by environmental preferences (>10^{4} randomizations, one-tailed P-values <0.003), which included most sequences. Thus, the tree acts as a metagenomic query classifier. (B) To find whether the previous clusters grouped taxonomically related species, we tested the divergence between last common ancestors (LCAs) in the trees of potF and a pair of phylogenetic markers: ribosomal 16S RNA and rplB genes. The average phylogenetic distances between common groups of organisms (nodes in the tree) in the 16S RNA (x-axis) are compared to those in the rplB gene (black dots) or to those in the potF gene (colored dots). The size of the dot represents the number of children leaves compared. The two phylogenetic markers follow a straight line as expected. The potF sequences, however, significantly depart from this linearity. The null model is equivalent to the neutral variation expected from phylogeny and was fitted with a bivariate regression (mean and \pm 3\sigma, black solid and dotted lines). Red edges to the circles highlight the nodes that define the environmental clusters in panel A, which are beyond the taxonomy-related null model. The red arrow shows an example that corresponds with Oceanobacter kriegii and Thalassobius gelatinovorus, where their potF sequences are more similar than what is expected by their taxonomic markers.
Figure 4 Polyamine uptake implementations revealed by environmental cues are non-synonymous with phylogeny. Notes: (A) A phylogenetic reconstruction of potF, a polyamine-binding subunit of an ABC transporter. Due to the very scarce experimental evidence available, we here determine the different implementations as sequence spaces adapted to specific environmental conditions (see Methods, and Tables S1 and S2). We gathered environmental data for 478 tree locations representing 321 organisms (green tags). We found six nodes enriched by environmental preferences (>10^{4} randomizations, one-tailed P-values <0.003), which included most sequences. Thus, the tree acts as a metagenomic query classifier. (B) To find whether the previous clusters grouped taxonomically related species, we tested the divergence between last common ancestors (LCAs) in the trees of potF and a pair of phylogenetic markers: ribosomal 16S RNA and rplB genes. The average phylogenetic distances between common groups of organisms (nodes in the tree) in the 16S RNA (x-axis) are compared to those in the rplB gene (black dots) or to those in the potF gene (colored dots). The size of the dot represents the number of children leaves compared. The two phylogenetic markers follow a straight line as expected. The potF sequences, however, significantly depart from this linearity. The null model is equivalent to the neutral variation expected from phylogeny and was fitted with a bivariate regression (mean and \pm 3\sigma, black solid and dotted lines). Red edges to the circles highlight the nodes that define the environmental clusters in panel A, which are beyond the taxonomy-related null model. The red arrow shows an example that corresponds with Oceanobacter kriegii and Thalassobius gelatinovorus, where their potF sequences are more similar than what is expected by their taxonomic markers.CC BY · PubMed Central
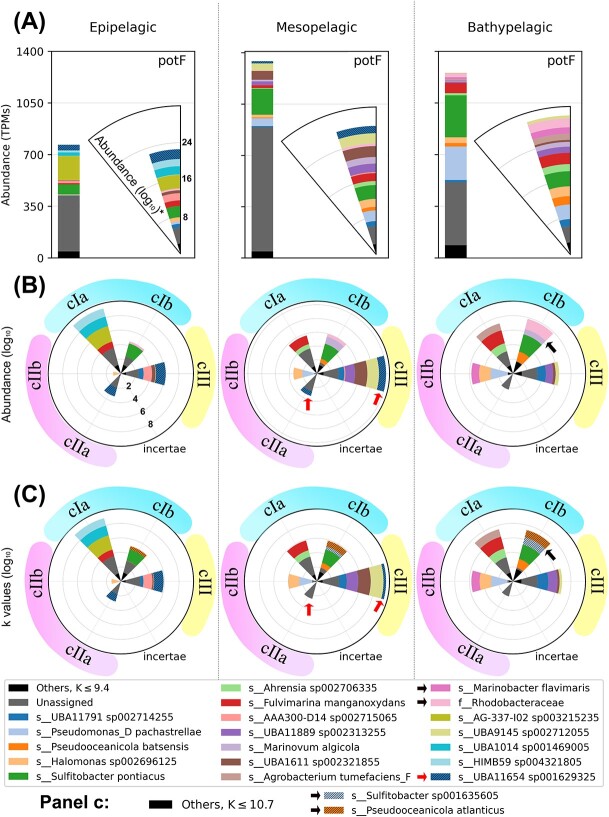
Figure 5 Our guild approach identifies important ecological patterns in the polyamine uptake guild in contrast to the traditional approach. Notes: (A) The output of a standard automatic metagenomic analysis. The results have been displayed as histograms and as radial plots with stacked log values to improve the visualization of taxa spanning different orders of magnitude. (B) Our guild approach considering only abundance. (C) The impact coefficients, which also ponder sequence richness, shown across three environments (columns). What in the automatic annotation was a single bar has been split into several sectors, each of them corresponding to one of the implementations as identified in Fig. 4A. We only show taxa with the largest contributions, the rest are grouped under the “Others” tag (black). The contribution to the function fluctuates in both taxonomic identity and implementation preference with non-trivial relationships with depth. For example, UBA11654 sp001629325 (striped blue, red arrows) contributes in the epipelagic with two different implementations, cIII and cIIa, while it only contributes through cIII in the mesopelagic, and disappears in the bathypelagic. Moreover, Sulfitobacter sp. and P. atlanticus (black arrows) were only visible considering expected richness. Note how easy it is to observe distinct functional trends for each taxon, in contrast with traditional approaches (panel A). The incertae implementation is representing the absence of k values in the undefined sequence spaces of the reference tree.
Figure 5 Our guild approach identifies important ecological patterns in the polyamine uptake guild in contrast to the traditional approach. Notes: (A) The output of a standard automatic metagenomic analysis. The results have been displayed as histograms and as radial plots with stacked log values to improve the visualization of taxa spanning different orders of magnitude. (B) Our guild approach considering only abundance. (C) The impact coefficients, which also ponder sequence richness, shown across three environments (columns). What in the automatic annotation was a single bar has been split into several sectors, each of them corresponding to one of the implementations as identified in Fig. 4A. We only show taxa with the largest contributions, the rest are grouped under the “Others” tag (black). The contribution to the function fluctuates in both taxonomic identity and implementation preference with non-trivial relationships with depth. For example, UBA11654 sp001629325 (striped blue, red arrows) contributes in the epipelagic with two different implementations, cIII and cIIa, while it only contributes through cIII in the mesopelagic, and disappears in the bathypelagic. Moreover, Sulfitobacter sp. and P. atlanticus (black arrows) were only visible considering expected richness. Note how easy it is to observe distinct functional trends for each taxon, in contrast with traditional approaches (panel A). The incertae implementation is representing the absence of k values in the undefined sequence spaces of the reference tree.CC BY · PubMed Central
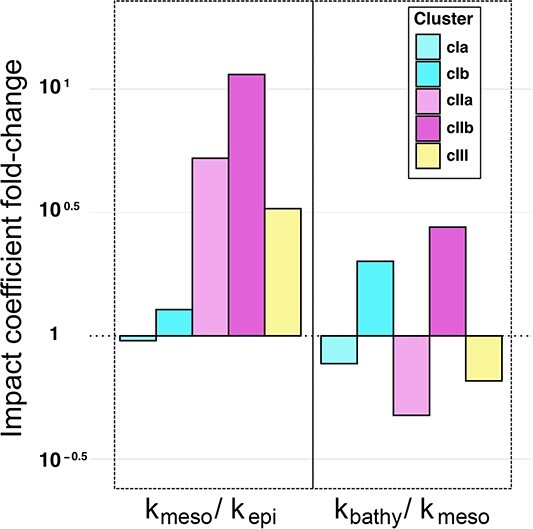
Figure 6 Changes with depth in the importance of the polyamine uptake guild. An advantage of using the impact coefficients to determine the structure of a guild is that we can visualize the functional contribution in a variety of ways. For example, here we look at the fold changes in the contribution between different ocean layers for different implementations. First, the k values of each implementation are added for each layer (k_{\text{epi}}, k_{\text{meso}}, k_{\text{bathy}}). Then the values for two different layers are divided (k_{\text{meso}}/k_{\text{epi}}, k_{\text{bathy}}/k_{\text{meso}}). It is easily observed which implementations depend the most on depth; in this case, cIIa and cIIb, sequence spaces putatively adapted to a wide pH range. Interestingly, the sharp changes in these two implementations correspond with the area of the water column with the largest shift in pH toward acidity in the oxycline (Fig. S8).
Figure 6 Changes with depth in the importance of the polyamine uptake guild. An advantage of using the impact coefficients to determine the structure of a guild is that we can visualize the functional contribution in a variety of ways. For example, here we look at the fold changes in the contribution between different ocean layers for different implementations. First, the k values of each implementation are added for each layer (k_{\text{epi}}, k_{\text{meso}}, k_{\text{bathy}}). Then the values for two different layers are divided (k_{\text{meso}}/k_{\text{epi}}, k_{\text{bathy}}/k_{\text{meso}}). It is easily observed which implementations depend the most on depth; in this case, cIIa and cIIb, sequence spaces putatively adapted to a wide pH range. Interestingly, the sharp changes in these two implementations correspond with the area of the water column with the largest shift in pH toward acidity in the oxycline (Fig. S8).CC BY · PubMed Central

Verification

Claims the paper makes

The claims and statistics of this paper haven’t been checked yet.

Free: it reads the open-access text and checks the first 5 claims that cite a source we can check. Create a free account to check every claim.

A few free checks a day · papers already verified open instantly · results are public

Claims other papers make about this one

Each is checked against this paper’s own text: does it say what the citing paper says it does?

Self-check

Percentages, sums and reported differences re-computed from the paper’s own numbers.

The self-check needs the paper’s full text.

Citations

Cites

1 retracted

Show all 122 references

Research works printed but not linked: 1

  1. Robaina-Estévez, 2022, Pynteny: Synteny-Aware HMM Searches Made Easy

Cited by

See all 15

Metadata

Authors
Rivas-Santisteban, J., Yubero, P., Robaina-Estévez, S., González, J. M., Tamames, J., & Pedrós-Alió, C.
Affiliations
  • Consejo Superior de Investigaciones Científicas (ES)
  • Department of Microbiology, University of La Laguna , Spain
  • Universidad de La Laguna (ES)
  • Microbiome Analysis Laboratory , Centro Nacional de Biotecnología , Madrid, 28049 , Spain
Corresponding author
Rivas-Santisteban, Juan
Venue
ISME Communications
Published
2024-01-01
Volume
4
Issue
1
Pages
ycae042-ycae042
ISSN
2730-6151 (ISSN-L)
OpenAlex
W4393215781
Cited by
15
References
121
Citations by year
2026: 6 · 2025: 8 · 2024: 1
FWCI
4.12
Type
journal article
Language
en
Open access
Locations
  • ISME Communications (publishedVersion, cc-by)
  • bioRxiv (Cold Spring Harbor Laboratory) (acceptedVersion, cc-by-nc-nd)
  • PubMed Central (publishedVersion, cc-by)
  • PubMed (publishedVersion)
Funders
  • CSIC Open Access Publication Support Initiative
  • Unit of Information Resources for Research
  • Spanish Ministerio de Ciencia e Innovación and the European Social Fund (PRE2020-096130)
Topics
  • Physical Sciences › Environmental Science › Ecology › Microbial Community Ecology and Physiology
  • Life Sciences › Biochemistry, Genetics and Molecular Biology › Molecular Biology › Genomics and Phylogenetic Studies
  • Physical Sciences › Environmental Science › Ecology › Environmental DNA in Biodiversity Studies
Keywords
microbial guilds, metagenomics, sequence spaces, orthology, ammonia oxidation, polyamine uptake, marine microbial communities, microbial ecology

About these checks

Registry, retraction, Cites and statistics results are computed, not judged, with one exception: a printed reference that no index lists is read once by a model before it counts as a citation error. Claims are extracted by a model and kept only when their quote appears verbatim in the text; each cited source is then checked, with a model’s help, for whether it says what the claim relies on. Those verdicts can be wrong — read the claim’s quote and the cited source before relying on one.

Statistics and arithmetic are recomputed, not judged.

Confidence bands are shown only for fields calibrated on our annotated test set. None is calibrated yet, so no band is shown.

What counts as a claim ›How we measure confidence ›How we check this ›

Are you an author, or do you see a problem with this page? Request a review

How to cite

Cite CoChat for the checks on this page, and the paper for its own findings.

This page
CoChat. (2026). Citation check: Quantifying microbial guilds. https://app.cochat.ai/papers/10.1093/ismeco/ycae042
The paper
Rivas-Santisteban, J., Yubero, P., Robaina-Estévez, S., González, J. M., Tamames, J., & Pedrós-Alió, C. (2024). Quantifying microbial guilds. ISME Communications. https://doi.org/10.1093/ismeco/ycae042

Data sources

Bibliographic data: Semantic Scholar, OpenAlex, Crossref.

Contains information from the Semantic Scholar Academic Graph Datasets, made available under the ODC Attribution License (ODC-BY 1.0).

Semantic Scholar’s data is described in: Kinney, R., et al. (2023). The Semantic Scholar Open Data Platform. arXiv:2301.10140.