

Quantifying representativeness in randomized clinical trials using machine learning fairness metrics
Open accessPublished version of a preprint
The DOI matches its Crossref record; 58 of the 58 references it cites were found in a registry or an index.
Abstract
Objective: We help identify subpopulations underrepresented in randomized clinical trials (RCTs) cohorts with respect to national, community-based or health system target populations by formulating population representativeness of RCTs as a machine learning (ML) fairness problem, deriving new representation metrics, and deploying them in easy-to-understand interactive visualization tools. Materials and Methods: We represent RCT cohort enrollment as random binary classification fairness problems, and then show how ML fairness metrics based on enrollment fraction can be efficiently calculated using easily computed rates of subpopulations in RCT cohorts and target populations. We propose standardized versions of these metrics and deploy them in an interactive tool to analyze 3 RCTs with respect to type 2 diabetes and hypertension target populations in the National Health and Nutrition Examination Survey. Results: We demonstrate how the proposed metrics and associated statistics enable users to rapidly examine representativeness of all subpopulations in the RCT defined by a set of categorical traits (eg, gender, race, ethnicity, smoking status, and blood pressure) with respect to target populations. Discussion: The normalized metrics provide an intuitive standardized scale for evaluating representation across subgroups, which may have vastly different enrollment fractions and rates in RCT study cohorts. The metrics are beneficial complements to other approaches (eg, enrollment fractions) used to identify generalizability and health equity of RCTs. Conclusion: By quantifying the gaps between RCT and target populations, the proposed methods can support generalizability evaluation of existing RCT cohorts. The interactive visualization tool can be readily applied to identified underrepresented subgroups with respect to any desired source or target populations.
Overview
The claims and statistics of this paper haven’t been checked yet.
Free: it reads the open-access text and checks the first 5 claims that cite a source we can check. Create a free account to check every claim.
Integrity signals
Registry
Cites
Statistics
Figures
Verification
Claims the paper makes
The claims and statistics of this paper haven’t been checked yet.
Free: it reads the open-access text and checks the first 5 claims that cite a source we can check. Create a free account to check every claim.
Self-check
Percentages, sums and reported differences re-computed from the paper’s own numbers.
The self-check needs the paper’s full text.
Citations
Cites
Ahmed, A., Jorna, T., & Bhandari, S. (2016) · Nephron · doi:10.1159/000447068 · Cited by 11,717
A Randomized Trial of Intensive versus Standard Blood-Pressure Control
The SPRINT Research Group (2015) · New England Journal of Medicine · doi:10.1056/nejmoa1511939 · Cited by 6,325
The ALLHAT Officers and Coordinators for the ALLHAT Collaborative Research Group (2002) · JAMA: The Journal of the American Medical Association · doi:10.1001/jama.288.23.2981 · Cited by 5,664
Equality of Opportunity in Supervised Learning
Hardt, M., Price, E., & Srebro, N. (2016) · arXiv · doi:10.48550/arxiv.1610.02413 · Cited by 2,536
Analysis of Complex Survey Samples
Lumley, T. (2004) · Journal of Statistical Software · doi:10.18637/jss.v009.i08 · Cited by 2,425
Participation in Cancer Clinical Trials: Race-, Sex-, and Age-Based Disparities
Murthy, V. H., Krumholz, H. M., & Gross, C. P. (2004) · JAMA · doi:10.1001/jama.291.22.2720 · Cited by 2,078
Certifying and Removing Disparate Impact
Feldman, M., Friedler, S. A., Moeller, J., Scheidegger, C., & Venkatasubramanian, S. (2015) · Proceedings of the 21th ACM SIGKDD International Conference on Knowledge Discovery and Data Mining · doi:10.1145/2783258.2783311 · Cited by 1,827
Bellamy, R. K. E., Dey, K., Hind, M., Hoffman, S. C., Houde, S., Kannan, K., Lohia, P., Martino, J., Mehta, S., Mojsilovic, A., et al. (2018) · arXiv · doi:10.48550/arxiv.1810.01943 · Cited by 1,581
U.S. Disparities in Health: Descriptions, Causes, and Mechanisms
Adler, N. E., & Rehkopf, D. H. (2008) · Annual Review of Public Health · doi:10.1146/annurev.publhealth.29.020907.090852 · Cited by 1,212 · cited 2×
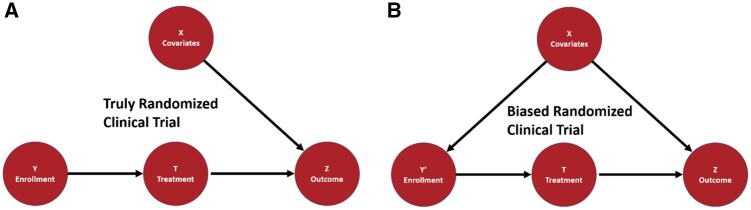
“Our contributions The contributions discussed in this paper are (1) formulating the problem of representativeness evaluation in RCTs as a comparison between a truly random sampling function in a target population and the actual sampling observed in the clinical trial cohort; (2) deriving new metrics for representative…”
BackgroundMethod(2017) · PubMed · Cited by 961
AI Fairness 360: An extensible toolkit for detecting and mitigating algorithmic bias
Bellamy, R. K. E., Dey, K., Hind, M., Hoffman, S. C., Houde, S., Kannan, K., Lohia, P., Martino, J., Mehta, S., Mojsilović, A., et al. (2019) · IBM Journal of Research and Development · doi:10.1147/jrd.2019.2942287 · Cited by 884
Kennedy-Martin, T., Curtis, S., Faries, D., Robinson, S., & Johnston, J. (2015) · Trials · doi:10.1186/s13063-015-1023-4 · Cited by 878
Estimating the success of re-identifications in incomplete datasets using generative models
Rocher, L., Hendrickx, J. M., & de Montjoye, Y.-A. (2019) · Nature Communications · doi:10.1038/s41467-019-10933-3 · Cited by 816
Action to Control Cardiovascular Risk in Diabetes (ACCORD) Trial: Design and Methods
Buse, J. B. (2007) · The American Journal of Cardiology · doi:10.1016/j.amjcard.2007.03.003 · Cited by 661
The Use of Propensity Scores to Assess the Generalizability of Results from Randomized Trials
Stuart, E. A., Cole, S. R., Bradshaw, C. P., & Leaf, P. J. (2011) · Journal of the Royal Statistical Society Series A: Statistics in Society · doi:10.1111/j.1467-985x.2010.00673.x · Cited by 524
Preventing Fairness Gerrymandering: Auditing and Learning for Subgroup Fairness
Kearns, M., Neel, S., Roth, A., & Wu, Z. S. (2017) · arXiv · doi:10.48550/arxiv.1711.05144 · Cited by 469
Moore, J. T., Ricaldi, J. N., Rose, C. E., Fuld, J., Parise, M., Kang, G. J., Driscoll, A. K., Norris, T., Wilson, N., Rainisch, G., et al. (2020) · MMWR. Morbidity and Mortality Weekly Report · doi:10.15585/mmwr.mm6933e1 · Cited by 360
Race, Ethnicity, and Age Trends in Persons Who Died from COVID-19 — United States, May–August 2020
Gold, J. A. W., Rossen, L. M., Ahmad, F. B., Sutton, P., Li, Z., Salvatore, P. P., Coyle, J. P., DeCuir, J., Baack, B. N., Durant, T. M., et al. (2020) · MMWR. Morbidity and Mortality Weekly Report · doi:10.15585/mmwr.mm6942e1 · Cited by 336
Randomization in clinical studies
Lim, C.-Y., & In, J. (2019) · Korean Journal of Anesthesiology · doi:10.4097/kja.19049 · Cited by 307
50 Years of Test (Un)fairness: Lessons for Machine Learning
Hutchinson, B., & Mitchell, M. (2019) · Proceedings of the Conference on Fairness, Accountability, and Transparency · doi:10.1145/3287560.3287600 · Cited by 297
Assessing the generalizability of randomized trial results to target populations
Stuart, E. A., Bradshaw, C. P., & Leaf, P. J. (2015) · Prevention Science · doi:10.1007/s11121-014-0513-z · Cited by 296
Fairness in Deep Learning: A Computational Perspective
Du, M., Yang, F., Zou, N., & Hu, X. (2021) · IEEE Intelligent Systems · doi:10.1109/mis.2020.3000681 · Cited by 215
Erves, J. C., Mayo-Gamble, T. L., Malin-Fair, A., Boyer, A., Joosten, Y., Vaughn, Y. C., Sherden, L., Luther, P., Miller, S., & Wilkins, C. H. (2017) · Journal of Community Health · doi:10.1007/s10900-016-0279-2 · Cited by 212
Welch, V. A., Norheim, O. F., Jull, J., Cookson, R., Sommerfelt, H., Tugwell, P., & Symposium, C.-E. A. B. E. (2017) · BMJ · doi:10.1136/bmj.j5085 · Cited by 205
The Consolidated Standards of Reporting Trials (CONSORT): Guidelines for Reporting Randomized Trials
Bennett, J. A. (2005) · Nursing Research · doi:10.1097/00006199-200503000-00007 · Cited by 185
Srivastava, M., Heidari, H., & Krause, A. (2019) · Proceedings of the 25th ACM SIGKDD International Conference on Knowledge Discovery & Data Mining · doi:10.1145/3292500.3330664 · Cited by 179
A Confidence-Based Approach for Balancing Fairness and Accuracy
Fish, B., Kun, J., & Lelkes, Á. D. (2016) · Proceedings of the 2016 SIAM International Conference on Data Mining · doi:10.1137/1.9781611974348.17 · Cited by 156
Saxena, N. A., Huang, K., DeFilippis, E., Radanovic, G., Parkes, D. C., & Liu, Y. (2019) · Proceedings of the 2019 AAAI/ACM Conference on AI, Ethics, and Society · doi:10.1145/3306618.3314248 · Cited by 155
How Generalizable Is Your Experiment? An Index for Comparing Experimental Samples and Populations
Tipton, E. (2014) · Journal of Educational and Behavioral Statistics · doi:10.3102/1076998614558486 · Cited by 134
Clinical Trial Generalizability Assessment in the Big Data Era: A Review
He, Z., Tang, X., Yang, X., Guo, Y., George, T. J., Charness, N., Quan Hem, K. B., Hogan, W., & Bian, J. (2020) · Clinical and Translational Science · doi:10.1111/cts.12764 · Cited by 130
COVID‐19 and the Widening Gap in Health Inequity
Krouse, H. J. (2020) · Otolaryngology–Head and Neck Surgery · doi:10.1177/0194599820926463 · Cited by 128
Priorities for Research on Equity and Health: Towards an Equity-Focused Health Research Agenda
Östlin, P., Schrecker, T., Sadana, R., Bonnefoy, J., Gilson, L., Hertzman, C., Kelly, M. P., Kjellstrom, T., Labonté, R., Lundberg, O., et al. (2011) · PLoS Medicine · doi:10.1371/journal.pmed.1001115 · Cited by 116
Putting Fairness Principles into Practice: Challenges, Metrics, and Improvements
Beutel, A., Chen, J., Doshi, T., Qian, H., Woodruff, A., Luu, C., Kreitmann, P., Bischof, J., & Chi, E. H. (2019) · Proceedings of the 2019 AAAI/ACM Conference on AI, Ethics, and Society · doi:10.1145/3306618.3314234 · Cited by 111
Aristizabal, P., Singer, J., Cooper, R., Wells, K. J., Nodora, J., Milburn, M., Gahagan, S., Schiff, D. E., & Martinez, M. E. (2015) · Pediatric Blood & Cancer · doi:10.1002/pbc.25472 · Cited by 106
A Reductions Approach to Fair Classification
Agarwal, A., Beygelzimer, A., Dudı́k, M., Langford, J. C., & Wallach, H. (2018) · arXiv (Cornell University) · doi:10.48550/arxiv.1803.02453 · Cited by 95
CONSORT: when and how to use it
Falci, S. G. M., & Marques, L. S. (2015) · Dental Press Journal of Orthodontics · doi:10.1590/2176-9451.20.3.013-015.ebo · Cited by 88
Kline, N. (2020) · Health Equity · doi:10.1089/heq.2020.0012 · Cited by 75
Einhorn, P. T., Davis, B. R., Massie, B. M., Cushman, W. C., Piller, L. B., Simpson, L. M., Levy, D. A., Nwachuku, C., & Black, H. R. (2006) · American Heart Journal · doi:10.1016/j.ahj.2006.10.012 · Cited by 70
Fairness without Harm: Decoupled Classifiers with Preference Guarantees
Ustun, B., Liu, Y., & Parkes, D. C. (2019) · International Conference on Machine Learning · Cited by 64
Modeling the behavior of the 4/5ths rule for determining adverse impact: Reasons for caution.
Roth, P. L., Bobko, P., & Switzer, F. S. (2006) · Journal of Applied Psychology · doi:10.1037/0021-9010.91.3.507 · Cited by 58
COVID-19 disparities: An urgent call for race reporting and representation in clinical research
Borno, H. T., Zhang, S., & Gomez, S. L. (2020) · Contemporary Clinical Trials Communications · doi:10.1016/j.conctc.2020.100630 · Cited by 57
Demographic diversity of participants in Pfizer sponsored clinical trials in the United States
Rottas, M. M., Thadeio, P. F., Simons, R., Houck, R., Gruben, D. C., Keller, D., Scholfield, D., Soma, K., Corrigan, B., Schettino, A., et al. (2021) · Contemporary Clinical Trials · doi:10.1016/j.cct.2021.106421 · Cited by 50
Measuring Non-Expert Comprehension of Machine Learning Fairness MetricsPreprint
Saha, D., Schumann, C., McElfresh, D. C., Dickerson, J. P., Mazurek, M. L., & Tschantz, M. C. (2020) · arXiv (Cornell University) · doi:10.48550/arxiv.2001.00089 · Cited by 47
Oparil, S., Davis, B. R., Cushman, W. C., Ford, C. E., Furberg, C. D., Habib, G. B., Haywood, L. J., Margolis, K. L., Probstfield, J. L., Whelton, P. K., et al. (2013) · Hypertension · doi:10.1161/hypertensionaha.111.00213 · Cited by 45
In Support of Clinical Case Reports: A System of Causality Assessment
Kiene, H., Hamre, H. J., & Kienle, G. S. (2013) · Global Advances in Health and Medicine · doi:10.7453/gahmj.2012.061 · Cited by 42
Economics Dimensions of Health Inequities: The Role of Implementation Research
Engelgau, M. M., Zhang, P., Jan, S., & Mahal, A. S. (2019) · Ethnicity & Disease · doi:10.18865/ed.29.s1.103 · Cited by 36
Sen, A. K., Chakrabarti, S., Goldstein, A., Wang, S., Ryan, P. B., & Weng, C. (2016) · Journal of Biomedical Informatics · doi:10.1016/j.jbi.2016.09.003 · Cited by 30
Disparities in Cancer Screening Practices among Minority and Underrepresented Populations
Gray, T. F., Cudjoe, J., Murphy, J., Thorpe, R. J., Wenzel, J. A., & Han, H. (2017) · Seminars in Oncology Nursing · doi:10.1016/j.soncn.2017.02.008 · Cited by 30
Causal inference in randomized clinical trials
Zheng, C., Dai, R., Gale, R. P., & Zhang, M. (2019) · Bone Marrow Transplantation · doi:10.1038/s41409-018-0424-x · Cited by 26
COVID-19 Amplifiers on Health Inequity Among the Older Populations
Lee, S. (2021) · Frontiers in Public Health · doi:10.3389/fpubh.2020.609695 · Cited by 21
Multivariate analysis of the population representativeness of related clinical studies
He, Z., Ryan, P. B., Hoxha, J., Wang, S., Carini, S., Sim, I., & Weng, C. (2016) · Journal of Biomedical Informatics · doi:10.1016/j.jbi.2016.01.007 · Cited by 20
Li, Q., Guo, Y. M., He, Z., Zhang, H., George, T. J., & Bian, J. (2020) · medRxiv · doi:10.1101/2020.08.02.20166629 · Cited by 14
Simulation-based Evaluation of the Generalizability Index for Study Traits.
He, Z., Chandar, P., Ryan, P. B., & Weng, C. (2015) · PubMed · Cited by 12
Sex differences in hypertension and other cardiovascular diseases
Delles, C., & Currie, G. E. (2018) · Journal of Hypertension · doi:10.1097/hjh.0000000000001655 · Cited by 12
Vasileva, M. I. (2020) · ACM SIGKDD Conference on Knowledge Discovery and Data Mining (KDD) · doi:10.1145/3394486.3411068 · Cited by 11
A Clinician's Guide to Specification and Sampling
Roach, K. E. (2001) · Journal of Orthopaedic and Sports Physical Therapy · doi:10.2519/jospt.2001.31.12.753 · Cited by 9
Pradhan, R., Abrahami, D., Yin, H., Yu, O. H. Y., Sahasrabudhe, V., Andre, E. B., & Azoulay, L. (2021) · Clinical Pharmacology & Therapeutics · doi:10.1002/cpt.2213 · Cited by 9
Cohen, D. L., & Townsend, R. R. (2016) · Journal of Clinical Hypertension · doi:10.1111/jch.12766 · Cited by 7
Cited by
Artificial intelligence applied to clinical trials: opportunities and challenges
Askin, S., Burkhalter, D., Calado, G., & El Dakrouni, S. (2023) · Health and Technology · doi:10.1007/s12553-023-00738-2 · Cited by 285
The Problem of Fairness in Synthetic Healthcare Data
Bhanot, K., Qi, M., Erickson, J. S., Guyon, I., & Bennett, K. P. (2021) · Entropy · doi:10.3390/e23091165 · Cited by 91
Self-citationHomeyer, A., Geißler, C., Schwen, L. O., Zakrzewski, F., Evans, T., Strohmenger, K., Westphal, M., Bülow, R. D., Kargl, M., Karjauv, A., et al. (2022) · Modern Pathology · doi:10.1038/s41379-022-01147-y · Cited by 95
An Ontology for Fairness Metrics
Franklin, J. S., Bhanot, K., Ghalwash, M. F., Bennett, K. P., McCusker, J. P., & McGuinness, D. L. (2022) · Proceedings of the AAAI/ACM Conference on AI Ethics and Society · doi:10.1145/3514094.3534137 · Cited by 55
Self-citationQi, M., Santos, H., da Silva, P. P., McGuinness, D. L., & Bennett, K. P. (2023) · PLoS ONE · doi:10.1371/journal.pone.0290692 · Cited by 51
Self-citation
Metadata
- Authors
- Qi, M., Cahan, O., Foreman, M. A., Gruen, D. M., Das, A. K., & Bennett, K. P.
- Affiliations
- Rensselaer Polytechnic Institute (US)
- IBM Research - Cambridge (United States) (US)
- Corresponding author
- Bennett, Kristin P
- Venue
- JAMIA Open
- Publisher
- Oxford University Press (OUP)
- Published
- 2021-07-01
- Volume
- 4
- Issue
- 3
- Pages
- ooab077-ooab077
- ISSN
- 2574-2531 (ISSN-L)
- PMC
- PMC8460438
- OpenAlex
- W3202137438
- Cited by
- 27
- References
- 57
- Citations by year
- 2026: 4 · 2025: 2 · 2024: 7 · 2023: 8 · 2022: 5 · 2021: 1
- FWCI
- 4.55
- Type
- journal article
- Language
- en
- Open access
- gold
- doi.org
- Licence
- Locations
- JAMIA Open (publishedVersion, cc-by-nc)
- medRxiv (acceptedVersion)
- Europe PMC (PubMed Central) (publishedVersion, other-oa)
- PubMed Central (publishedVersion, cc-by-nc)
- PubMed (publishedVersion)
- Funders
- IBM Research AI Horizons Network
- United Health Foundation
- Topics
- Health Sciences › Medicine › Public Health, Environmental and Occupational Health › Ethics in Clinical Research
- Physical Sciences › Mathematics › Statistics and Probability › Statistical Methods in Clinical Trials
- Physical Sciences › Mathematics › Statistics and Probability › Statistical Methods in Epidemiology
- Keywords
- representativeness, randomized controlled trials, generalizability, health equity, interactive visualization, type 2 diabetes, hypertension, NHANES, target population
About these checks
Registry, retraction, Cites and statistics results are computed, not judged, with one exception: a printed reference that no index lists is read once by a model before it counts as a citation error. Claims are extracted by a model and kept only when their quote appears verbatim in the text; each cited source is then checked, with a model’s help, for whether it says what the claim relies on. Those verdicts can be wrong — read the claim’s quote and the cited source before relying on one.
Statistics and arithmetic are recomputed, not judged.
Confidence bands are shown only for fields calibrated on our annotated test set. None is calibrated yet, so no band is shown.
What counts as a claim ›How we measure confidence ›How we check this ›
Are you an author, or do you see a problem with this page? Request a review
Data sources
Bibliographic data: Semantic Scholar, OpenAlex, Crossref.
Contains information from the Semantic Scholar Academic Graph Datasets, made available under the ODC Attribution License (ODC-BY 1.0).
Semantic Scholar’s data is described in: Kinney, R., et al. (2023). The Semantic Scholar Open Data Platform. arXiv:2301.10140.
