

The DOI matches its Crossref record; 5 of the 5 references it cites were found in a registry or an index.
Founders, Drift, and Infidelity: The Relationship between Y Chromosome Diversity and Patrilineal Surnames
Overview
The claims and statistics of this paper haven’t been checked yet.
Run the check — free, no account needed. It reads the open-access text and checks the sources it cites.
Integrity signals
Registry
Cites
Statistics
Figures
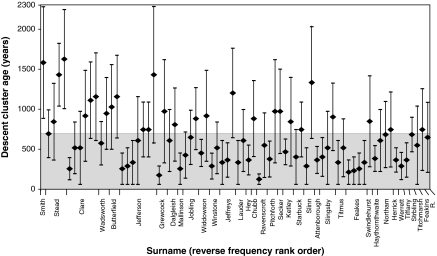
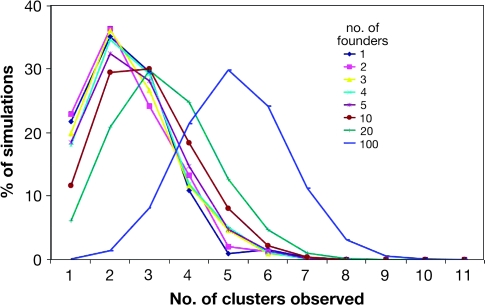
Verification
Claims the paper makes
The claims and statistics of this paper haven’t been checked yet.
Run the check — free, no account needed. It reads the open-access text and checks the sources it cites.
Claims other papers make about this one
Each is checked against this paper’s own text: does it say what the citing paper says it does?
In the citing paper
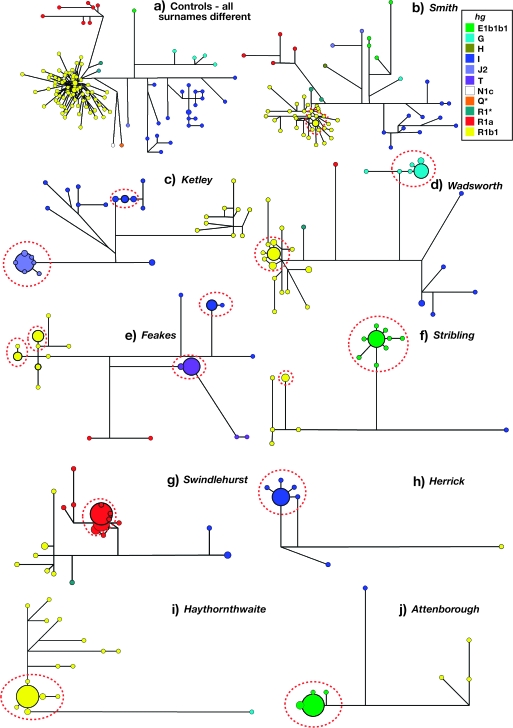
“Frequent haplotypes are expected to be accompanied by neighbouring haplotypes within the same Y-SNP haplogroup that arise from them via mutation, forming descent clusters (DCs6).”
From Y-chromosome descent clusters and male differential reproductive success: young lineage expansions dominate Asian pastoral nomadic populations (2015) · cites this paper as [6]
In the citing paper
“In its structure and haplotype diversity, it resembles the recent descent clusters observed within rare British surnames6”
From Y-chromosome descent clusters and male differential reproductive success: young lineage expansions dominate Asian pastoral nomadic populations (2015) · cites this paper as [6]
In the citing paper
“This is not the case for the English, who demonstrate much weaker signals of coancestry between Y-chromosomes and surnames, especially when the surname is very common70,71.”
From Cultural hitchhiking and competition between patrilineal kin groups explain the post-Neolithic Y-chromosome bottleneck (2018) · cites this paper as [71]
Self-check
Percentages, sums and reported differences re-computed from the paper’s own numbers.
The self-check needs the paper’s full text.
Citations
Cites
Median-joining networks for inferring intraspecific phylogenies
Bandelt, H. J., Forster, P., & Rohl, A. (1999) · Molecular Biology and Evolution · doi:10.1093/oxfordjournals.molbev.a026036 · Cited by 11,742
The Genetic Legacy of the Mongols
Zerjal, T., Xue, Y., Bertorelle, G., Wells, R. S., Bao, W., Zhu, S., Qamar, R., Ayub, Q., Mohyuddin, A., Fu, S., et al. (2003) · The American Journal of Human Genetics · doi:10.1086/367774 · Cited by 563
Jefferson fathered slave's last child
Foster, E. A., Jobling, M. A., Taylor, P. G., Donnelly, P., de Knijff, P., Mieremet, R., Zerjal, T., & Tyler-Smith, C. (1998) · Nature · doi:10.1038/23835 · Cited by 285 · cited 3×
“2, Supplementary Material online) from observing seven mutations among the haplotypes of living individuals from a set of deep-rooting pedigrees totaling 274 generations (Heyer et al. 1997; Foster et al. 1998; King, Parkin, et al. 2007).”
BackgroundSelf-citationBedoya, G., Montoya, P., García, J., Soto, I., Bourgeois, S., Carvajal, L., Labuda, D., Alvarez, V., Ospina, J., Hedrick, P. W., et al. (2006) · Proceedings of the National Academy of Sciences · doi:10.1073/pnas.0508716103 · Cited by 264
Y-chromosomal DNA variation in Pakistan
Qamar, R., Ayub, Q., Mohyuddin, A., Helgason, A., Mazhar, K., Mansoor, A., Zerjal, T., Tyler-Smith, C., & Mehdi, S. Q. (2002) · The American Journal of Human Genetics · doi:10.1086/339929 · Cited by 236
Research works printed but not linked: 25
- Adams, 2006, Forensic Science International, 159, 14, 10.1016/j.forsciint.2005.06.003 · DOI
- Bosch, 2006, Annals of human genetics, 70, 459, 10.1111/j.1469-1809.2005.00251.x · DOI
- Bosch, 2002, Forensic Science International, 125, 42, 10.1016/S0379-0738(01)00627-2 · DOI
- 2008, Molecular Biology and Evolution, 25, 301, 10.1093/molbev/msm255 · DOI
- Deutsch, 1991, Lancet, 338, 1151, 10.1016/0140-6736(91)92012-Q · DOI
- 2005, EVOL BIOINF ONLINE, 1, 47
- Forster, 1996, American journal of human genetics, 59, 935
- Garza-Chapa, 2000, American journal of human biology : the official journal of the Human Biology Council, 12, 721, 10.1002/1520-6300(200011/12)12:6<721::AID-AJHB1>3.0.CO;2-I · DOI
- Gusmao, 2005, Human mutation, 26, 520, 10.1002/humu.20254 · DOI
- Heyer, 1997, Human Molecular Genetics, 6, 799, 10.1093/hmg/6.5.799 · DOI
- Hurles, 2005, American journal of human genetics, 76, 894, 10.1086/430051 · DOI
- Jobling, 2001, Trends in genetics : TIG, 17, 353, 10.1016/S0168-9525(01)02284-3 · DOI
- Jobling, 2003, Nature reviews. Genetics, 4, 598, 10.1038/nrg1124 · DOI
- 2008, Genome Research, 18, 830, 10.1101/gr.7172008 · DOI · Paper page
- King, 2006, Current biology : CB, 16, 384, 10.1016/j.cub.2005.12.048 · DOI · Paper page
- King, 2007, American Journal of Physical Anthropology, 132, 584, 10.1002/ajpa.20557 · DOI
- King, 2007, European journal of human genetics : EJHG, 15, 288, 10.1038/sj.ejhg.5201771 · DOI
- McEvoy, 2006, Human genetics, 119, 212, 10.1007/s00439-005-0131-8 · DOI · Paper page
- McEvoy, 2008, American Journal of Physical Anthropology, 136, 415, 10.1002/ajpa.20823 · DOI
- McQuillan, 2008, American journal of human genetics, 83, 359, 10.1016/j.ajhg.2008.08.007 · DOI
- Moore, 2006, American journal of human genetics, 78, 334, 10.1086/500055 · DOI · Paper page
- Sasse, 1994, Human heredity, 44, 337, 10.1159/000154241 · DOI
- Sykes, 2000, American journal of human genetics, 66, 1417, 10.1086/302850 · DOI
- Xue, 2005, American journal of human genetics, 77, 1112, 10.1086/498583 · DOI · Paper page
- Zhivotovsky, 2004, American journal of human genetics, 74, 50, 10.1086/380911 · DOI
Cited by
Identifying Personal Genomes by Surname Inference
Gymrek, M., McGuire, A. L., Golan, D., Halperin, E., & Erlich, Y. (2013) · Science · doi:10.1126/science.1229566 · Cited by 1,228
Quantitative analysis of population-scale family trees with millions of relatives
Kaplanis, J., Gordon, A., Shor, T., Weissbrod, O., Geiger, D., Wahl, M., Gershovits, M., Markus, B., Sheikh, M., Gymrek, M., et al. (2018) · Science · doi:10.1126/science.aam9309 · Cited by 245
Zeng, T. C., Aw, A. J., & Feldman, M. W. (2018) · Nature Communications · doi:10.1038/s41467-018-04375-6 · Cited by 121
Balaresque, P., Poulet, N., Cussat-Blanc, S., Gerard, P., Quintana-Murci, L., Heyer, E., & Jobling, M. A. (2015) · European Journal of Human Genetics · doi:10.1038/ejhg.2014.285 · Cited by 89
Self-citation
Metadata
- Authors
- King, T. E., & Jobling, M. A.
- Venue
- Molecular Biology and Evolution
- Publisher
- Oxford University Press (OUP)
- Published
- 2009-02-09
- Volume
- 26
- Issue
- 5
- Pages
- 1093-1102
- ISSN
- 0737-4038
- 1537-1719
- PMC
- PMC2668828
- Cited by
- 117
- References
- 5
- Language
- en
About these checks
Registry, retraction, Cites and statistics results are computed, not judged, with one exception: a printed reference that no index lists is read once by a model before it counts as a citation error. Claims are extracted by a model and kept only when their quote appears verbatim in the text; each cited source is then checked, with a model’s help, for whether it says what the claim relies on. Those verdicts can be wrong — read the claim’s quote and the cited source before relying on one.
Statistics and arithmetic are recomputed, not judged.
Confidence bands are shown only for fields calibrated on our annotated test set. None is calibrated yet, so no band is shown.
What counts as a claim ›How we measure confidence ›How we check this ›
Are you an author, or do you see a problem with this page? Request a review
How to cite
Cite CoChat for the checks on this page, and the paper for its own findings.
- This page
- CoChat. (2026). Citation check: Founders, Drift, and Infidelity: The Relationship between Y Chromosome Diversity and Patrilineal Surnames. https://app.cochat.ai/papers/10.1093/molbev/msp022
- The paper
- King, T. E., & Jobling, M. A. (2009). Founders, Drift, and Infidelity: The Relationship between Y Chromosome Diversity and Patrilineal Surnames. Molecular Biology and Evolution. https://doi.org/10.1093/molbev/msp022
