

The DOI matches its Crossref record; 81 of the 82 references it cites were found in a registry or an index, and 1 are not checked yet; none of the 83 sources its claims cite is checked for support yet.
Cultural hitchhiking and competition between patrilineal kin groups explain the post-Neolithic Y-chromosome bottleneck
Open accessAbstract
In human populations, changes in genetic variation are driven not only by genetic processes, but can also arise from cultural or social changes. An abrupt population bottleneck specific to human males has been inferred across several Old World (Africa, Europe, Asia) populations 5000–7000 BP. Here, bringing together anthropological theory, recent population genomic studies and mathematical models, we propose a sociocultural hypothesis, involving the formation of patrilineal kin groups and intergroup competition among these groups. Our analysis shows that this sociocultural hypothesis can explain the inference of a population bottleneck. We also show that our hypothesis is consistent with current findings from the archaeogenetics of Old World Eurasia, and is important for conceptions of cultural and social evolution in prehistory.
Checked 2026-11-12 · 1 reference not checked yet
Overview
CoChat Summary
Written by AI from the paper’s full text.
TL;DR
The paper proposes that the post-Neolithic Y-chromosome bottleneck (5000–7000 BP) was caused by cultural hitchhiking between Y-chromosomes and patrilineal kin groups under intergroup competition, rather than by demographic collapse alone. Mathematical models and archaeogenetic comparisons support this sociocultural hypothesis.
Key findings
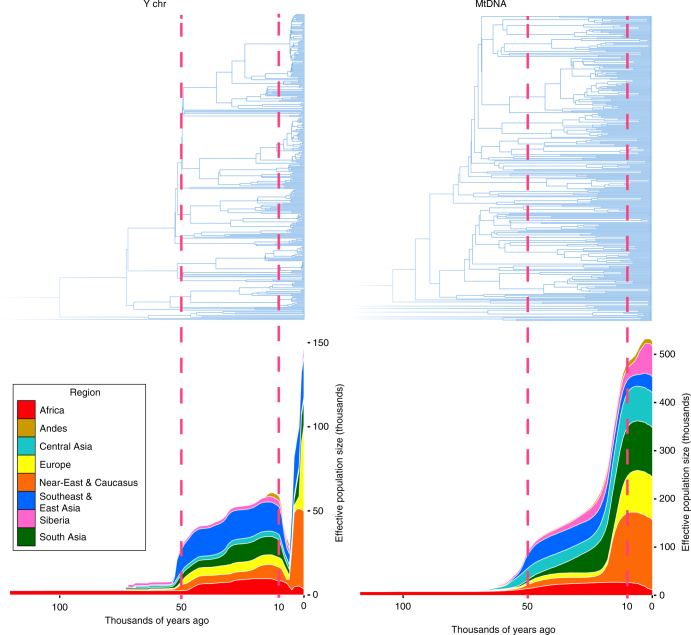
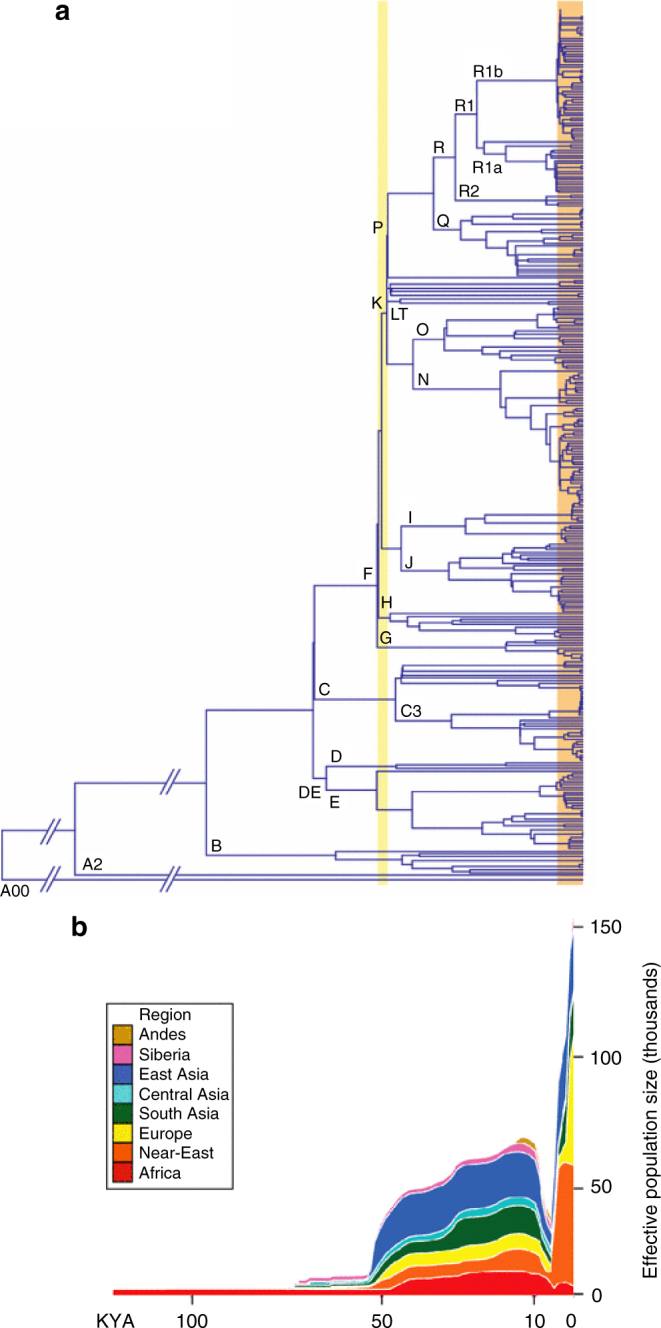
- Karmin et al. inferred a Y-chromosome bottleneck 5000–7000 BP across the Old World, with male effective population size declining to approximately one-twentieth of its pre-Neolithic level and a 1:17 male-to-female disparity, while mitochondrial DNA indicated a stable or increasing female population.
- The authors argue three alternatives fail: ecological/climatic sex-specific effects are too small; Neolithic founder effects are contradicted by larger Neolithic precursor populations and greater Y/mt diversity than hunter-gatherers; and intragroup inequality does not track bottleneck timing because the bottleneck lifts as social stratification rises.
- A modified Lotka–Volterra model shows that two competing male subpopulations sharing a female population drive one male subpopulation to extinction when interpopulation competition dominates intrapopulation competition, corresponding to extinction of a patrilineal descent group.
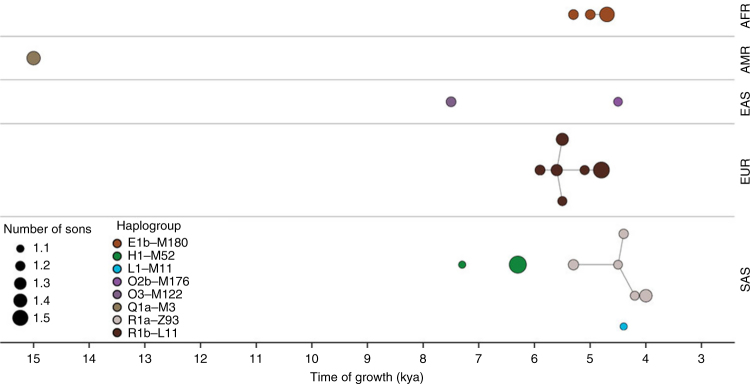
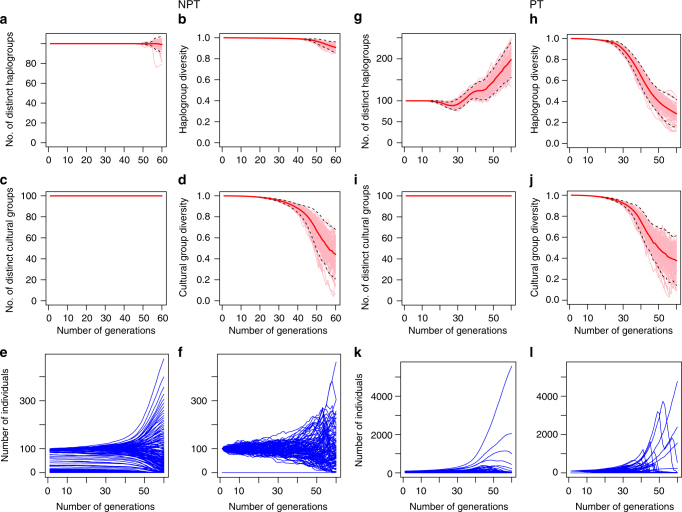
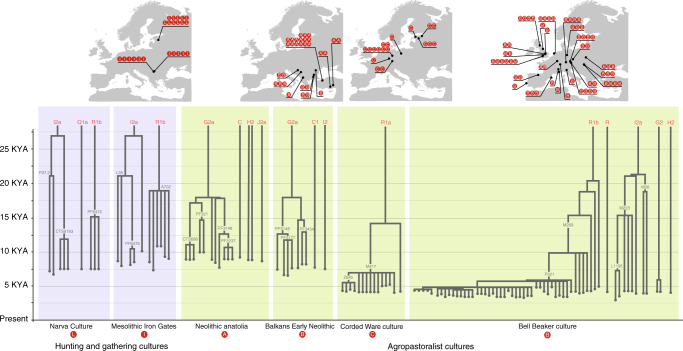
- In a computational grid model run for 60 generations (~1.5 millennia) across 18 parameter sets, patrilineal simulations consistently produced large haplogroup diversity losses and dominance by one or a few haplogroups, while non-patrilineal simulations showed few or no extinctions and roughly equal haplogroup representation; archaeogenetic support includes 81% of sampled Bell Beaker males sharing R1b-S116 and nearly all sampled Corded Ware males sharing R1a-M417.
Methods
- Analytical approach: a modified Lotka–Volterra competition model with two male subpopulations and an exogenous shared female population; the proof is in Supplementary Note 1.
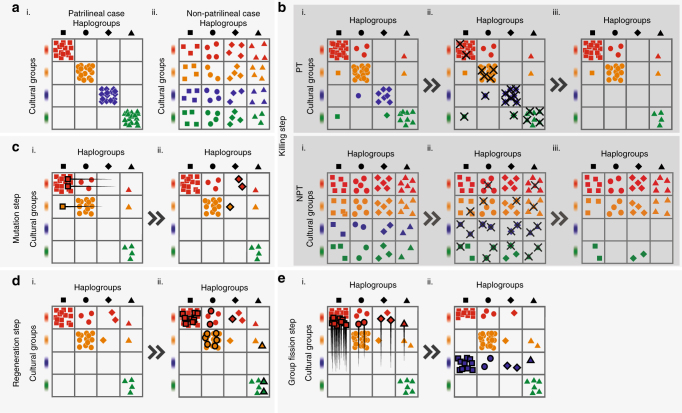
- Computational approach: a discrete-time grid model with cultural groups as rows and haplogroups as columns, including intergroup killing (Poisson-distributed, with smaller groups suffering higher proportional deaths), mutation, regeneration to constant total population size, group extinction below 20 individuals, and group fission; simulations ran 60 generations with 18 parameter combinations (total population 10,000/20,000/30,000; death rate 15%/25%/50%; patrilineal/non-patrilineal), plus model modifications.
- Evidence synthesis: the paper compares model outcomes with published Y-chromosome and mtDNA bottleneck findings and archaeogenetic phylogenies; no new primary genetic data were generated, and simulation code is available online.
Limitations
- Stated: the model’s mutation step changes haplogroup identity rather than real Y-chromosome haplotypes, uses a haplogroup mutation rate much lower than literature Y-haplotype rates, treats patrilineality exogenously, and does not include spatial structure.
- Stated: the archaeogenetic phylogeny in Fig. 6 is preliminary because most ancient samples were sequenced by hybridization capture, which may miss private mutations and alter inferred coalescence patterns.
- Evident: the hypothesis is supported by qualitative fit and robustness across simulations rather than a formal statistical test against genetic data, and the authors call for further archaeogenetic sampling and modelling to test it.
Model-written summary. Check it against the paper before relying on it.
Integrity signals
Registry
Cites
Statistics
Figures
Verification
Claims the paper makes
43 Own interpretation · 23 Not checked yet · 18 No full text of the sources · 14 Check pending · 11 Own result · 1 Sources not found · 1 Own method
A result the paper reports from its own data — it cites no other source for it, so there is none to check. The quote shows it is in the paper.
In the paper
“We prove that, in a Lotka–Volterra model with two male subpopulations and a subpopulation of females shared between both male subpopulations, competition between the male subpopulations drives one of the male subpopulations to extinction.”
§ Cultural hitchhiking and competition between patrilineal kin groups explain the post-Neolithic Y-chromosome bottleneck > Results > Patrilineal kin group competition explains bottleneck
boostedstates a cause- Asserted: passes — The authors put it forward as true.
- Checkable: passes — It can be checked against evidence.
- Load-bearing: passes — The paper’s conclusions depend on it.
- Based: passes — The paper gives a reason why it holds.
A result the paper reports from its own data — it cites no other source for it, so there is none to check. The quote shows it is in the paper.
In the paper
“These distinctions persist even after modifications to our model, such as the incorporation of cultural selection and fusion of cultural groups (see Supplementary Note 4 for details).”
§ Cultural hitchhiking and competition between patrilineal kin groups explain the post-Neolithic Y-chromosome bottleneck > Results > Patrilineal kin group competition explains bottleneck
plain- Asserted: passes — The authors put it forward as true.
- Checkable: passes — It can be checked against evidence.
- Load-bearing: passes — The paper’s conclusions depend on it.
- Based: passes — The paper gives a reason why it holds.
- Rests on 2 assumptions not shown here.
A result the paper reports from its own data — it cites no other source for it, so there is none to check. The quote shows it is in the paper.
In the paper
“First, simulations with patrilineality are characterized by large reductions in diversity, reproducing a bottleneck-like phenomenon in the Y-chromosome even in the absence of fluctuations in male population size across generations.”
§ Cultural hitchhiking and competition between patrilineal kin groups explain the post-Neolithic Y-chromosome bottleneck > Results > Patrilineal kin group competition explains bottleneck
plainstates a cause- Asserted: passes — The authors put it forward as true.
- Checkable: passes — It can be checked against evidence.
- Load-bearing: passes — The paper’s conclusions depend on it.
- Based: passes — The paper gives a reason why it holds.
- Rests on 2 assumptions not shown here.
In the paper
“The Bell Beaker culture has a high proportion of sampled males (81%) from a large geographical area (Iberia to Hungary) who belong to an identical Y-chromosomal haplogroup (R1b-S116)”
§ Cultural hitchhiking and competition between patrilineal kin groups explain the post-Neolithic Y-chromosome bottleneck > Discussion
What the sources say
- Not checked yetcites [64] Olalde, I. et al. The Beaker phenomenon and the genomic transformation of northwest Europe. Nature 555, 190–196 (2018). source
plain- Asserted: passes — The authors put it forward as true.
- Checkable: passes — It can be checked against evidence.
- Load-bearing: passes — The paper’s conclusions depend on it.
- Based: passes — The paper gives a reason why it holds.
A result the paper states — it cites no source for it, so there is none to check. The quote shows it is in the paper.
In the paper
“It turns out that under Eq. (1) with min(c12, c21) > max(c11, c22), almost always one population of males takes over the other.”
§ Cultural hitchhiking and competition between patrilineal kin groups explain the post-Neolithic Y-chromosome bottleneck > Methods > Modified Lotka–Volterra model
boostedstates a cause- Asserted: passes — The authors put it forward as true.
- Checkable: passes — It can be checked against evidence.
- Load-bearing: passes — The paper’s conclusions depend on it.
- Based: passes — The paper gives a reason why it holds.
- It may state two separate claims as one. 24
- Probably not a substantial claim. 20
Create a free account to see these claims.
Create a free account to see these assumptions.
65 more claims
Create a free account to see all 111 claims and to verify the 44 references still open.
Claims other papers make about this one
Each is checked against this paper’s own text: does it say what the citing paper says it does?
In the citing paper
“If the paternal lineage of Genghis Khan had belonged to R1b or Q lineages, these lineages would be expected to have a wide geographic distribution, corresponding to the territories of the Mongol Empire and its successor states, and to occur at high frequencies in modern populations of Mongol descent.”
From Genomes of the Golden Horde elites and their implications for the rulers of the Mongol Empire (2026) · cites this paper as [54]
In the citing paper
“This scenario is expected based on sociodemographic (53) and sociocultural (54) models, which predict increased Y-chromosome haplotype frequencies in patrilineal groups through elite dominance or other privileges that enable greater access to resources and expansion through lineal segmentary fission.”
From Genomes of the Golden Horde elites and their implications for the rulers of the Mongol Empire (2026) · cites this paper as [54]
In the citing paper
“However, it is questionable whether violence is necessary to explain the genetic signal observed by Karmin et al.1 as the level of violence worldwide at these times remains uncertain (Zeng et al.’s model assumes that 15% of males were killed at each generation9).”
From Patrilineal segmentary systems provide a peaceful explanation for the post-Neolithic Y-chromosome bottleneck (2024) · cites this paper as Zeng et al. [9]
In the citing paper
“(Zeng et al.’s model assumes that 15% of males were killed at each generation9).”
From Patrilineal segmentary systems provide a peaceful explanation for the post-Neolithic Y-chromosome bottleneck (2024) · cites this paper as Zeng et al. [9]
In the citing paper
“The first socio-cultural model proposed to explain the Y chromosome bottleneck involved violent competition between patrilineal kin groups and the killing of large numbers of men9.”
From Patrilineal segmentary systems provide a peaceful explanation for the post-Neolithic Y-chromosome bottleneck (2024) · cites this paper as Zeng et al. [9]
5 more claims about this paper
Create a free account to see every claim other papers make about this one.
Citations
Cites
Evolutionary Games and Population Dynamics
Hofbauer, J., & Sigmund, K. (1998) · doi:10.1017/cbo9781139173179 · Cited by 5,502
Ancient human genomes suggest three ancestral populations for present-day Europeans
Lazaridis, I., Patterson, N., Mittnik, A., Renaud, G., Mallick, S., Kirsanow, K., Sudmant, P. H., Schraiber, J. G., Castellano, S., Lipson, M., et al. (2014) · Nature · doi:10.1038/nature13673 · Cited by 1,357
The Coevolution of Parochial Altruism and War
Choi, J.-K., & Bowles, S. (2007) · Science · doi:10.1126/science.1144237 · Cited by 1,227
Life Histories, Blood Revenge, and Warfare in a Tribal Population
Chagnon, N. A. (1988) · Science · doi:10.1126/science.239.4843.985 · Cited by 1,159
Coevolution: Genes, Culture, and Human Diversity
Durham, W. H. (1991) · doi:10.1515/9781503621534 · Cited by 1,117
Cultural group selection, coevolutionary processes and large-scale cooperation
Henrich, J. (2004) · Journal of Economic Behavior & Organization · doi:10.1016/s0167-2681(03)00094-5 · Cited by 1,096 · cited 1×
“It is very plausible that in addition to competition in which size alone confers survival advantage — so-called selection for large groups (see Henrich, 2004) — differences in cultural innovations or toolkits act as a secondary mechanism of selection among these groups.”
BackgroundA farewell to alms: a brief economic history of the world
(2008) · Choice Reviews Online · doi:10.5860/choice.45-2713 · Cited by 1,088
Farmers and Their Languages: The First Expansions
Diamond, J., & Bellwood, P. (2003) · Science · doi:10.1126/science.1078208 · Cited by 1,054
Clark, G. (2007) · Princeton University Press eBooks · doi:10.1515/9781400827817 · Cited by 963
The Beaker phenomenon and the genomic transformation of northwest Europe
Olalde, I., Brace, S., Allentoft, M. E., Armit, I., Kristiansen, K., Booth, T., Rohland, N., Mallick, S., Szécsényi-Nagy, A., Mittnik, A., et al. (2018) · Nature · doi:10.1038/nature25738 · Cited by 765
Research works printed but not linked: 3
- Bellwood, P. S. & Renfrew, C. Examining the Farming/Language Dispersal Hypothesis (McDonald Institute for Archaeological Research, Cambridge, 2002).
- Kirch, P. V. The Evolution of the Polynesian Chiefdoms (Cambridge University Press, Cambridge, 1989).
- Kristiansen, K. in The World System and the Earth System: Global Socioenvironmental Change and Sustainability Since the Neolithic (ed. Hornborg, A.) 149–162 (Left Coast Press, Walnut Creek, CA, 2007).
Cited by
The Origins and Psychology of Human Cooperation
Henrich, J., & Muthukrishna, M. (2021) · Annual Review of Psychology · doi:10.1146/annurev-psych-081920-042106 · Cited by 457
Dynamic changes in genomic and social structures in third millennium BCE central Europe
Papac, L., Ernée, M., Dobeš, M., Langová, M., Rohrlach, A. B., Aron, F., Neumann, G. U., Spyrou, M. A., Rohland, N., Velemínský, P., et al. (2021) · Science Advances · doi:10.1126/sciadv.abi6941 · Cited by 173
The evolutionary anthropology of political leadership
Garfield, Z. H., Rueden, C. R. V., & Hagen, E. H. (2018) · The Leadership Quarterly · doi:10.1016/j.leaqua.2018.09.001 · Cited by 172
Genes reveal traces of common recent demographic history for most of the Uralic-speaking populations
Tambets, K., Yunusbayev, B., Hudjashov, G., IlumäE, A.-M., Rootsi, S., Honkola, T., Vesakoski, O., Atkinson, Q. D., Skoglund, P., Kushniarevich, A., et al. (2018) · Genome biology · doi:10.1186/s13059-018-1522-1 · Cited by 161
Megalithic tombs in western and northern Neolithic Europe were linked to a kindred society
Sánchez-Quinto, F., Malmström, H., Fraser, M., Girdland-Flink, L., Svensson, E. M., Simões, L. G., George, R., Hollfelder, N., Burenhult, G., Noble, G., et al. (2019) · Proceedings of the National Academy of Sciences · doi:10.1073/pnas.1818037116 · Cited by 138
Metadata
- Authors
- Zeng, T. C., Aw, A. J., & Feldman, M. W.
- Affiliations
- Stanford University (US)
- Corresponding author
- Feldman, Marcus W.
- Venue
- Nature Communications
- Published
- 2018-05-25
- Volume
- 9
- Issue
- 1
- Pages
- 2077-2077
- ISSN
- 2041-1723 (ISSN-L)
- PMC
- PMC5970157
- OpenAlex
- W2803342971
- Semantic Scholar
- 5bf90c0f141f9c51a91d7d062bbf013d8eaed85e
- Cited by
- 121
- References
- 80
- Citations by year
- 2026: 16 · 2025: 11 · 2024: 10 · 2023: 10 · 2022: 11 · 2021: 39 · 2020: 13 · 2019: 7 · 2018: 4
- FWCI
- 8.27
- Type
- journal article
- Language
- en
- Open access
- gold
- doi.org
- Locations
- Nature Communications (publishedVersion, cc-by)
- Europe PMC (PubMed Central) (publishedVersion, cc-by)
- PubMed (publishedVersion)
- PubMed Central (publishedVersion, cc-by)
- RePEc: Research Papers in Economics (submittedVersion)
- DOAJ (DOAJ: Directory of Open Access Journals) (submittedVersion, cc-by-sa)
- DOAJ (DOAJ: Directory of Open Access Journals) (submittedVersion)
- Funders
- National Science Foundation (1515127)
- Center for Computational, Evolutionary and Human Genomics, Stanford University
- Topics
- Life Sciences › Biochemistry, Genetics and Molecular Biology › Genetics › Forensic and Genetic Research
- Social Sciences › Cultural Studies › Language and cultural evolution
- Life Sciences › Biochemistry, Genetics and Molecular Biology › Genetics › Genetic diversity and population structure
- Keywords
- intergroup competition, archaeogenetics
- MeSH terms
- Africa, Asia, Computer Simulation, Cultural Characteristics, DNA, Mitochondrial, Europe, Haplotypes, Hierarchy, Social, Humans, Male, Models, Genetic, Population Dynamics, Genetic Variation, Chromosomes, Human, Y
About these checks
Registry, retraction, Cites and statistics results are computed, not judged, with one exception: a printed reference that no index lists is read once by a model before it counts as a citation error. Claims are extracted by a model and kept only when their quote appears verbatim in the text; each cited source is then checked, with a model’s help, for whether it says what the claim relies on. Those verdicts can be wrong — read the claim’s quote and the cited source before relying on one.
A language model drew the claims from the paper on 2026-11-12, under version 3 of the claim definition (model deepseek-v4.1-flash, prompt extract-v3).
A second model labelled each claim on 2026-11-12 (model jev-1.13-20260917, definition revision gold-guideline-v0.2).
Statistics and arithmetic are recomputed, not judged.
Confidence bands are shown only for fields calibrated on our annotated test set. None is calibrated yet, so no band is shown.
What counts as a claim ›How we measure confidence ›How we check this ›
Are you an author, or do you see a problem with this page? Request a review
How to cite
Cite CoChat for the checks on this page, and the paper for its own findings.
- This page
- CoChat. (2026). Citation check: Cultural hitchhiking and competition between patrilineal kin groups explain the post-Neolithic Y-chromosome bottleneck. https://app.cochat.ai/papers/10.1038/s41467-018-04375-6
- The paper
- Zeng, T. C., Aw, A. J., & Feldman, M. W. (2018). Cultural hitchhiking and competition between patrilineal kin groups explain the post-Neolithic Y-chromosome bottleneck. Nature Communications. https://doi.org/10.1038/s41467-018-04375-6
