

The DOI matches its Crossref record; 56 of the 56 references it cites were found in a registry or an index.
The atlas of RNase H antisense oligonucleotide distribution and activity in the CNS of rodents and non-human primates following central administration
Open accessPublished version of a preprint
Abstract
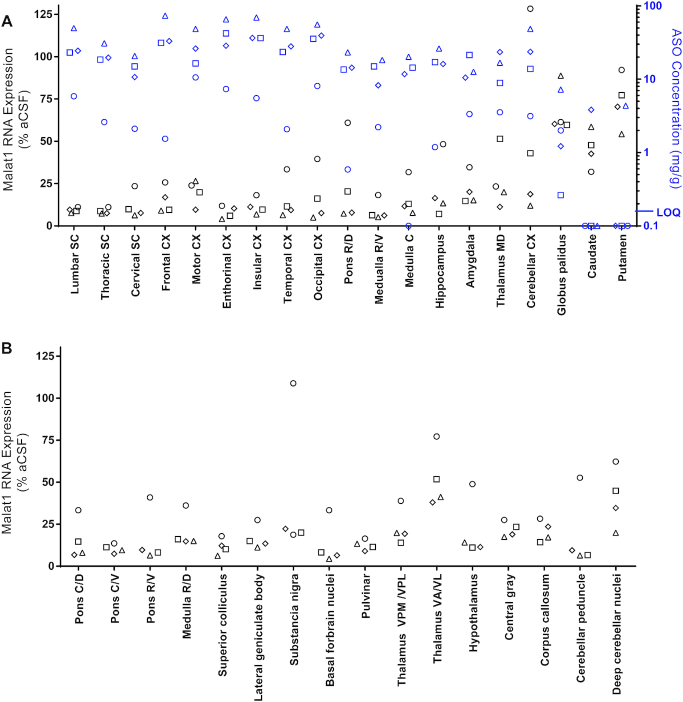
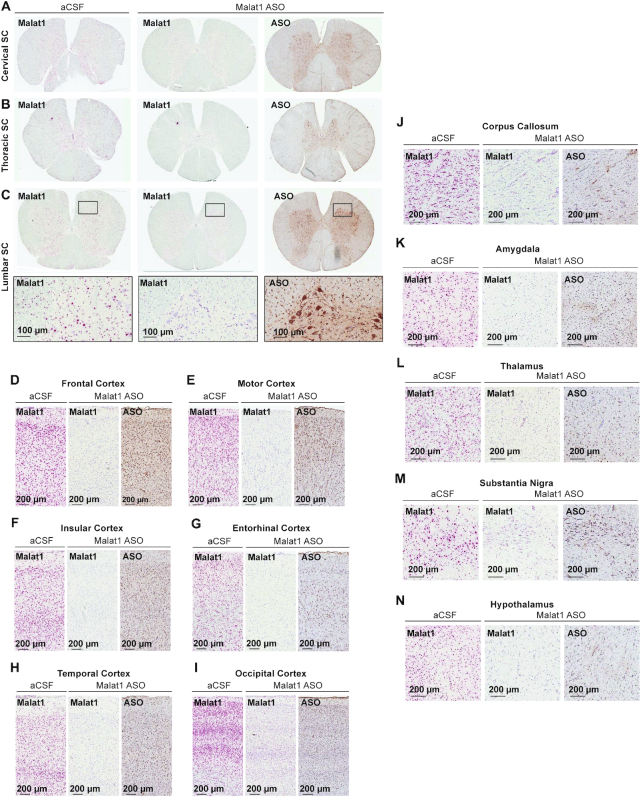
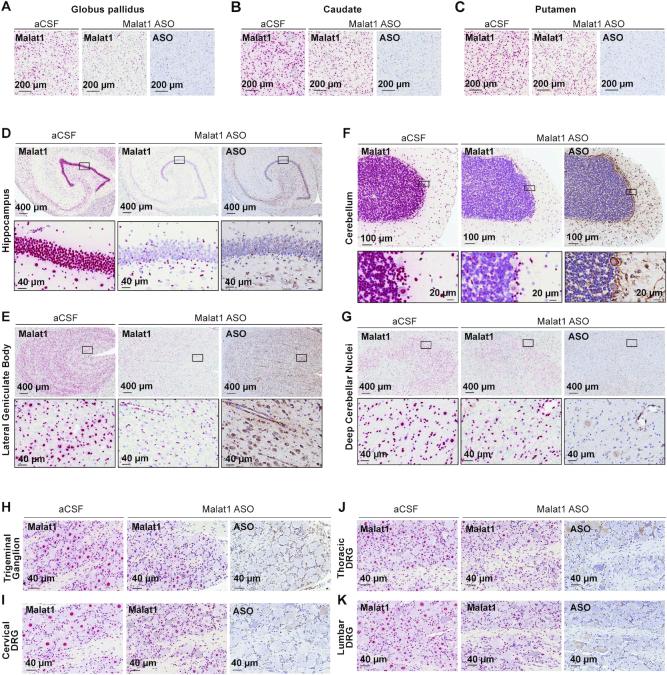
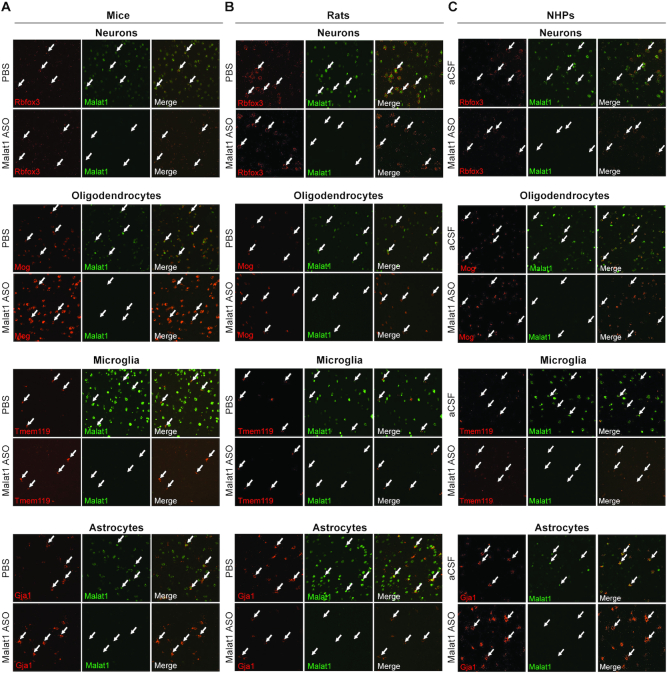
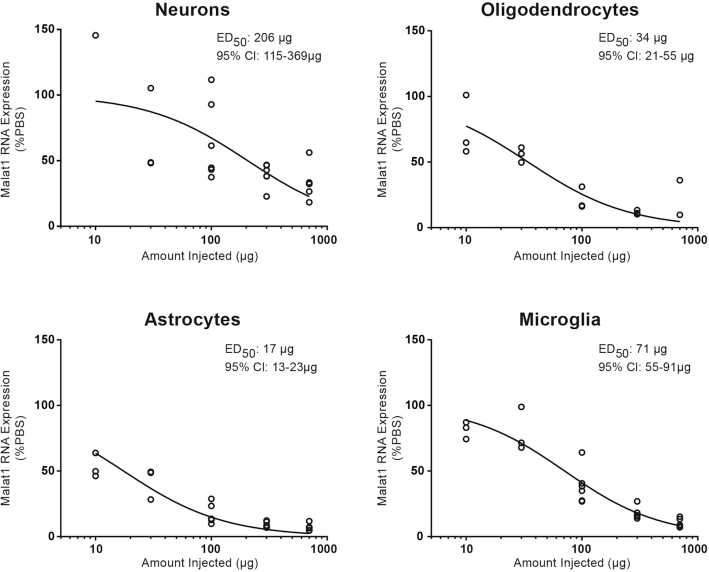
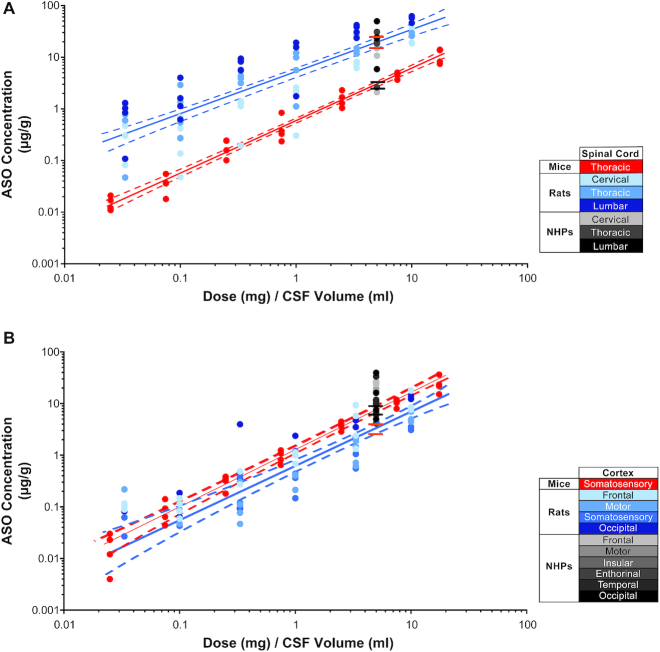
Antisense oligonucleotides (ASOs) have emerged as a new class of drugs to treat a wide range of diseases, including neurological indications. Spinraza, an ASO that modulates splicing of SMN2 RNA, has shown profound disease modifying effects in Spinal Muscular Atrophy (SMA) patients, energizing efforts to develop ASOs for other neurological diseases. While SMA specifically affects spinal motor neurons, other neurological diseases affect different central nervous system (CNS) regions, neuronal and non-neuronal cells. Therefore, it is important to characterize ASO distribution and activity in all major CNS structures and cell types to have a better understanding of which neurological diseases are amenable to ASO therapy. Here we present for the first time the atlas of ASO distribution and activity in the CNS of mice, rats, and non-human primates (NHP), species commonly used in preclinical therapeutic development. Following central administration of an ASO to rodents, we observe widespread distribution and target RNA reduction throughout the CNS in neurons, oligodendrocytes, astrocytes and microglia. This is also the case in NHP, despite a larger CNS volume and more complex neuroarchitecture. Our results demonstrate that ASO drugs are well suited for treating a wide range of neurological diseases for which no effective treatments are available.
Overview
The claims and statistics of this paper haven’t been checked yet.
Run the check — free, no account needed. It reads the open-access text and checks the sources it cites.
Integrity signals
Registry
Cites
Statistics
Figures
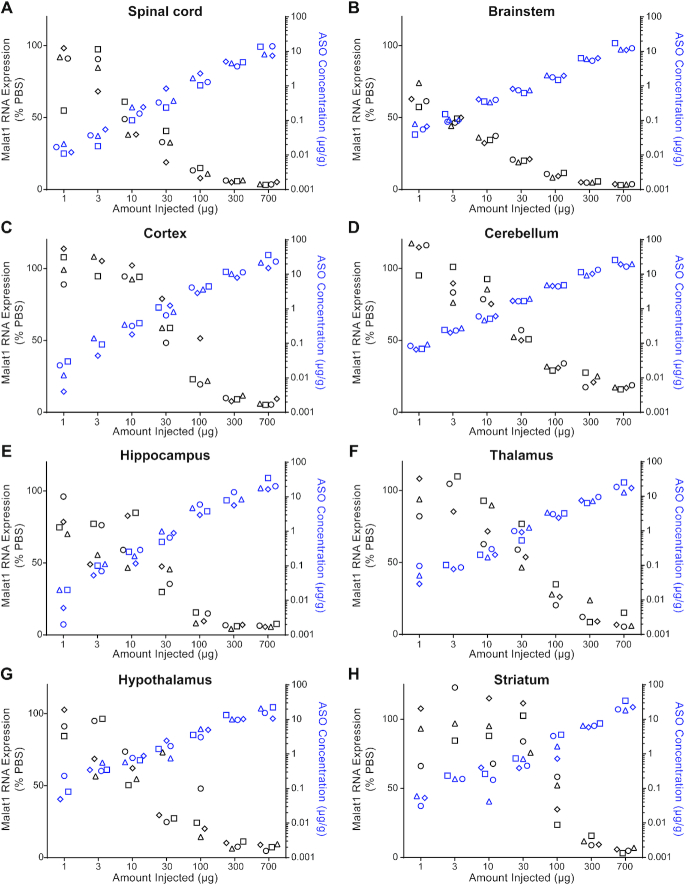
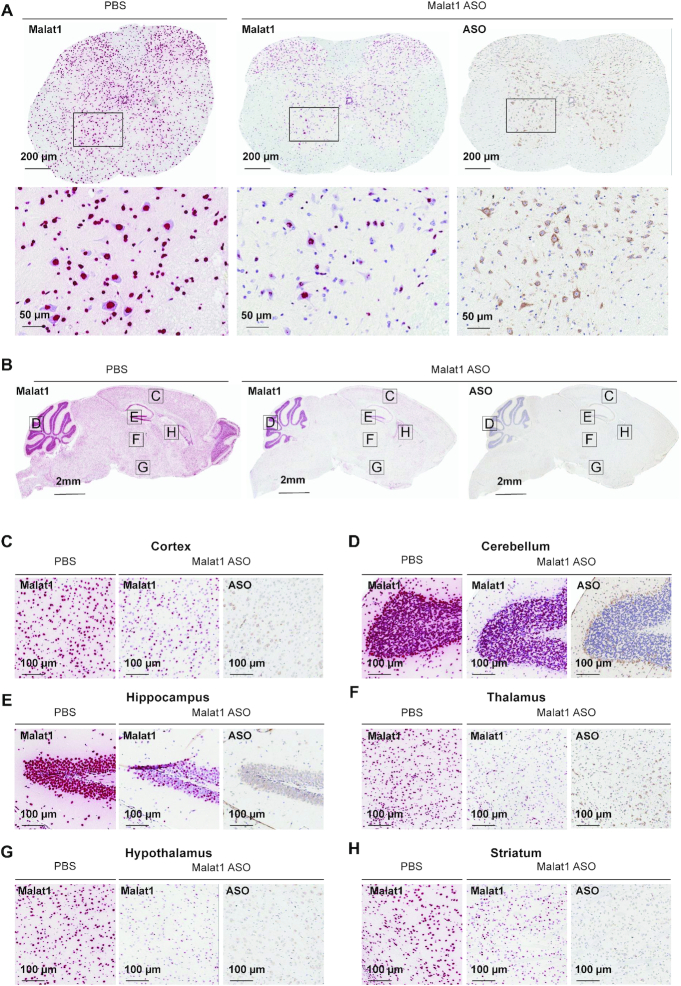
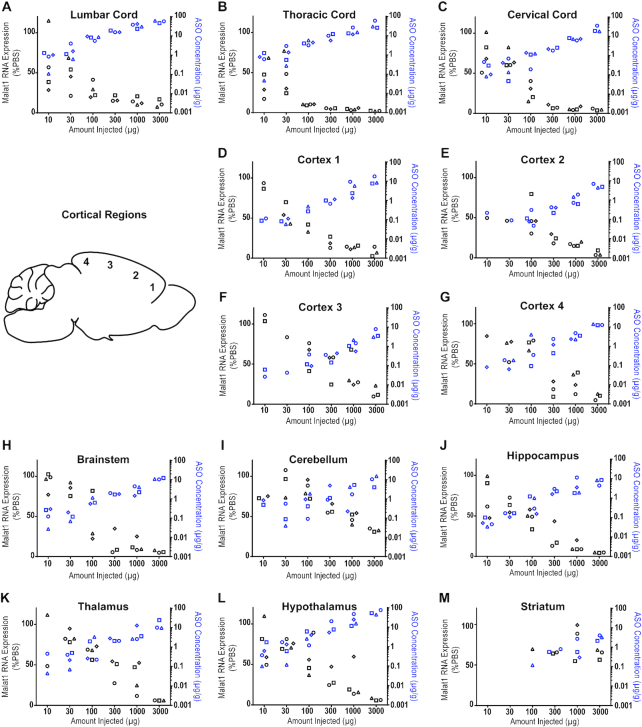
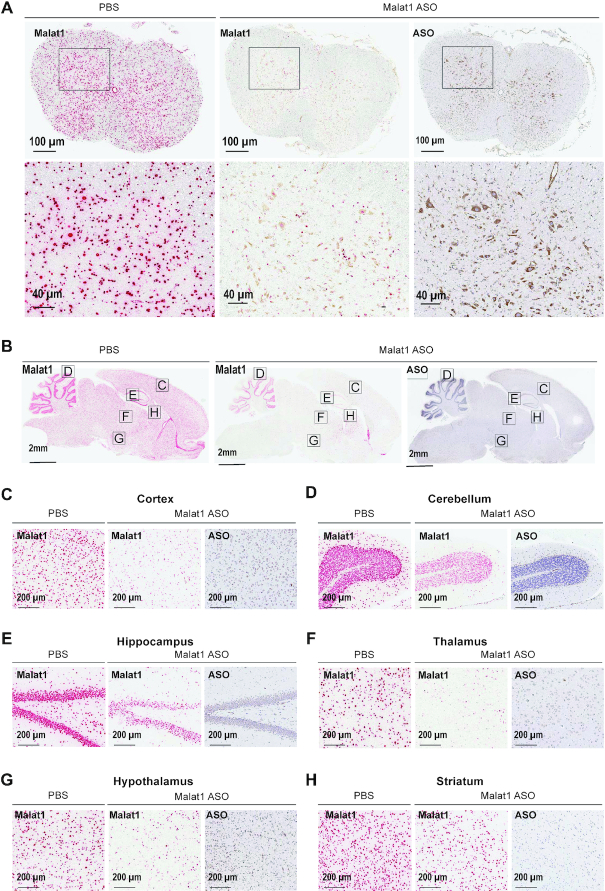
Verification
Claims the paper makes
The claims and statistics of this paper haven’t been checked yet.
Run the check — free, no account needed. It reads the open-access text and checks the sources it cites.
Claims other papers make about this one
Each is checked against this paper’s own text: does it say what the citing paper says it does?
The source backs part of the claim, not all of it — or backs it for a different population, condition or comparison.
In the citing paper
“numerous studies suggest that ASOs are not well suited for deep brain structure targets [16,47,52].”
From Elucidating brain transport pathways and cell type-dependent gene silencing of a durable lipid–siRNA conjugate administered into cerebrospinal fluid (2025) · cites this paper as [52]
Experimental — accuracy not yet measured
Self-check
Percentages, sums and reported differences re-computed from the paper’s own numbers.
The self-check needs the paper’s full text.
Citations
Cites
Alzheimer Disease: An Update on Pathobiology and Treatment Strategies
Long, J. M., & Holtzman, D. M. (2019) · Cell · doi:10.1016/j.cell.2019.09.001 · Cited by 3,204
Nusinersen versus Sham Control in Infantile-Onset Spinal Muscular Atrophy
Finkel, R. S., Mercuri, E., Darras, B. T., Connolly, A. M., Kuntz, N. L., Kirschner, J., Chiriboga, C. A., Saito, K., Servais, L., Tizzano, E., et al. (2017) · New England Journal of Medicine · doi:10.1056/nejmoa1702752 · Cited by 2,337
New tools for studying microglia in the mouse and human CNS
Bennett, M. L., Bennett, F. C., Liddelow, S. A., Ajami, B., Zamanian, J. L., Fernhoff, N. B., Mulinyawe, S. B., Bohlen, C. J., Adil, A., Tucker, A., et al. (2016) · Proceedings of the National Academy of Sciences · doi:10.1073/pnas.1525528113 · Cited by 1,804
Bennett, C. F., & Swayze, E. E. (2010) · The Annual Review of Pharmacology and Toxicology · doi:10.1146/annurev.pharmtox.010909.105654 · Cited by 1,431
Self-citationFrom charcot to lou gehrig: deciphering selective motor neuron death in als
Cleveland, D. W., & Rothstein, J. D. (2001) · Nature reviews. Neuroscience · doi:10.1038/35097565 · Cited by 1,389
Finkel, R. S., Chiriboga, C. A., Vajsar, J., Day, J., Montes, J., Vivo, D. C. D., Yamashita, M., Rigo, F., Hung, G., Schneider, E., et al. (2016) · The Lancet · doi:10.1016/s0140-6736(16)31408-8 · Cited by 1,039
Self-citationCrooke, S. T., Witztum, J. L., Bennett, C. F., & Baker, B. F. (2018) · Cell Metabolism · doi:10.1016/j.cmet.2018.03.004 · Cited by 841
Kordasiewicz, H. B., Stanek, L. M., Wancewicz, E. V., Mazur, C., McAlonis, M. M., Pytel, K. A., Artates, J. W., Weiss, A., Cheng, S. H., Shihabuddin, L. S., et al. (2012) · Neuron · doi:10.1016/j.neuron.2012.05.009 · Cited by 770
Self-citationTargeting Huntingtin Expression in Patients with Huntington’s Disease
Tabrizi, S. J., Leavitt, B. R., Landwehrmeyer, G. B., Wild, E. J., Saft, C., Barker, R. A., Blair, N. F., Craufurd, D., Priller, J., Rickards, H., et al. (2019) · New England Journal of Medicine · doi:10.1056/nejmoa1900907 · Cited by 708
Self-citationAntisense correction of SMN2 splicing in the CNS rescues necrosis in a type III SMA mouse modelPreprint
Hua, Y., Sahashi, K., Hung, G., Rigo, F., Passini, M. A., Bennett, C. F., & Krainer, A. R. (2010) · Genes & Development · doi:10.1101/gad.1941310 · Cited by 680
Self-citation
Cited by
Sorted by citations
Suppression of mutant C9orf72 expression by a potent mixed backbone antisense oligonucleotide
Tran, H., Moazami, M. P., Yang, H., McKenna-Yasek, D., Douthwright, C. L., Pinto, C., Metterville, J., Shin, M., Sanil, N., Dooley, C., et al. (2022) · Nature Medicine · doi:10.1038/s41591-021-01557-6 · Cited by 174
Barker, S. J., Thayer, M. B., Kim, C., Tatarakis, D., Simon, M. J., Dial, R., Nilewski, L., Wells, R. C., Zhou, Y., Afetian, M., et al. (2024) · Science Translational Medicine · doi:10.1126/scitranslmed.adi2245 · Cited by 142
Self-citationNucleic Acid Therapeutics: Successes, Milestones, and Upcoming Innovation
Belgrad, J., Fakih, H. H., & Khvorova, A. (2024) · Nucleic Acid Therapeutics · doi:10.1089/nat.2023.0068 · Cited by 130
Antisense drug discovery and development technology considered in a pharmacological context
Crooke, S. T., Liang, X., Crooke, R. M., Baker, B. F., & Geary, R. S. (2020) · Biochemical Pharmacology · doi:10.1016/j.bcp.2020.114196 · Cited by 109
Considerations in the Preclinical Assessment of the Safety of Antisense Oligonucleotides
Goyenvalle, A., Jimenez-Mallebrera, C., van Roon‐Mom, W., Sewing, S., Krieg, A. Μ., Arechavala‐Gomeza, V., & Andersson, P. U. (2022) · Nucleic Acid Therapeutics · doi:10.1089/nat.2022.0061 · Cited by 102
Metadata
- Authors
- Jafar-nejad, P., Powers, B., Soriano, A., Zhao, H., Norris, D. A., Matson, J., DeBrosse-Serra, B., Watson, J., Narayanan, P., Chun, S. J., Mazur, C., Kordasiewicz, H., Swayze, E. E., & Rigo, F.
- Affiliations
- Ionis Pharmaceuticals Inc. Carlsbad, CA 92010, USA
- Ionis Pharmaceuticals (United States) (US)
- Corresponding author
- Rigo, Frank
- ORCID
- Venue
- Nucleic Acids Research
- Publisher
- Oxford University Press (OUP)
- Published
- 2020-12-24
- Volume
- 49
- Issue
- 2
- Pages
- 657-673
- ISSN
- 0305-1048 (ISSN-L)
- 1362-4962
- PMC
- PMC7826274
- OpenAlex
- W3114205754
- Cited by
- 128
- References
- 56
- Citations by year
- 2026: 32 · 2025: 23 · 2024: 24 · 2023: 21 · 2022: 22 · 2021: 5 · 2020: 1
- FWCI
- 3.97
- Type
- journal article
- Language
- en
- Open access
- gold
- doi.org
- Licence
- Locations
- Nucleic Acids Research (publishedVersion, cc-by-nc)
- bioRxiv (Cold Spring Harbor Laboratory) (acceptedVersion)
- Europe PMC (PubMed Central) (publishedVersion, cc-by-nc)
- PubMed Central (publishedVersion, cc-by-nc)
- PubMed (publishedVersion)
- Topics
- Life Sciences › Biochemistry, Genetics and Molecular Biology › Molecular Biology › RNA Interference and Gene Delivery
- Health Sciences › Medicine › Genetics (clinical) › Neurogenetic and Muscular Disorders Research
- Life Sciences › Neuroscience › Neurology › Barrier Structure and Function Studies
- Keywords
- antisense oligonucleotides, RNase H, central nervous system distribution, spinal muscular atrophy, SMN2 splicing, oligodendrocytes, astrocytes, microglia, neurons, non-human primates, rodents, centralized management, neurological disease therapy
- MeSH terms
- Animals, Central Nervous System, Female, Injections, Intraventricular, Injections, Spinal, Macaca fascicularis, Male, Neuroglia, Neurons, Organ Specificity, Primates, Tissue Distribution, Oligonucleotides, Antisense, Ribonuclease H, Rats, Sprague-Dawley, In Situ Hybridization, Mice, Rats, RNA, Long Noncoding
About these checks
Registry, retraction, Cites and statistics results are computed, not judged, with one exception: a printed reference that no index lists is read once by a model before it counts as a citation error. Claims are extracted by a model and kept only when their quote appears verbatim in the text; each cited source is then checked, with a model’s help, for whether it says what the claim relies on. Those verdicts can be wrong — read the claim’s quote and the cited source before relying on one.
Statistics and arithmetic are recomputed, not judged.
Confidence bands are shown only for fields calibrated on our annotated test set. None is calibrated yet, so no band is shown.
What counts as a claim ›How we measure confidence ›How we check this ›
Are you an author, or do you see a problem with this page? Request a review
