

The DOI matches its Crossref record; 61 of the 61 references it cites were found in a registry or an index.
DAZAP2 acts as specifier of the p53 response to DNA damage
Abstract
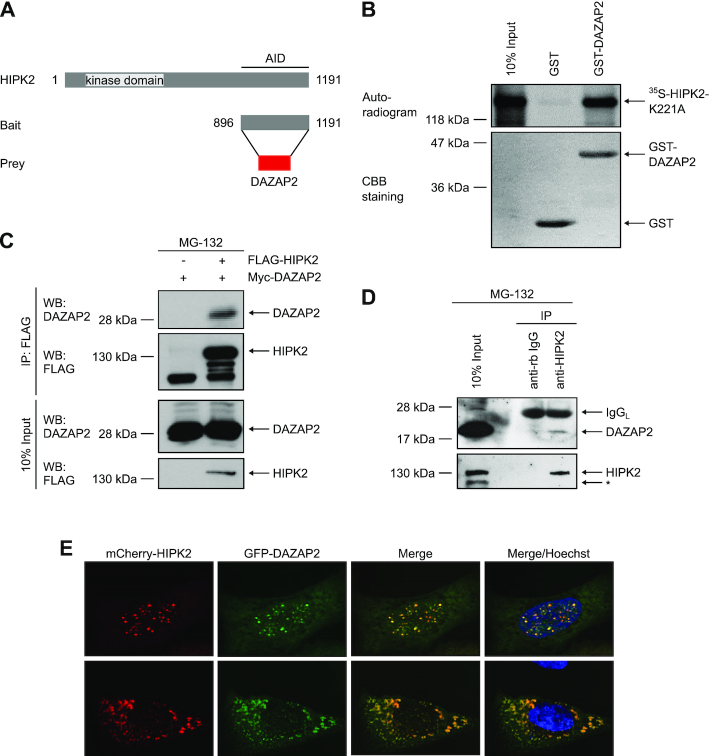
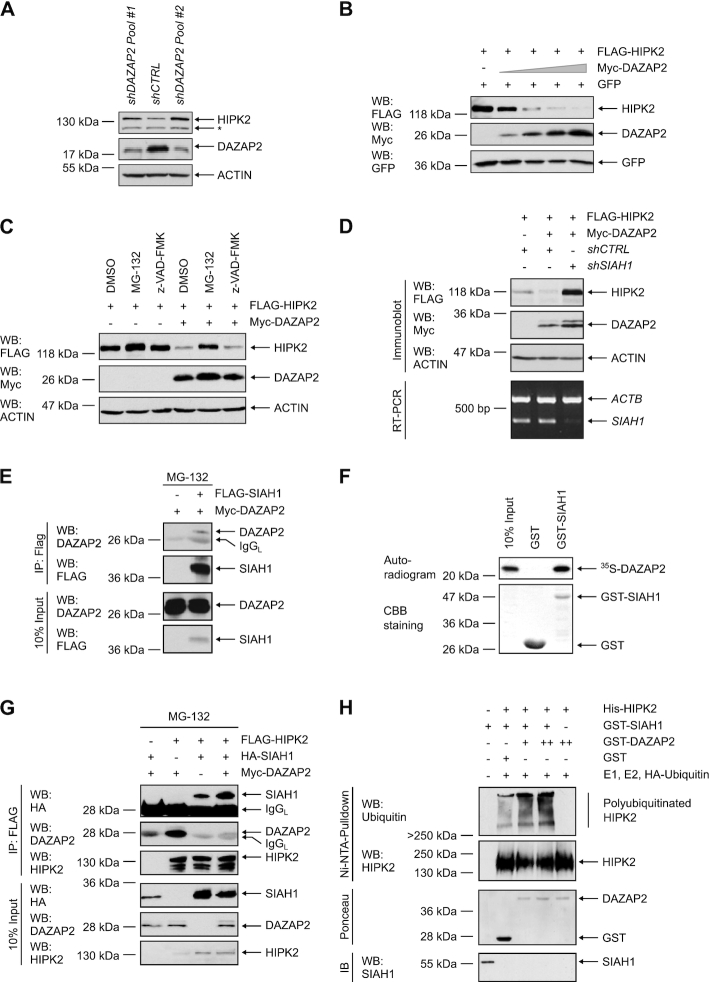
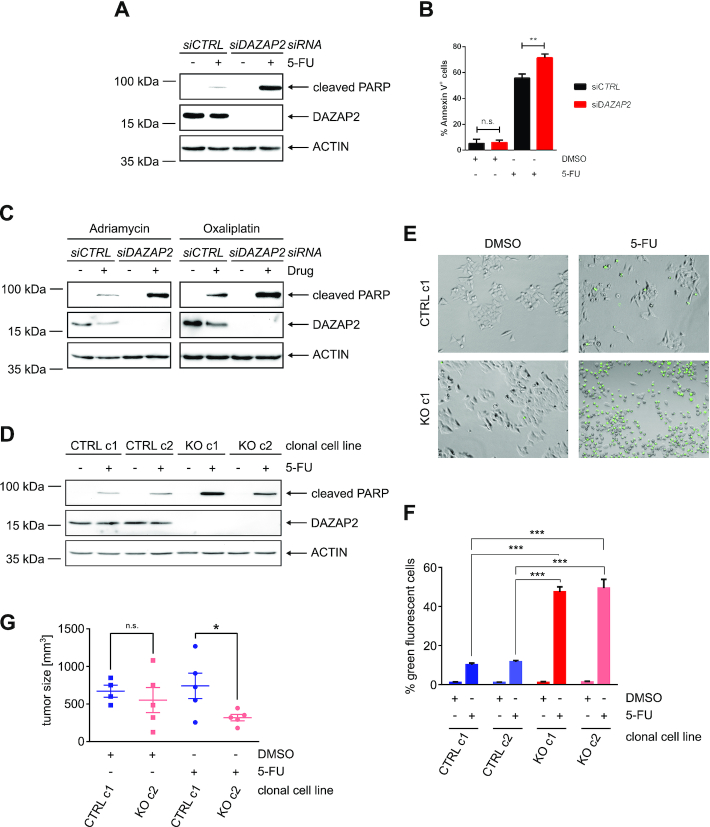
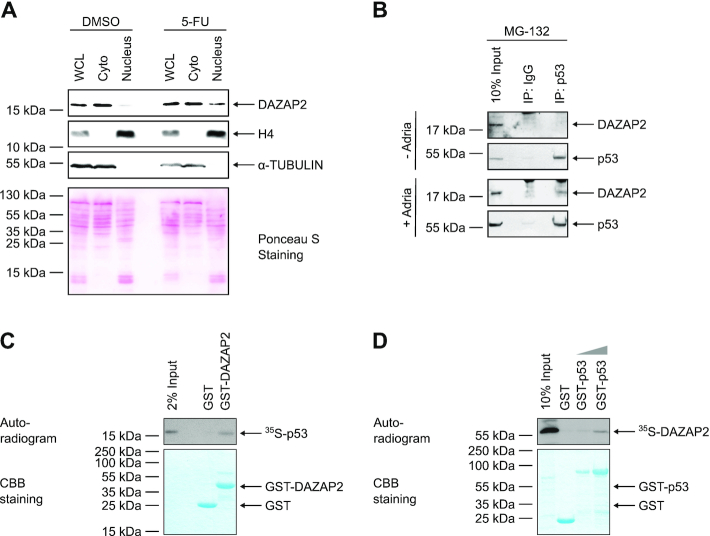
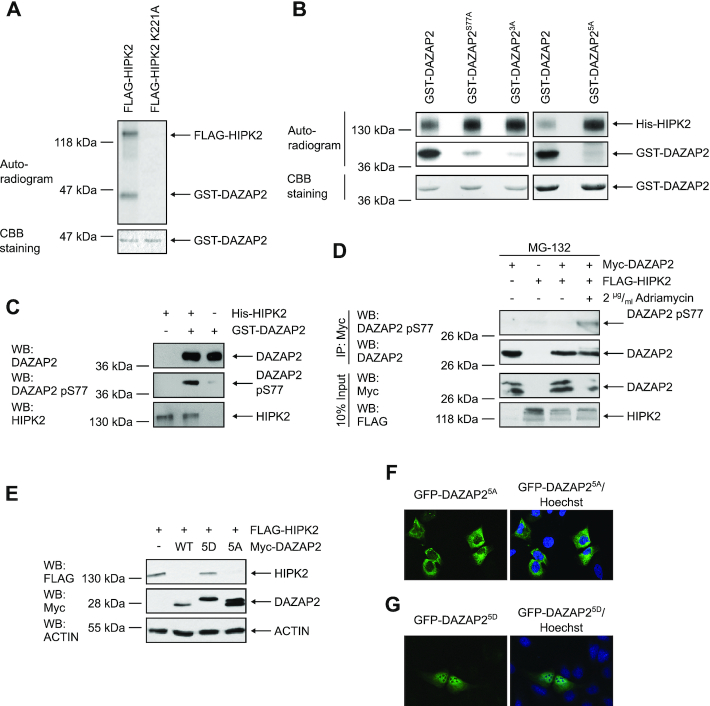
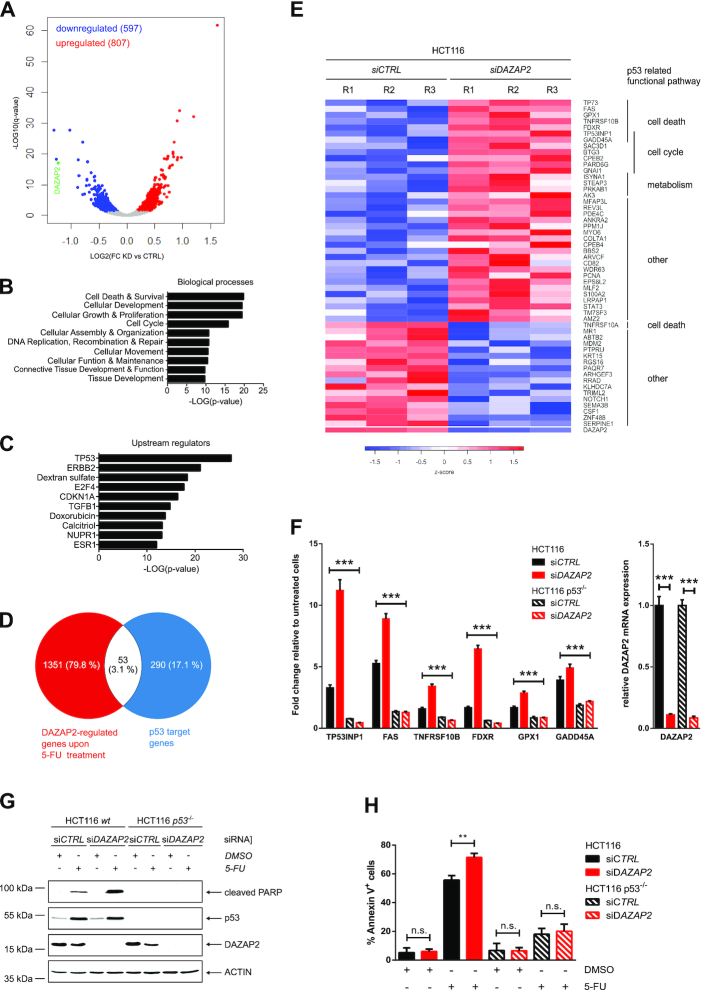
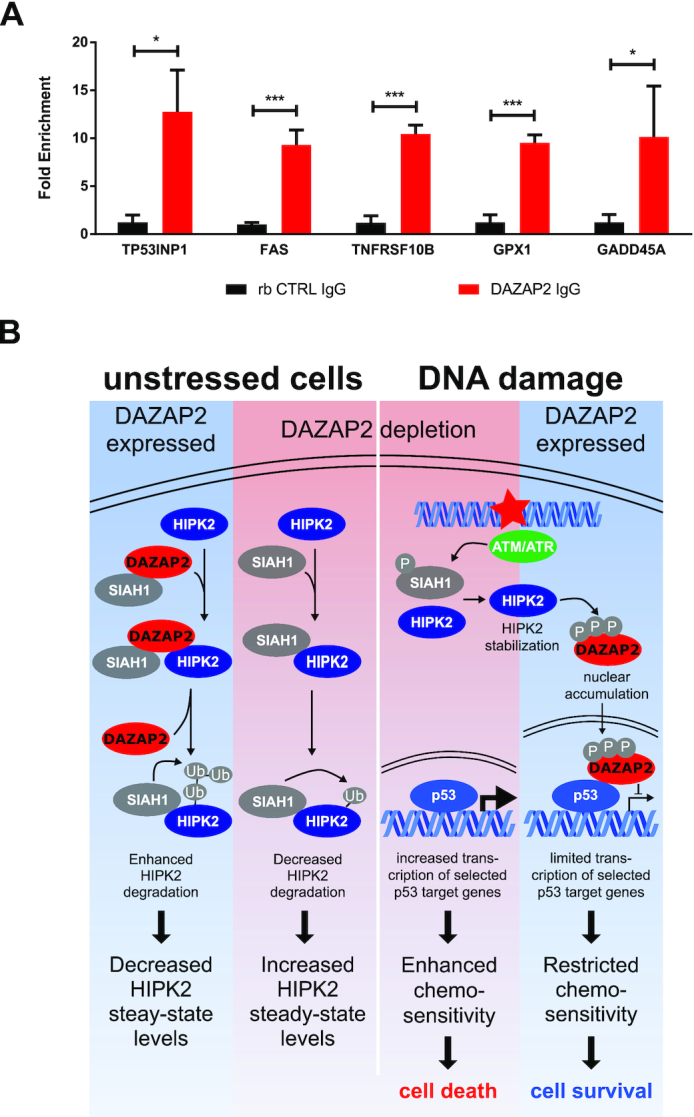
The DNA damage-responsive tumor suppressors p53 and HIPK2 are well established regulators of cell fate decision-making and regulate the cellular sensitivity to DNA-damaging drugs. Here, we identify Deleted in Azoospermia-associated protein 2 (DAZAP2), a small adaptor protein, as a novel regulator of HIPK2 and specifier of the DNA damage-induced p53 response. Knock-down or genetic deletion of DAZAP2 strongly potentiates cancer cell chemosensitivity both in cells and in vivo using a mouse tumour xenograft model. In unstressed cells, DAZAP2 stimulates HIPK2 polyubiquitination and degradation through interplay with the ubiquitin ligase SIAH1. Upon DNA damage, HIPK2 site-specifically phosphorylates DAZAP2, which terminates its HIPK2-degrading function and triggers its re-localization to the cell nucleus. Interestingly, nuclear DAZAP2 interacts with p53 and specifies target gene expression through modulating a defined subset of p53 target genes. Furthermore, our results suggest that DAZAP2 co-occupies p53 response elements to specify target gene expression. Collectively, our findings propose DAZAP2 as novel regulator of the DNA damage-induced p53 response that controls cancer cell chemosensitivity.
Overview
The claims and statistics of this paper haven’t been checked yet.
Run the check — free, no account needed. It reads the open-access text and checks the sources it cites.
Integrity signals
Registry
Cites
Statistics
Figures
Verification
Claims the paper makes
The claims and statistics of this paper haven’t been checked yet.
Run the check — free, no account needed. It reads the open-access text and checks the sources it cites.
Claims other papers make about this one
Each is checked against this paper’s own text: does it say what the citing paper says it does?
The cited source says what the claim attributes to it.
In the citing paper
“Four of the overlapping putative targets with the highest betweenness centrality play a role in protein translation [82, 83] (RPL3, EIF4A2), MAPK signaling (MAPK3) and p53 signaling [84] (DAZAP2) (Fig. 5E) (Supplementary Table 7).”
From microRNA-132 attenuates inflammation in induced pluripotent stem cell-derived microglia from Alzheimer’s disease patients (2026) · cites this paper as [84]
Self-check
Percentages, sums and reported differences re-computed from the paper’s own numbers.
The self-check needs the paper’s full text.
Citations
Cites
Moderated estimation of fold change and dispersion for RNA-seq data with DESeq2
Love, M. I., Huber, W., & Anders, S. (2014) · Genome Biology · doi:10.1186/s13059-014-0550-8 · Cited by 95,106
Kim, D., Pertea, G., Trapnell, C., Pimentel, H., Kelley, R., & Salzberg, S. L. (2013) · Genome Biology · doi:10.1186/gb-2013-14-4-r36 · Cited by 12,668
p53 Mutations in Human Cancers
Hollstein, M., Sidransky, D., Vogelstein, B., & Harris, C. C. (1991) · Science · doi:10.1126/science.1905840 · Cited by 8,018
The DNA-damage response in human biology and disease
Jackson, S. P., & Bartek, J. (2009) · Nature · doi:10.1038/nature08467 · Cited by 6,092
Differential analysis of gene regulation at transcript resolution with RNA-seq
Trapnell, C., Hendrickson, D. G., Sauvageau, M., Goff, L., Rinn, J. L., & Pachter, L. (2013) · Nature Biotechnology · doi:10.1038/nbt.2450 · Cited by 3,492
Blinded by the Light: The Growing Complexity of p53
Vousden, K. H., & Prives, C. (2009) · Cell · doi:10.1016/j.cell.2009.04.037 · Cited by 3,163
Genetic screens in human cells using the CRISPR-Cas9 system
Wang, T., Wei, J. J., Sabatini, D. M., & Lander, E. S. (2014) · Science · doi:10.1126/science.1246981 · Cited by 2,856
Cell-cycle checkpoints and cancer
Kastan, M. B., & Bartek, J. (2004) · Nature · doi:10.1038/nature03097 · Cited by 2,836
An Oncogene-Induced DNA Damage Model for Cancer Development
Halazonetis, T. D., Gorgoulis, V. G., & Bartek, J. (2008) · Science · doi:10.1126/science.1140735 · Cited by 1,851
Oda, K., Arakawa, H., Tanaka, T., Matsuda, K., Tanikawa, C., Mori, T., Nishimori, H., Tamai, K., Tokino, T., Nakamura, Y., et al. (2000) · Cell · doi:10.1016/s0092-8674(00)00073-8 · Cited by 1,172
Living on a break: cellular senescence as a DNA-damage response
d'Adda di Fagagna, F. (2008) · Nature Reviews Cancer · doi:10.1038/nrc2440 · Cited by 1,170
Post‐translational modifications and activation of p53 by genotoxic stresses
Appella, E., & Anderson, C. W. (2001) · European Journal of Biochemistry · doi:10.1046/j.1432-1327.2001.02225.x · Cited by 1,079
Decision making by p53: life, death and cancer
Oren, M. (2003) · Cell Death & Differentiation · doi:10.1038/sj.cdd.4401183 · Cited by 1,068
Census and evaluation of p53 target genes
Fischer, M. (2017) · Oncogene · doi:10.1038/onc.2016.502 · Cited by 971
p53 ubiquitination: Mdm2 and beyond
Brooks, C. L., & Gu, W. (2006) · Molecular Cell · doi:10.1016/j.molcel.2006.01.020 · Cited by 924
Méndez, J., & Stillman, B. (2000) · Molecular and Cellular Biology · doi:10.1128/mcb.20.22.8602-8612.2000 · Cited by 915
E-CRISP: fast CRISPR target site identification
Heigwer, F., Kerr, G., & Boutros, M. (2014) · Nature Methods · doi:10.1038/nmeth.2812 · Cited by 880
DNA damage checkpoints: from initiation to recovery or adaptation
Bartek, J., & Lukas, J. (2007) · Current Opinion in Cell Biology · doi:10.1016/j.ceb.2007.02.009 · Cited by 784
Homeodomain-interacting protein kinase-2 phosphorylates p53 at Ser 46 and mediates apoptosis
D'Orazi, G., Cecchinelli, B., Bruno, T., Manni, I., Higashimoto, Y., Saito, S., Gostissa, M., Coen, S., Marchetti, A., Del Sal, G., et al. (2002) · Nature Cell Biology · doi:10.1038/ncb714 · Cited by 681
Regulation of p53 activity by its interaction with homeodomain-interacting protein kinase-2
Hofmann, T. G., Möller, A., Sirma, H., Zentgraf, H., Taya, Y., Dröge, W., Will, H., & Schmitz, M. L. (2002) · Nature Cell Biology · doi:10.1038/ncb715 · Cited by 592
Self-citationApoptosis and genomic instability
Zhivotovsky, B., & Kroemer, G. (2004) · Nature Reviews Molecular Cell Biology · doi:10.1038/nrm1443 · Cited by 299
The multiple levels of regulation by p53 ubiquitination
Lee, J. T., & Gu, W. (2010) · Cell Death & Differentiation · doi:10.1038/cdd.2009.77 · Cited by 289
The DNA damage-induced cell death response: a roadmap to kill cancer cells
Matt, S., & Hofmann, T. G. (2016) · Cellular and Molecular Life Sciences · doi:10.1007/s00018-016-2130-4 · Cited by 288
Self-citationZhang, Q., Yoshimatsu, Y., Hildebrand, J. D., Frisch, S. M., & Goodman, R. H. (2003) · Cell · doi:10.1016/s0092-8674(03)00802-x · Cited by 221
Control of HIPK2 stability by ubiquitin ligase Siah-1 and checkpoint kinases ATM and ATR
Winter, M., Sombroek, D., Dauth, I., Moehlenbrink, J., Scheuermann, K., Crone, J., & Hofmann, T. G. (2008) · Nature Cell Biology · doi:10.1038/ncb1743 · Cited by 196
Self-citationRinaldo, C., Prodosmo, A., Mancini, F., Iacovelli, S., Sacchi, A., Moretti, F., & Soddu, S. (2007) · Molecular Cell · doi:10.1016/j.molcel.2007.02.008 · Cited by 175
Tumour predisposition and cancer syndromes as models to study gene–environment interactions
Carbone, M., Arron, S. T., Beutler, B., Bononi, A., Cavenee, W., Cleaver, J. E., Croce, C. M., D’Andrea, A., Foulkes, W. D., Gaudino, G., et al. (2020) · Nature Reviews Cancer · doi:10.1038/s41568-020-0265-y · Cited by 147
Hofmann, T. G., Stollberg, N., Schmitz, M. L., & Will, H. (2003) · PubMed · Cited by 140
Self-citationAn inducible autoregulatory loop between HIPK2 and Siah2 at the apex of the hypoxic response
Calzado, M. A., de la Vega, L., Möller, A., Bowtell, D. D. L., & Schmitz, M. L. (2008) · Nature Cell Biology · doi:10.1038/ncb1816 · Cited by 139
Tsui, S., Dai, T., Roettger, S., Schempp, W., SALIDO, E. C., & Yen, P. H. (2000) · Genomics · doi:10.1006/geno.2000.6169 · Cited by 135
Wei, G., Ku, S., Gene, K. A., Saito, S., Tang, A. A., Zhang, J., Mao, J., Appella, E., Balmain, A., & Huang, E. J. (2007) · Proceedings of the National Academy of Sciences · doi:10.1073/pnas.0703213104 · Cited by 132
p53 on the crossroad between regeneration and cancer
Charni‐Natan, M., Aloni-Grinstein, R., Molchadsky, A., & Rotter, V. (2016) · Cell Death and Differentiation · doi:10.1038/cdd.2016.117 · Cited by 116
Regulation of p53 - insights into a complex process
Boehme, K. A., & Blattner, C. (2009) · Critical Reviews in Biochemistry and Molecular Biology · doi:10.3109/10409230903401507 · Cited by 106
HIPK2: A tumour suppressor that controls DNA damage‐induced cell fate and cytokinesis
Hofmann, T. G., Glas, C., & Bitomsky, N. (2012) · BioEssays · doi:10.1002/bies.201200060 · Cited by 88
Self-citationCrosstalk between NRF2 and HIPK2 shapes cytoprotective responses
Torrente, L., Sanchez, C., Moreno, R., Chowdhry, S., Cabello, P., Isono, K., Koseki, H., Honda, T., Hayes, J. D., Dinkova‐Kostova, A. T., et al. (2017) · Oncogene · doi:10.1038/onc.2017.221 · Cited by 88
Updates on HIPK2: a resourceful oncosuppressor for clearing cancer
D’Orazi, G., Rinaldo, C., & Soddu, S. (2012) · Journal of Experimental & Clinical Cancer Research · doi:10.1186/1756-9966-31-63 · Cited by 86
HIPK2 restricts SIRT1 activity upon severe DNA damage by a phosphorylation-controlled mechanism
Conrad, E., Polonio-Vallon, T., Meister, M. T., Matt, S., Bitomsky, N., Herbel, C., Liebl, M. C., Greiner, V., Križnik, B., Schumacher, S. D., et al. (2015) · Cell Death and Differentiation · doi:10.1038/cdd.2015.75 · Cited by 80
Self-citationDauth, I., Krüger, J., & Hofmann, T. G. (2007) · Cancer Research · doi:10.1158/0008-5472.can-06-2884 · Cited by 79
Self-citationHow cells switch HIPK2 on and off
Sombroek, D., & Hofmann, T. G. (2008) · Cell Death and Differentiation · doi:10.1038/cdd.2008.154 · Cited by 79
Self-citationAutoregulatory control of the p53 response by caspase‐mediated processing of HIPK2
Gresko, E., Roscic, A., Ritterhoff, S., Vichalkovski, A., Sal, G. D., & Schmitz, M. L. (2006) · The EMBO Journal · doi:10.1038/sj.emboj.7601077 · Cited by 71
Cell Fate Regulation upon DNA Damage: p53 Serine 46 Kinases Pave the Cell Death Road
Liebl, M. C., & Hofmann, T. G. (2019) · BioEssays · doi:10.1002/bies.201900127 · Cited by 67
Self-citationSox6 regulation of cardiac myocyte development
Cohen‐Barak, O. (2003) · Nucleic Acids Research · doi:10.1093/nar/gkg807 · Cited by 64
Hofmann, T. G., Jaffray, E., Stollberg, N., Hay, R. T., & Will, H. (2005) · Journal of Biological Chemistry · doi:10.1074/jbc.m503921200 · Cited by 56
Self-citationHe, Y., Roos, W. P., Wu, Q., Hofmann, T. G., & Kaina, B. (2019) · Molecular Cancer Research · doi:10.1158/1541-7786.mcr-18-1306 · Cited by 54
Self-citationZyxin Is a Critical Regulator of the Apoptotic HIPK2-p53 Signaling Axis
Crone, J., Glas, C., Schultheiss, K., Moehlenbrink, J., Krieghoff‐Henning, E., & Hofmann, T. G. (2011) · Cancer Research · doi:10.1158/0008-5472.can-10-3486 · Cited by 53
Self-citationWinkel, A., Stricker, S., Tylżanowski, P., Seiffart, V., Mundlos, S., Groß, G., & Hoffmann, A. (2008) · Cellular Signalling · doi:10.1016/j.cellsig.2008.08.009 · Cited by 53
Autophosphorylation and Pin1 binding coordinate DNA damage-induced HIPK2 activation and cell death
Bitomsky, N., Conrad, E., Moritz, C., Polonio-Vallon, T., Sombroek, D., Schultheiss, K., Glas, C., Greiner, V., Herbel, C., Mantovani, F., et al. (2013) · Proceedings of the National Academy of Sciences · doi:10.1073/pnas.1310001110 · Cited by 50
Self-citationPosttranslational modifications regulate HIPK2, a driver of proliferative diseases
Saul, V. V., & Schmitz, M. L. (2013) · Journal of Molecular Medicine · doi:10.1007/s00109-013-1042-0 · Cited by 45
Src kinase modulates the apoptotic p53 pathway by altering HIPK2 localization
Polonio-Vallon, T., Kirckpatrick, J., Krijgsveld, J., & Hofmann, T. G. (2013) · Cell Cycle · doi:10.4161/cc.26857 · Cited by 37
Self-citationDazap2 modulates transcription driven by the Wnt effector TCF-4
Lukáš, J., Mazna, P., Valenta, T., Doubravská, L., Pospíchalová, V., Vojtěchová, M., Fafílek, B., Ivánek, R., Plachý, J., Novák, J., et al. (2009) · Nucleic Acids Research · doi:10.1093/nar/gkp179 · Cited by 34
Normal p53 Function in Primary Cells Deficient for Siah Genes
Frew, I. J., Dickins, R. A., Cuddihy, A. R., Rosario, M. D., Reinhard, C., O’Connell, M. J., & Bowtell, D. D. L. (2002) · Molecular and Cellular Biology · doi:10.1128/mcb.22.23.8155-8164.2002 · Cited by 34
Yang, L., Li, X., Qin, X., Wang, Q., Zhou, K., Li, H., Zhang, X., Wang, Q., & Li, W. (2019) · Journal of Biological Chemistry · doi:10.1074/jbc.ra119.009559 · Cited by 34
Zepp, J. A., Wu, L., Wen, Q., Ouyang, W., Aronica, M. A., ERZURUM, S. C., & Li, X. (2015) · The Journal of Immunology · doi:10.4049/jimmunol.1402647 · Cited by 33
Puca, R., Nardinocchi, L., & D’Orazi, G. (2008) · Journal of Experimental & Clinical Cancer Research · doi:10.1186/1756-9966-27-22 · Cited by 28
Proline-Rich Transcript in Brain Protein Induces Stress Granule Formation
Kim, J., Ryu, I., Kim, W. J., Song, O.-K., Ryu, J., Kwon, M. Y., Kim, J. H., & Jang, S. K. (2007) · Molecular and Cellular Biology · doi:10.1128/mcb.01226-07 · Cited by 27
Moehlenbrink, J., Bitomsky, N., & Hofmann, T. G. (2009) · Cancer Letters · doi:10.1016/j.canlet.2009.11.016 · Cited by 26
Self-citationYang, W., & Mansour, S. L. (1999) · Developmental Dynamics · Cited by 25
NKL homeobox gene NKX2-2 is aberrantly expressed in Hodgkin lymphoma
Nagel, S., MacLeod, R. A. F., Pommerenke, C., Meyer, C., Kaufmann, M., & Drexler, H. G. (2018) · Oncotarget · doi:10.18632/oncotarget.26459 · Cited by 17
Smurf2 regulates IL17RB by proteasomal degradation of its novel binding partner DAZAP2
Popova, A., Kzhyshkowska, J. G., Nurgazieva, D., Goerdt, S., & Gratchev, A. N. (2011) · Immunobiology · doi:10.1016/j.imbio.2011.10.004 · Cited by 15
Sung, K. S., Kim, S., Cho, S. W., Park, Y.-J., Tae, K., & Choi, C. Y. (2019) · PubMed · Cited by 9
Evolutionary Features and Intracellular Behavior of the PRTB Protein
Matsunami, M., Yoshioka, T., Minoura, T., Okano, Y., & Muto, Y. (2011) · Biochemical Genetics · doi:10.1007/s10528-011-9422-z · Cited by 3
Cited by
Penning, A., Snoeck, S., Ormaechea, O. R., Ayyildiz, D., Polzer, O., Buitrago-Arango, M., Capobianco, R., de Winter, F., Balusu, S., Verhaagen, J., et al. (2026) · Acta Neuropathologica Communications · doi:10.1186/s40478-026-02228-8 · Cited by 6
Metadata
- Authors
- Liebl, M. C., Moehlenbrink, J., Becker, H., Raddatz, G., Abdeen, S. K., Aqeilan, R. I., Lyko, F., & Hofmann, T. G.
- Affiliations
- Institute of Toxicology, University Medical Center Mainz, Johannes Gutenberg University, Mainz, Germany
- Division of Epigenetics, German Cancer Research Center (dkfz), Heidelberg, Germany
- The Concern Foundation Laboratories, The Lautenberg Center for Immunology and Cancer Research, Department of Immunology and Cancer Research-IMRIC, Hebrew University-Hadassah Medical School, Jerusalem, Israel
- Venue
- Nucleic Acids Research
- Publisher
- Oxford University Press (OUP)
- Published
- 2021-02-16
- Volume
- 49
- Issue
- 5
- Pages
- 2759-2776
- ISSN
- 0305-1048
- 1362-4962
- PMC
- PMC7969023
- Cited by
- 20
- References
- 61
- Language
- en
- Funders
- Deutsche Forschungsgemeinschaft (SFB 1036, SFB 1361)
About these checks
Registry, retraction, Cites and statistics results are computed, not judged, with one exception: a printed reference that no index lists is read once by a model before it counts as a citation error. Claims are extracted by a model and kept only when their quote appears verbatim in the text; each cited source is then checked, with a model’s help, for whether it says what the claim relies on. Those verdicts can be wrong — read the claim’s quote and the cited source before relying on one.
Statistics and arithmetic are recomputed, not judged.
Confidence bands are shown only for fields calibrated on our annotated test set. None is calibrated yet, so no band is shown.
What counts as a claim ›How we measure confidence ›How we check this ›
Are you an author, or do you see a problem with this page? Request a review
Data sources
Bibliographic data: Semantic Scholar, OpenAlex, Crossref.
Contains information from the Semantic Scholar Academic Graph Datasets, made available under the ODC Attribution License (ODC-BY 1.0).
Semantic Scholar’s data is described in: Kinney, R., et al. (2023). The Semantic Scholar Open Data Platform. arXiv:2301.10140.
