

Gene knockout inference with variational graph autoencoder learning single-cell gene regulatory networks
Open accessThe DOI matches its Crossref record; 70 of the 70 references it cites were found in a registry or an index.
Abstract
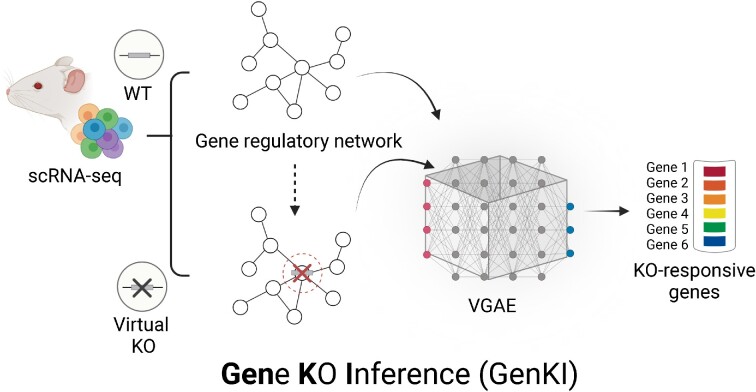
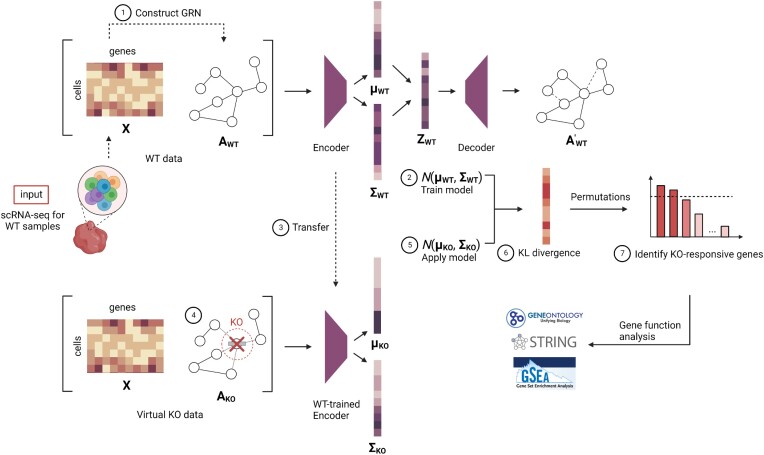
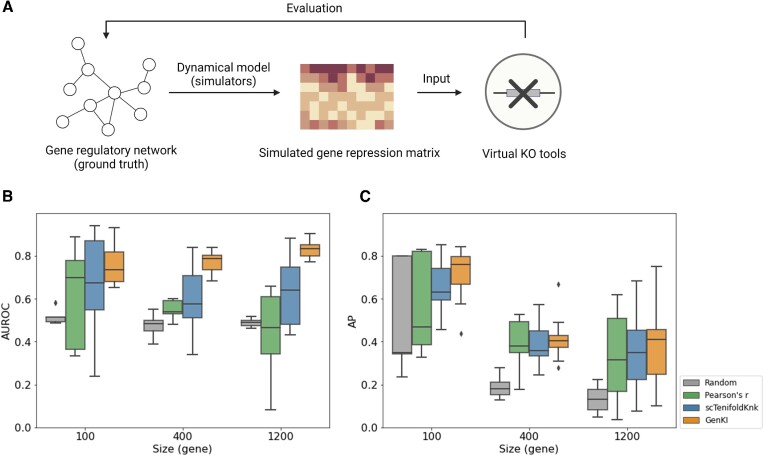
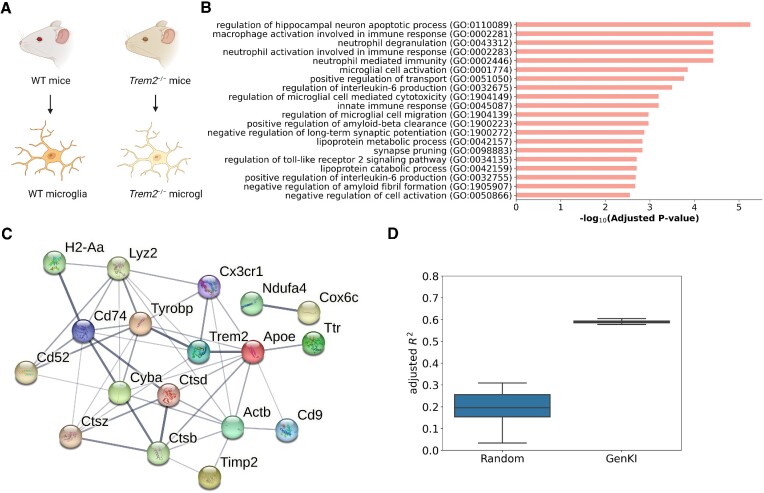
In this paper, we introduce Gene Knockout Inference (GenKI), a virtual knockout (KO) tool for gene function prediction using single-cell RNA sequencing (scRNA-seq) data in the absence of KO samples when only wild-type (WT) samples are available. Without using any information from real KO samples, GenKI is designed to capture shifting patterns in gene regulation caused by the KO perturbation in an unsupervised manner and provide a robust and scalable framework for gene function studies. To achieve this goal, GenKI adapts a variational graph autoencoder (VGAE) model to learn latent representations of genes and interactions between genes from the input WT scRNA-seq data and a derived single-cell gene regulatory network (scGRN). The virtual KO data is then generated by computationally removing all edges of the KO gene—the gene to be knocked out for functional study—from the scGRN. The differences between WT and virtual KO data are discerned by using their corresponding latent parameters derived from the trained VGAE model. Our simulations show that GenKI accurately approximates the perturbation profiles upon gene KO and outperforms the state-of-the-art under a series of evaluation conditions. Using publicly available scRNA-seq data sets, we demonstrate that GenKI recapitulates discoveries of real-animal KO experiments and accurately predicts cell type-specific functions of KO genes. Thus, GenKI provides an in-silico alternative to KO experiments that may partially replace the need for genetically modified animals or other genetically perturbed systems.
Overview
The claims and statistics of this paper haven’t been checked yet.
Free: it reads the open-access text and checks the first 5 claims that cite a source we can check. Create a free account to check every claim.
Integrity signals
Registry
Cites
Statistics
Figures
Verification
Claims the paper makes
The claims and statistics of this paper haven’t been checked yet.
Free: it reads the open-access text and checks the first 5 claims that cite a source we can check. Create a free account to check every claim.
Claims other papers make about this one
Each is checked against this paper’s own text: does it say what the citing paper says it does?
The cited source says what the claim attributes to it.
In the citing paper
“Then, the enriched functions of these perturbed genes (KO-responsive genes) are analysed to predict the functions of the KO gene, leveraging similarities in affected pathways or biological processes.”
From A mini-review on perturbation modelling across single-cell omic modalities (2024) · cites this paper as [51]
Self-check
Percentages, sums and reported differences re-computed from the paper’s own numbers.
The self-check needs the paper’s full text.
Citations
Cites
Controlling the False Discovery Rate: A Practical and Powerful Approach to Multiple Testing
Benjamini, Y., & Hochberg, Y. (1995) · Journal of the Royal Statistical Society Series B: Statistical Methodology · doi:10.1111/j.2517-6161.1995.tb02031.x · Cited by 109,482
Adam: A Method for Stochastic Optimization
Kingma, D. P., & Ba, J. (2014) · arXiv · doi:10.48550/arxiv.1412.6980 · Cited by 98,946
Differential expression analysis for sequence count data
Anders, S., & Huber, W. (2010) · Genome Biology · doi:10.1186/gb-2010-11-10-r106 · Cited by 15,581
Integrated analysis of multimodal single-cell data
Hao, Y., Hao, S., Andersen-Nissen, E., Mauck, W. M., Zheng, S., Butler, A., Lee, M. J., Wilk, A. J., Darby, C., Zagar, M., et al. (2020) · doi:10.1101/2020.10.12.335331 · Cited by 15,508
Enrichr: a comprehensive gene set enrichment analysis web server 2016 update
Kuleshov, M. V., Jones, M. R., Rouillard, A. D., Fernandez, N. F., Duan, Q., Wang, Z., Koplev, S., Jenkins, S. L., Jagodnik, K. M., Lachmann, A., et al. (2016) · Nucleic Acids Research · doi:10.1093/nar/gkw377 · Cited by 10,799
Principal component analysis: A review and recent developments
Jolliffe, I. T., & Cadima, J. (2016) · Philosophical Transactions of the Royal Society A: Mathematical, Physical and Engineering Sciences · doi:10.1098/rsta.2015.0202 · Cited by 10,117
SCANPY: large-scale single-cell gene expression data analysis
Wolf, F. A., Angerer, P., & Theis, F. J. (2018) · Genome Biology · doi:10.1186/s13059-017-1382-0 · Cited by 8,881 · cited 1×
“DE analysis was performed using Scanpy ( 26 )(v.1.9.1) function r ank g enes gr oups with the Wilco x on rank-sum test.”
InfluentialUniProt: the Universal Protein Knowledgebase in 2023
The UniProt Consortium, Bateman, A., Martin, M.-J., Orchard, S., Magrane, M., Ahmad, S., Alpi, E., Bowler-Barnett, E. H., Britto, R., Bye-A-Jee, H., et al. (2023) · Nucleic Acids Research · doi:10.1093/nar/gkac1052 · Cited by 7,210
(2017) · International Conference on Learning Representations · Cited by 3,248
Molecular Architecture of the Mouse Nervous System
Zeisel, A., Hochgerner, H., Lönnerberg, P., Johnsson, A., Memic, F., van der Zwan, J., Häring, M., Braun, E., Borm, L. E., La Manno, G., et al. (2018) · Cell · doi:10.1016/j.cell.2018.06.021 · Cited by 2,552
Research works printed but not linked: 1
- Glorot, 2010, Proceedings of the thirteenth international conference on artificial intelligence and statistics, 249
Cited by
Benchmarking clustering, alignment, and integration methods for spatial transcriptomics
Hu, Y., Li, Y., Xie, M., Rao, M., Shen, W., Luo, C., Qin, H., Baek, J., & Zhou, X. (2024) · Genome biology · doi:10.1186/s13059-024-03361-0 · Cited by 122
A mini-review on perturbation modelling across single-cell omic modalities
Gavriilidis, G. I., Vasileiou, V., Orfanou, A., Ishaque, N., & Psomopoulos, F. (2024) · Computational and Structural Biotechnology Journal · doi:10.1016/j.csbj.2024.04.058 · Cited by 54
Zinati, Y., Takiddeen, A., & Emad, A. (2024) · Nature Communications · doi:10.1038/s41467-024-48516-6 · Cited by 56
Graph neural networks for single-cell omics data: a review of approaches and applications
Li, S., Hua, H., & Chen, S. (2025) · Briefings in Bioinformatics · doi:10.1093/bib/bbaf109 · Cited by 43
Zinati, Y., Takiddeen, A., & Emad, A. (2023) · doi:10.1101/2023.07.25.550225 · Cited by 36
Metadata
- Authors
- Yang, Y., Li, G., Zhong, Y., Xu, Q., Chen, B.-J., Lin, Y.-T., Chapkin, R. S., & Cai, J. J.
- Affiliations
- Texas A&M University (US)
- East China Normal University (CN)
- National Chung Hsing University (TW)
- National Taiwan University (TW)
- Corresponding author
- Yang, Yongjian
- Venue
- Nucleic Acids Research
- Publisher
- Oxford University Press (OUP)
- Published
- 2023-05-29
- Volume
- 51
- Issue
- 13
- Pages
- 6578-6592
- ISSN
- 0305-1048 (ISSN-L)
- 1362-4962
- PMC
- PMC10359630
- OpenAlex
- W4378640029
- Cited by
- 48
- References
- 69
- Citations by year
- 2026: 22 · 2025: 15 · 2024: 10 · 2023: 1
- FWCI
- 4.37
- Type
- journal article
- Language
- en
- Open access
- gold
- doi.org
- Licence
- Locations
- Nucleic Acids Research (publishedVersion, cc-by)
- PubMed Central (publishedVersion, cc-by)
- PubMed (publishedVersion)
- Funders
- National Institute of Environmental Health Sciences (P30 ES029067)
- National Cancer Institute (R35 CA197707, RO1 CA245514)
- Allen Endowed Chair in Nutrition & Chronic Disease Prevention
- U.S. Department of Defense (GW200026)
- Texas A&M University
- Topics
- Life Sciences › Biochemistry, Genetics and Molecular Biology › Molecular Biology › Gene Regulatory Network Analysis
- Life Sciences › Biochemistry, Genetics and Molecular Biology › Molecular Biology › Single-cell and spatial transcriptomics
- Life Sciences › Biochemistry, Genetics and Molecular Biology › Molecular Biology › Bioinformatics and Genomic Networks
- Keywords
- virtual knockout, gene function prediction, variational graph autoencoder, single-cell RNA sequencing, unsupervised learning, gene perturbation
- MeSH terms
- Animals, Gene Expression Regulation, Sequence Analysis, RNA, Gene Expression Profiling, Gene Regulatory Networks, Gene Knockout Techniques, Single-Cell Analysis
About these checks
Registry, retraction, Cites and statistics results are computed, not judged, with one exception: a printed reference that no index lists is read once by a model before it counts as a citation error. Claims are extracted by a model and kept only when their quote appears verbatim in the text; each cited source is then checked, with a model’s help, for whether it says what the claim relies on. Those verdicts can be wrong — read the claim’s quote and the cited source before relying on one.
Statistics and arithmetic are recomputed, not judged.
Confidence bands are shown only for fields calibrated on our annotated test set. None is calibrated yet, so no band is shown.
What counts as a claim ›How we measure confidence ›How we check this ›
Are you an author, or do you see a problem with this page? Request a review
How to cite
Cite CoChat for the checks on this page, and the paper for its own findings.
- This page
- CoChat. (2026). Citation check: Gene knockout inference with variational graph autoencoder learning single-cell gene regulatory networks. https://app.cochat.ai/papers/10.1093/nar/gkad450
- The paper
- Yang, Y., Li, G., Zhong, Y., Xu, Q., Chen, B.-J., Lin, Y.-T., Chapkin, R. S., & Cai, J. J. (2023). Gene knockout inference with variational graph autoencoder learning single-cell gene regulatory networks. Nucleic Acids Research. https://doi.org/10.1093/nar/gkad450
Data sources
Bibliographic data: Semantic Scholar, OpenAlex, Crossref.
Contains information from the Semantic Scholar Academic Graph Datasets, made available under the ODC Attribution License (ODC-BY 1.0).
Semantic Scholar’s data is described in: Kinney, R., et al. (2023). The Semantic Scholar Open Data Platform. arXiv:2301.10140.
