

SCANPY: large-scale single-cell gene expression data analysis
Open accessPublished version of a preprint
The DOI matches its Crossref record; 54 of the 56 references it cites were found in a registry or an index.
Abstract
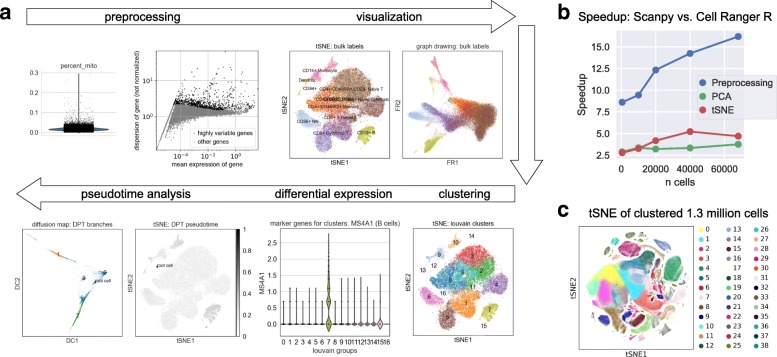
SCANPY is a scalable toolkit for analyzing single-cell gene expression data. It includes methods for preprocessing, visualization, clustering, pseudotime and trajectory inference, differential expression testing, and simulation of gene regulatory networks. Its Python-based implementation efficiently deals with data sets of more than one million cells ( https://github.com/theislab/Scanpy ). Along with SCANPY, we present ANNDATA, a generic class for handling annotated data matrices ( https://github.com/theislab/anndata ).
Overview
The claims and statistics of this paper haven’t been checked yet.
Free: it reads the open-access text and checks the first 5 claims that cite a source we can check. Create a free account to check every claim.
Integrity signals
Registry
Cites
Statistics
Figures
Verification
Claims the paper makes
The claims and statistics of this paper haven’t been checked yet.
Free: it reads the open-access text and checks the first 5 claims that cite a source we can check. Create a free account to check every claim.
Claims other papers make about this one
Each is checked against this paper’s own text: does it say what the citing paper says it does?
The source backs part of the claim, not all of it — or backs it for a different population, condition or comparison.
In the citing paper
“the most widely used analysis packages in the field currently employ DE methods prone to false discoveries by default 35 , 36 .”
From Confronting false discoveries in single-cell differential expression (2021) · cites this paper as [36]
Experimental — accuracy not yet measuredThe cited source says what the claim attributes to it.
In the citing paper
“Currently available platforms exist on the command line in R (McCarthy et al, 2017; Butler et al, 2018) or Python (Wolf et al, 2018), and as local applications (Patel, 2018; preprint: Scholz et al, 2018) or Web servers (Gardeux et al, 2017; Zhu et al, 2017) with graphical user interfaces (GUIs).”
From Current best practices in single-cell RNA-seq analysis: a tutorial (2019) · cites this paper as Wolf et al, 2018
The cited source says what the claim attributes to it.
In the citing paper
“To ensure that our benchmark is not affected by DE calculation, we also selected the top 20 DE genes using Wilcoxon test (tl.rank_genes_groups(method = ’wilcoxon’)).”
From Benchmarking foundation cell models for post-perturbation RNA-seq prediction (2025) · cites this paper as [30]
The cited source says what the claim attributes to it.
In the citing paper
“To filter extremely low-quality or damaged cells, we kept cells with over 200 genes expressed (i.e., expression vector with non-zero value count > 200) for pre-training by using the Seurat 61 and Scanpy 62 packages.”
From Large-scale foundation model on single-cell transcriptomics (2024) · cites this paper as [61]
In the citing paper
“We also identified other known iron regulators for which knockdown increased iron levels, including FBXL5, a negative regulator of iron levels57, the Fe/S cluster biogenesis genes NFU1 and NUBPL, and MCOLN1, which encodes an endolysosomal iron release channel58 (Fig. 2f).”
From Genome-wide CRISPRi/a screens in human neurons link lysosomal failure to ferroptosis (2021) · cites this paper as [58]
2 more claims about this paper
Create a free account to see every claim other papers make about this one.
Self-check
Percentages, sums and reported differences re-computed from the paper’s own numbers.
The self-check needs the paper’s full text.
Citations
Cites
LeCun, Y., Bengio, Y., & Hinton, G. (2015) · Nature · doi:10.1038/nature14539 · Cited by 84,126
Scikit-learn: Machine Learning in Python
Pedregosa, F., Varoquaux, G., Gramfort, A., Michel, V., Thirion, B., Grisel, O., Blondel, M., Müller, A., Nothman, J., Louppe, G., et al. (2012) · arXiv · doi:10.48550/arxiv.1201.0490 · Cited by 71,016 · cited 2×
“Parts of the toolkit rely on SCIKIT - LEARN [27], STATSMODELS [38], S EABORN [39], N ETWORK X [28], IGRAPH [14], the T SNE package of [40], and the Louvain clustering package of [41].”
BackgroundMethodMatplotlib: a 2D graphics environment
Hunter, J. D. (2007) · Computing in Science & Engineering · doi:10.1109/mcse.2007.55 · Cited by 39,249 · cited 1×
“S CANPY ’s core relies on N UMPY [33], S CIPY [34], M AT - PLOTLIB [35], P ANDAS [36], and H 5 PY [37].”
BackgroundFast unfolding of communities in large networks
Blondel, V. D., Guillaume, J.-L., Lambiotte, R., & Lefebvre, E. (2008) · Journal of Statistical Mechanics: Theory and Experiment · doi:10.1088/1742-5468/2008/10/p10008 · Cited by 21,424
The igraph software package for complex network research
Csárdi, G., & Nepusz, T. (2006) · Medical Entomology and Zoology · Cited by 13,507
Trapnell, C., Roberts, A., Goff, L., Pertea, G., Kim, D., Kelley, D. R., Pimentel, H., Salzberg, S. L., Rinn, J. L., & Pachter, L. (2012) · Nature Protocols · doi:10.1038/nprot.2012.016 · Cited by 12,116
Gephi: An Open Source Software for Exploring and Manipulating Networks
Bastian, M., Heymann, S., & Jacomy, M. (2009) · Proceedings of the International AAAI Conference on Web and Social Media · doi:10.1609/icwsm.v3i1.13937 · Cited by 11,675 · cited 1×
“Moreover, the class provides several functions to compute random-walk-based metrics that are not available in other graph software [14, 28, 29].”
BackgroundData Structures for Statistical Computing in Python
McKinney, W. (2010) · Proceedings of the Python in Science Conference · doi:10.25080/majora-92bf1922-00a · Cited by 11,032 · cited 1×
“SCANPY’s technological foundations SCANPY’s core relies on NUMPY [33], SCIPY [34], MATPLOTLIB [35], PANDAS [36], and H5PY [37].”
MethodThe NumPy Array: A Structure for Efficient Numerical Computation
van der Walt, S., Colbert, S. C., & Varoquaux, G. (2011) · Computing in Science & Engineering · doi:10.1109/mcse.2011.37 · Cited by 9,381 · cited 1×
“S CANPY ’s core relies on N UMPY [33], S CIPY [34], M AT - PLOTLIB [35], P ANDAS [36], and H 5 PY [37].”
BackgroundExploring Network Structure, Dynamics, and Function Using NetworkX
Hagberg, A. A., Schult, D. A., & Swart, P. J. (2008) · Proceedings of the Python in Science Conference · doi:10.25080/tcwv9851 · Cited by 7,477 · cited 2×
“Moreover, the class provides several functions to compute randomwalk-based metrics that are not available in other graph software [14, 28, 29].”
BackgroundMethod
Research works printed but not linked: 2
- Collette A. Python and HDF5. Sebasto pol: O’Reilly; 2013.
- Matthews de, G, Alexander G, et al.GPflow: a Gaussian process library using TensorFlow. J Mach Learn Res. 2017; 18:1–6. https://github.com/SheffieldML/GPy .
Cited by
Evolutionary-scale prediction of atomic level protein structure with a language model
Lin, Z., Akin, H., Rao, R., Hie, B., Zhu, Z., Lu, W., Smetanin, N., Verkuil, R., Kabeli, O., Shmueli, Y., et al. (2022) · doi:10.1101/2022.07.20.500902 · Cited by 5,990
Dimensionality reduction for visualizing single-cell data using UMAP
Becht, E., McInnes, L., Healy, J., Dutertre, C.-A., Kwok, I. W. H., Ng, L. G., Ginhoux, F., & Newell, E. W. (2019) · Nature Biotechnology · doi:10.1038/nbt.4314 · Cited by 5,358
The single-cell transcriptional landscape of mammalian organogenesis
Cao, J., Spielmann, M., Qiu, X., Huang, X., Ibrahim, D. M., Hill, A. J., Zhang, F., Mundlos, S., Christiansen, L., Steemers, F. J., et al. (2019) · Nature · doi:10.1038/s41586-019-0969-x · Cited by 4,490
“For tSNE visualization, we directly fit the PCA matrix into scanpy.api.tl.tsne function 60 with perplexity of 30.”
InfluentialHafemeister, C., & Satija, R. (2019) · Genome Biology · doi:10.1186/s13059-019-1874-1 · Cited by 4,479
“, 2018] and SCANPY [Wolf et al., 2018], compensates for this effect.”
BackgroundEfremova, M., Vento-Tormo, M., Teichmann, S. A., & Vento-Tormo, R. (2020) · Nature Protocols · doi:10.1038/s41596-020-0292-x · Cited by 3,449
Metadata
- Authors
- Wolf, F. A., Angerer, P., & Theis, F. J.
- Affiliations
- Helmholtz Munich (DE)
- Corresponding author
- Wolf, F. Alexander
- Theis, Fabian J.
- Venue
- Genome Biology
- Published
- 2018-02-06
- Volume
- 19
- Issue
- 1
- Pages
- 15-15
- ISSN
- 1465-6906 (ISSN-L)
- 1474-760X
- PMC
- PMC5802054
- OpenAlex
- W2800392236
- Cited by
- 8,881
- References
- 56
- Citations by year
- 2026: 1867 · 2025: 2017 · 2024: 1679 · 2023: 1112 · 2022: 862 · 2021: 706 · 2020: 448 · 2019: 152 · 2018: 36
- FWCI
- 122.03
- Type
- journal article
- Language
- en
- Open access
- gold
- doi.org
- Licence
- cc-by
- Locations
- Genome biology (publishedVersion, cc-by)
- bioRxiv (Cold Spring Harbor Laboratory) (acceptedVersion, cc-by-nd)
- PubMed Central (publishedVersion, cc-by)
- PubMed (publishedVersion)
- DOAJ (DOAJ: Directory of Open Access Journals) (submittedVersion, cc-by-sa)
- Site cant be reached (submittedVersion, cc-by)
- Funders
- Helmholtz-Gemeinschaft (Helmholtz Postdoc Grant)
- Topics
- Life Sciences › Biochemistry, Genetics and Molecular Biology › Molecular Biology › Single-cell and spatial transcriptomics
- Life Sciences › Biochemistry, Genetics and Molecular Biology › Molecular Biology › Gene Regulatory Network Analysis
- Life Sciences › Biochemistry, Genetics and Molecular Biology › Molecular Biology › Gene expression and cancer classification
- Keywords
- single-cell RNA sequencing, data preprocessing, clustering, pseudotime, single-cell trajectory analysis, differential gene expression, AnnData, Python
- MeSH terms
- Software, Gene Expression Profiling, Gene Regulatory Networks, Single-Cell Analysis
About these checks
Registry, retraction, Cites and statistics results are computed, not judged, with one exception: a printed reference that no index lists is read once by a model before it counts as a citation error. Claims are extracted by a model and kept only when their quote appears verbatim in the text; each cited source is then checked, with a model’s help, for whether it says what the claim relies on. Those verdicts can be wrong — read the claim’s quote and the cited source before relying on one.
Statistics and arithmetic are recomputed, not judged.
Confidence bands are shown only for fields calibrated on our annotated test set. None is calibrated yet, so no band is shown.
What counts as a claim ›How we measure confidence ›How we check this ›
Are you an author, or do you see a problem with this page? Request a review
How to cite
Cite CoChat for the checks on this page, and the paper for its own findings.
- This page
- CoChat. (2026). Citation check: SCANPY: large-scale single-cell gene expression data analysis. https://app.cochat.ai/papers/10.1186/s13059-017-1382-0
- The paper
- Wolf, F. A., Angerer, P., & Theis, F. J. (2018). SCANPY: large-scale single-cell gene expression data analysis. Genome Biology. https://doi.org/10.1186/s13059-017-1382-0
Data sources
Bibliographic data: Semantic Scholar, OpenAlex, Crossref.
Contains information from the Semantic Scholar Academic Graph Datasets, made available under the ODC Attribution License (ODC-BY 1.0).
Semantic Scholar’s data is described in: Kinney, R., et al. (2023). The Semantic Scholar Open Data Platform. arXiv:2301.10140.
