

The DOI matches its Crossref record.
Repeat or not repeat?—Statistical validation of tandem repeat prediction in genomic sequences
Overview
The claims and statistics of this paper haven’t been checked yet.
Run the check — free, no account needed. It reads the open-access text and checks the sources it cites.
Integrity signals
Registry
Cites
Statistics
Figures
Verification
Claims the paper makes
The claims and statistics of this paper haven’t been checked yet.
Run the check — free, no account needed. It reads the open-access text and checks the sources it cites.
Claims other papers make about this one
Each is checked against this paper’s own text: does it say what the citing paper says it does?
In the citing paper
“TRs with short repetitive units are more frequent than those with long repetitive units (19,23,24)”
From Tandem repeats lead to sequence assembly errors and impose multi-level challenges for genome and protein databases (2019) · cites this paper as [24]
In the citing paper
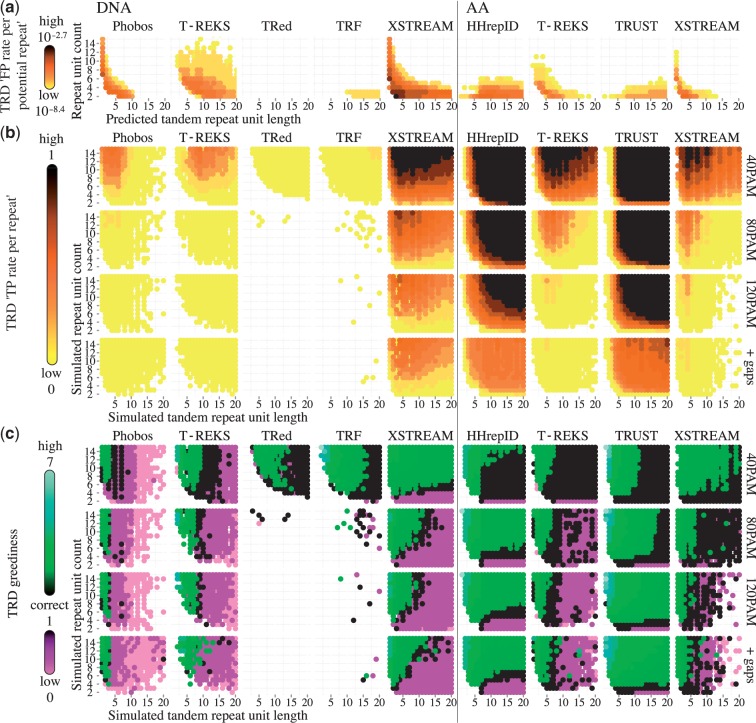
“For example, the Tandem Repeats Finder program appears to be very conservative and has a very low power of predicting diverged repeats (Figure 3 in 24).”
From Tandem repeats lead to sequence assembly errors and impose multi-level challenges for genome and protein databases (2019) · cites this paper as [24]
In the citing paper
“Indeed, testing four selected popular TR finders, Schaper and colleagues reported that 89% of TRs were found by only one program, <1% were found by three and only 0.2% by all four programs (24).”
From Tandem repeats lead to sequence assembly errors and impose multi-level challenges for genome and protein databases (2019) · cites this paper as [24]
In the citing paper
“This is because the statistical error rates and power of TR prediction vary extensively for different repeat types and different methods - due to fundamental differences in prediction methodology and method assumptions (24).”
From Tandem repeats lead to sequence assembly errors and impose multi-level challenges for genome and protein databases (2019) · cites this paper as [24]
In the citing paper
“As a result, the agreement of TR annotations by different methods is low, since different methods achieve optimal power for different subsets of TR space (in terms of TR unit length, repeat number and unit similarity).”
From Tandem repeats lead to sequence assembly errors and impose multi-level challenges for genome and protein databases (2019) · cites this paper as [24]
Self-check
Percentages, sums and reported differences re-computed from the paper’s own numbers.
The self-check needs the paper’s full text.
Citations
Cites
No references could be resolved yet.
Research works printed but not linked: 55
- Wyman, 1980, A highly polymorphic locus in human DNA, Proc. Natl Acad. Sci. USA, 77, 6754, 10.1073/pnas.77.11.6754 · DOI
- Jeffreys, 1985, Individual-specific ‘fingerprints’ of human DNA, Nature, 316, 76, 10.1038/316076a0 · DOI
- Marcotte, 1999, A census of protein repeats, J. Mol. Biol., 293, 151, 10.1006/jmbi.1999.3136 · DOI · Paper page
- Machado, 1998, Human autoantibodies reveal titin as a chromosomal protein, J. Cell Biol., 141, 321, 10.1083/jcb.141.2.321 · DOI
- Itoh-Satoh, 2002, Titin mutations as the molecular basis for dilated cardiomyopathy, Biochem. Biophy. Res. Commun., 291, 385, 10.1006/bbrc.2002.6448 · DOI
- Baxa, 2006, Structure, function, and amyloidogenesis of fungal prions: filament polymorphism and prion variants, Adv. Protein Chem., 73, 125, 10.1016/S0065-3233(06)73005-4 · DOI
- Nelson, 2006, Structural models of amyloid-like fibrils, Adv. Protein Chem., 73, 235, 10.1016/S0065-3233(06)73008-X · DOI
- Hackman, 2003, The role of titin in muscular disorders, Ann. Med., 35, 434, 10.1080/07853890310012797 · DOI
- Siwach, 2008, Tandem repeats in human disorders: mechanisms and evolution, Front. Biosci. J., 13, 4467, 10.2741/3017 · DOI
- Rich, 2000, Population structure and recent evolution of Plasmodium falciparum, Proc. Natl Acad. Sci. USA, 97, 6994, 10.1073/pnas.97.13.6994 · DOI
- Kajava, 2006, Beta-structures in fibrous proteins, Adv. Protein Chem., 73, 1, 10.1016/S0065-3233(06)73001-7 · DOI
- Azevedo, 2006, Role of SGT1 in resistance protein accumulation in plant immunity, EMBO J., 25, 2007, 10.1038/sj.emboj.7601084 · DOI
- Liu, 2007, Recent progress in elucidating the structure, function and evolution of disease resistance genes in plants, J. Genet. Genomics, 34, 765, 10.1016/S1673-8527(07)60087-3 · DOI
- Kajava, 2008, Origin and evolution of GALA-LRR, a new member of the CC-LRR subfamily: from plants to bacteria?, PLoS One, 3, e1694, 10.1371/journal.pone.0001694 · DOI
- Kajava, 2011, Tandem repeats in proteins: from sequence to structure, J. Struct. Biol., 79, 279
- Lee, 2012, Next-generation sequencing technologies and fragment assembly algorithms, 10.1007/978-1-61779-582-4_5 · DOI
- Merkel, 2008, Detecting short tandem repeats from genome data: opening the software black box, Brief. Bioinform., 9, 355, 10.1093/bib/bbn028 · DOI
- Treangen, 2009, Genesis, effects and fates of repeats in prokaryotic genomes, FEMS Microbiol. Rev., 33, 539, 10.1111/j.1574-6976.2009.00169.x · DOI
- Leclercq, 2007, Detecting microsatellites within genomes: significant variation among algorithms, BMC bioinformatics, 8, 125, 10.1186/1471-2105-8-125 · DOI
- Schlötterer, 1992, Slippage synthesis of simple sequence DNA, Nucleic Acids Res., 20, 211, 10.1093/nar/20.2.211 · DOI
- Strand, 1993, Destabilization of tracts of simple repetitive DNA in yeast by mutations affecting DNA mismatch repair, Nature, 365, 274, 10.1038/365274a0 · DOI
- Buard, 1994, Complex recombination events at the hypermutable minisatellite CEB1 (D2S90), EMBO J., 13, 3203, 10.1002/j.1460-2075.1994.tb06619.x · DOI
- Andrade, 2001, Protein repeats: structures, functions, and evolution, J. Struct. Biol., 134, 117, 10.1006/jsbi.2001.4392 · DOI
- Kajava, 1998, Structural diversity of leucine-rich repeat proteins, J. Mol. Biol., 277, 519, 10.1006/jmbi.1998.1643 · DOI
- Rogozin, 2007, Evolution and diversification of lamprey antigen receptors: evidence for involvement of an AID-APOBEC family cytosine deaminase, Nat. Immunol., 8, 647, 10.1038/ni1463 · DOI
- Benson, 1999, Tandem repeats finder: a program to analyze DNA sequences, Nucleic Acids Res., 27, 573, 10.1093/nar/27.2.573 · DOI · Paper page
- Sokol, 2010, TRedD–a database for tandem repeats over the edit distance, Database, 2010, baq003, 10.1093/database/baq003 · DOI
- Matroud, 2012, NTRFinder: a software tool to find nested tandem repeats, Nucleic Acids Res., 40, e17, 10.1093/nar/gkr1070 · DOI
- Kolpakov, 2003, mreps: Efficient and flexible detection of tandem repeats in DNA, Nucleic Acids Res., 31, 3672, 10.1093/nar/gkg617 · DOI
- Szklarczyk, 2004, Tracking repeats using significance and transitivity, Bioinformatics (Oxford, England), 20, i311, 10.1093/bioinformatics/bth911 · DOI
- Newman, 2007, XSTREAM: a practical algorithm for identification and architecture modeling of tandem repeats in protein sequences, BMC Bioinformatics, 8, 382, 10.1186/1471-2105-8-382 · DOI
- Biegert, 2008, De novo identification of highly diverged protein repeats by probabilistic consistency, Bioinformatics (Oxford, England), 24, 807, 10.1093/bioinformatics/btn039 · DOI
- Jorda, 2009, T-REKS: identification of Tandem REpeats in sequences with a K-meanS based algorithm, Bioinformatics (Oxford, England), 25, 2632, 10.1093/bioinformatics/btp482 · DOI
- Delgrange, 2004, STAR: an algorithm to search for tandem approximate repeats, Bioinformatics (Oxford, England), 20, 2812, 10.1093/bioinformatics/bth335 · DOI
- Sokol, 2007, Tandem repeats over the edit distance, Bioinformatics (Oxford, England), 23, e30, 10.1093/bioinformatics/btl309 · DOI
- Heger, 2000, Rapid automatic detection and alignment of repeats in protein sequences, Proteins, 41, 224, 10.1002/1097-0134(20001101)41:2<224::AID-PROT70>3.0.CO;2-Z · DOI
- Altschul, 1990, Basic local alignment search tool, J. Mol. Biol., 215, 403, 10.1016/S0022-2836(05)80360-2 · DOI · Paper page
- Kofler, 2007, SciRoKo: a new tool for whole genome microsatellite search and investigation, Bioinformatics (Oxford, England), 23, 1683, 10.1093/bioinformatics/btm157 · DOI
- Flicek, 2010, Ensembl 2011, Nucleic Acids Res., 39, D800, 10.1093/nar/gkq1064 · DOI
- Katti, 2000, Amino acid repeat patterns in protein sequences: their diversity and structural-functional implications, Prot. Sci., 9, 1203, 10.1110/ps.9.6.1203 · DOI
- Robin, 2007, Statistical tests to compare motif count exceptionalities, BMC bioinformatics, 8, 84, 10.1186/1471-2105-8-84 · DOI
- Dalquen, 2012, ALF–a simulation framework for genome evolution, Mol. Biol. Evol., 29, 1115, 10.1093/molbev/msr268 · DOI
- Tamura, 1993, Estimation of the number of nucleotide substitutions in the control region of mitochondrial DNA in humans and chimpanzees, Mol. Biol. Evol., 10, 512
- Yang, 2006, Computational Molecular Evolution, Oxford Series in Ecology and Evolution Edition, 10.1093/acprof:oso/9780198567028.001.0001 · DOI
- Le, 2008, An improved general amino acid replacement matrix, Mol. Biol. Evol., 25, 1307, 10.1093/molbev/msn067 · DOI · Paper page
- Benner, 1993, Empirical and structural models for insertions and deletions in the divergent evolution of proteins, J. Mol. Biol., 229, 1065, 10.1006/jmbi.1993.1105 · DOI
- Chang, 2004, Empirical analysis of protein insertions and deletions determining parameters for the correct placement of gaps in protein sequence alignments, J. Mol. Biol., 341, 617, 10.1016/j.jmb.2004.05.045 · DOI
- Gernhard, 2008, The conditioned reconstructed process, J. Theor. Biol., 253, 769, 10.1016/j.jtbi.2008.04.005 · DOI
- Elemento, 2002, Reconstructing the duplication history of tandemly repeated genes, Mol. Biol. Evol., 19, 278, 10.1093/oxfordjournals.molbev.a004081 · DOI
- La Rota, 2005, Nonrandom distribution and frequencies of genomic and EST-derived microsatellite markers in rice, wheat, and barley, BMC Genomics, 6, 23, 10.1186/1471-2164-6-23 · DOI
- Kimura, 1980, A simple method for estimating evolutionary rates of base substitutions through comparative studies of nucleotide sequences, J. Mol. Evol., 16, 111, 10.1007/BF01731581 · DOI · Paper page
- Loytynoja, 2008, Phylogeny-aware gap placement prevents errors in sequence alignment and evolutionary analysis, Science, 320, 1632, 10.1126/science.1158395 · DOI
- Fletcher, 2009, INDELible: a flexible simulator of biological sequence evolution, Mol. Biol. Evol., 26, 1879, 10.1093/molbev/msp098 · DOI
- Corrado, 2010, The exact distribution of the maximum, minimum and the range of Multinomial/Dirichlet and Multivariate Hypergeometric frequencies, Stat. Comput., 21, 349, 10.1007/s11222-010-9174-3 · DOI
- Johnson, 1997, Discrete Multivariate Distributions
Cited by
Sorted by citations
Tørresen, O. K., Star, B., Mier, P., Andrade-Navarro, M. A., Bateman, A., Jarnot, P., Gruca, A., Grynberg, M., Kajava, A. V., Promponas, V. J., et al. (2019) · Nucleic Acids Research · doi:10.1093/nar/gkz841 · Cited by 347
Self-citationThe landscape of human STR variation
Willems, T., Gymrek, M., Highnam, G., The 1000 Genomes Project Consortium, Mittelman, D., & Erlich, Y. (2014) · Genome Research · doi:10.1101/gr.177774.114 · Cited by 283
The rise and fall of TRP-N, an ancient family of mechanogated ion channels, in Metazoa
Schüler, A., Schmitz, G., Reft, A., Özbek, S., Thurm, U., & Bornberg-Bauer, E. (2015) · Genome Biology and Evolution · doi:10.1093/gbe/evv091 · Cited by 51
Metadata
- Authors
- Schaper, E., Kajava, A. V., Hauser, A., & Anisimova, M.
- Venue
- Nucleic Acids Research
- Publisher
- Oxford University Press (OUP)
- Published
- 2012-08-24
- Volume
- 40
- Issue
- 20
- Pages
- 10005-10017
- ISSN
- 1362-4962
- 0305-1048
- PMC
- PMC3488214
- Cited by
- 52
- References
- 0
- Language
- en
About these checks
Registry, retraction, Cites and statistics results are computed, not judged, with one exception: a printed reference that no index lists is read once by a model before it counts as a citation error. Claims are extracted by a model and kept only when their quote appears verbatim in the text; each cited source is then checked, with a model’s help, for whether it says what the claim relies on. Those verdicts can be wrong — read the claim’s quote and the cited source before relying on one.
Statistics and arithmetic are recomputed, not judged.
Confidence bands are shown only for fields calibrated on our annotated test set. None is calibrated yet, so no band is shown.
What counts as a claim ›How we measure confidence ›How we check this ›
Are you an author, or do you see a problem with this page? Request a review
How to cite
Cite CoChat for the checks on this page, and the paper for its own findings.
- This page
- CoChat. (2026). Citation check: Repeat or not repeat?—Statistical validation of tandem repeat prediction in genomic sequences. https://app.cochat.ai/papers/10.1093/nar/gks726
- The paper
- Schaper, E., Kajava, A. V., Hauser, A., & Anisimova, M. (2012). Repeat or not repeat?—Statistical validation of tandem repeat prediction in genomic sequences. Nucleic Acids Research. https://doi.org/10.1093/nar/gks726
