

The DOI matches its Crossref record; 65 of the 65 references it cites were found in a registry or an index.
Reverse engineering and analysis of large genome-scale gene networks
Abstract
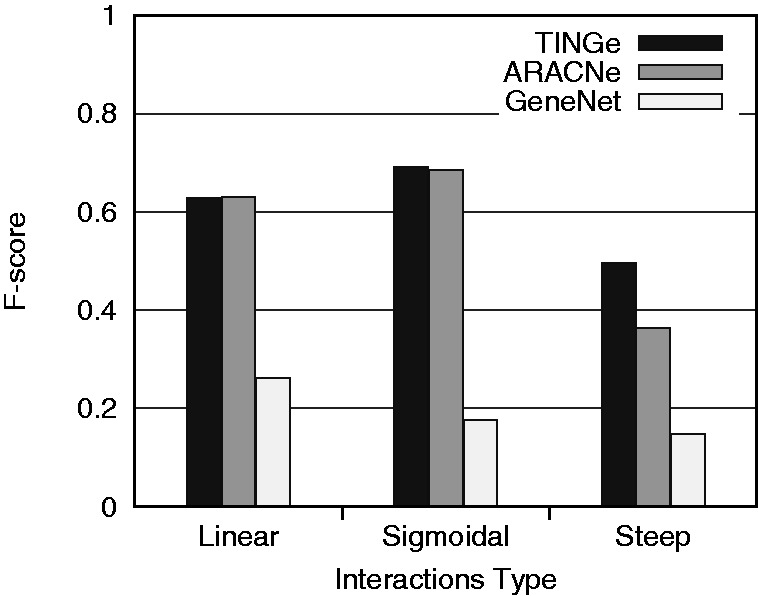
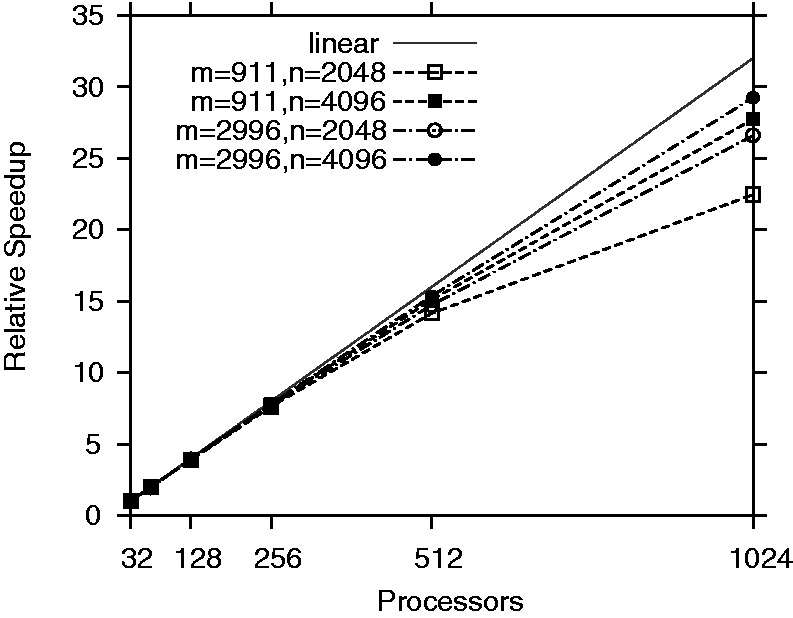
Reverse engineering the whole-genome networks of complex multicellular organisms continues to remain a challenge. While simpler models easily scale to large number of genes and gene expression datasets, more accurate models are compute intensive limiting their scale of applicability. To enable fast and accurate reconstruction of large networks, we developed Tool for Inferring Network of Genes (TINGe), a parallel mutual information (MI)-based program. The novel features of our approach include: (i) B-spline-based formulation for linear-time computation of MI, (ii) a novel algorithm for direct permutation testing and (iii) development of parallel algorithms to reduce run-time and facilitate construction of large networks. We assess the quality of our method by comparison with ARACNe (Algorithm for the Reconstruction of Accurate Cellular Networks) and GeneNet and demonstrate its unique capability by reverse engineering the whole-genome network of Arabidopsis thaliana from 3137 Affymetrix ATH1 GeneChips in just 9 min on a 1024-core cluster. We further report on the development of a new software Gene Network Analyzer (GeNA) for extracting context-specific subnetworks from a given set of seed genes. Using TINGe and GeNA, we performed analysis of 241 Arabidopsis AraCyc 8.0 pathways, and the results are made available through the web.
Overview
The claims and statistics of this paper haven’t been checked yet.
Run the check — free, no account needed. It reads the open-access text and checks the sources it cites.
Integrity signals
Registry
Cites
Statistics
Figures
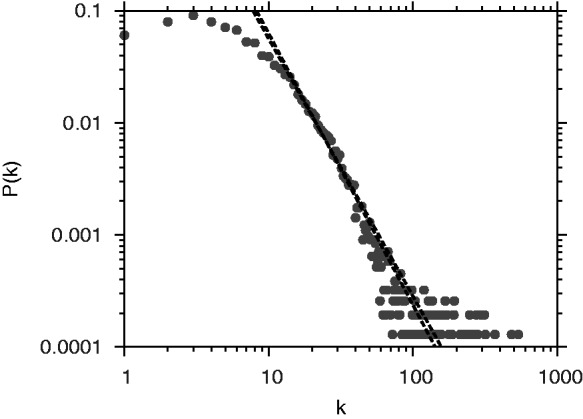
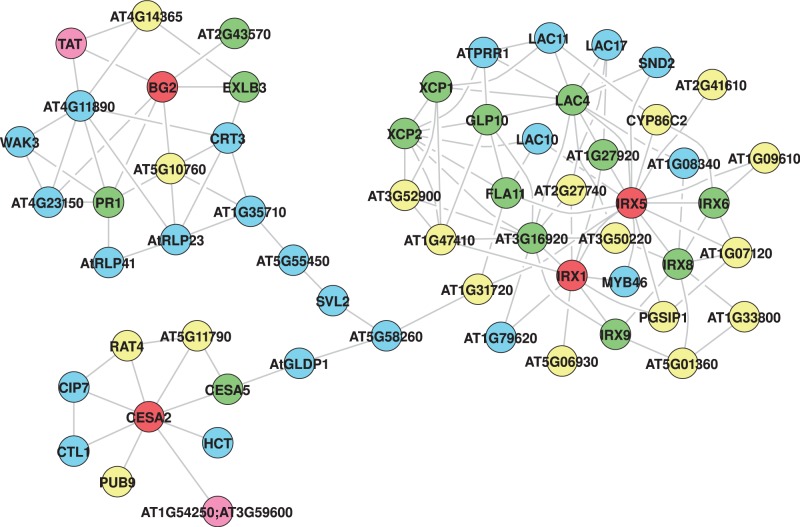
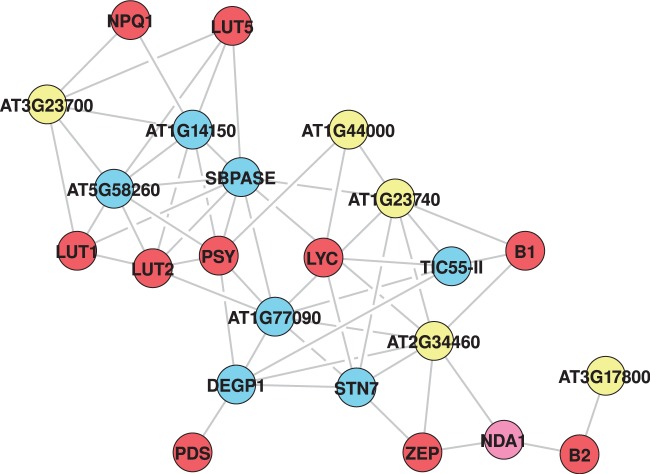
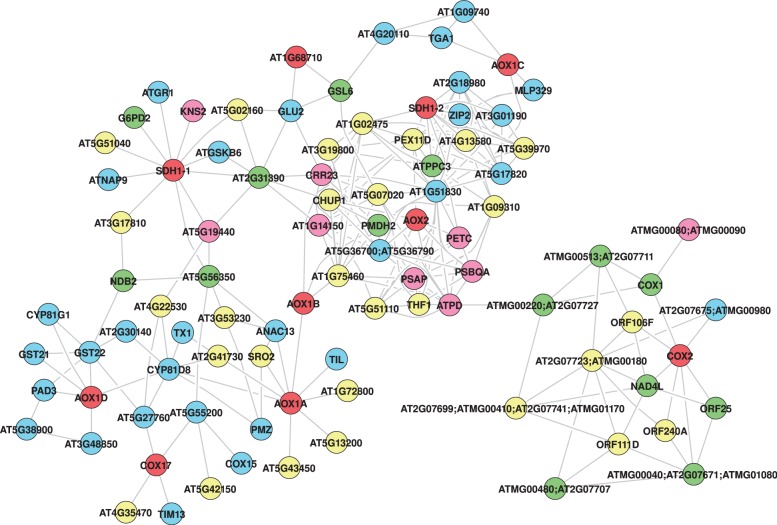
Verification
Claims the paper makes
The claims and statistics of this paper haven’t been checked yet.
Run the check — free, no account needed. It reads the open-access text and checks the sources it cites.
Claims other papers make about this one
Each is checked against this paper’s own text: does it say what the citing paper says it does?
In the citing paper
“We confirmed these findings with a second RNE approach (TINGe, Tool for Inferring Network of Genes) (Aluru et al., 2013), which demonstrated high similarity in the number of interactions, the average degree of connectivity and the rank of hubs based on degrees of connectivity as determined by ARACNe”
From Transcriptome-Based Network Analysis Reveals a Spectrum Model of Human Macrophage Activation (2014) · cites this paper as Aluru et al., 2013
Self-check
Percentages, sums and reported differences re-computed from the paper’s own numbers.
The self-check needs the paper’s full text.
Citations
Cites
Cytoscape: A software Environment for integrated models of biomolecular interaction networks
Shannon, P., Markiel, A., Ozier, O., Baliga, N. S., Wang, J. T., Ramage, D., Amin, N., Schwikowski, B., & Ideker, T. (2003) · Genome Research · doi:10.1101/gr.1239303 · Cited by 51,888
Collective dynamics of ‘small-world’ networks
Watts, D. J., & Strogatz, S. H. (1998) · Nature · doi:10.1038/30918 · Cited by 43,060
Elements of Information Theory
Cover, T. M., & Thomas, J. A. (2001) · Wiley eBooks · doi:10.1002/0471200611 · Cited by 36,808
Cluster analysis and display of genome-wide expression patterns
Eisen, M. B., Spellman, P. T., Brown, P. O., & Botstein, D. (1998) · Proceedings of the National Academy of Sciences · doi:10.1073/pnas.95.25.14863 · Cited by 16,184
The anatomy of a large-scale hypertextual Web search engine
Brin, S., & Page, L. (1998) · Computer Networks and ISDN Systems · doi:10.1016/s0169-7552(98)00110-x · Cited by 16,004
Elements of Information Theory
Cover, T. M., & Thomas, J. A. (2005) · doi:10.1002/047174882x · Cited by 13,791
Network biology: understanding the cell's functional organization
Barabási, A.-L., & Oltvai, Z. N. (2004) · Nature Reviews Genetics · doi:10.1038/nrg1272 · Cited by 7,903
Kraskov, A., Stögbauer, H., & Grassberger, P. (2004) · Physical Review E · doi:10.1103/physreve.69.066138 · Cited by 3,512
Bioinformatics and Computational Biology Solutions Using R and Bioconductor
(2005) · Statistics for Biology and Health · doi:10.1007/0-387-29362-0 · Cited by 3,289
Using Bayesian Networks to Analyze Expression Data
Friedman, N., Linial, M., Nachman, I., & Pe'er, D. (2000) · Journal of Computational Biology · doi:10.1089/106652700750050961 · Cited by 3,266
Faith, J. J., Hayete, B., Thaden, J. T., Mogno, I., Wierzbowski, J., Cottarel, G., Kasif, S., Collins, J. J., & Gardner, T. S. (2007) · PLoS Biology · doi:10.1371/journal.pbio.0050008 · Cited by 1,563
BIND--The Biomolecular Interaction Network Database
Bader, G. D., Donaldson, I., Wolting, C., Ouellette, B. F., Pawson, T., & Hogue, C. W. (2001) · Nucleic Acids Research · doi:10.1093/nar/29.1.242 · Cited by 1,558
Reverse engineering of regulatory networks in human B cells
Basso, K., Margolin, A. A., Stolovitzky, G., Klein, U., Dalla-Favera, R., & Califano, A. (2005) · Nature Genetics · doi:10.1038/ng1532 · Cited by 1,404
Respiratory metabolism: glycolysis, the TCA cycle and mitochondrial electron transport
Fernie, A. R., Carrari, F., & Sweetlove, L. J. (2004) · Current Opinion in Plant Biology · doi:10.1016/j.pbi.2004.03.007 · Cited by 1,403
Walking the Interactome for Prioritization of Candidate Disease Genes
Köhler, S., Bauer, S., Horn, D., & Robinson, P. N. (2008) · The American Journal of Human Genetics · doi:10.1016/j.ajhg.2008.02.013 · Cited by 1,258
Discovering regulatory and signalling circuits in molecular interaction networks
Ideker, T., Ozier, O., Schwikowski, B., & Siegel, A. F. (2002) · Bioinformatics · doi:10.1093/bioinformatics/18.suppl_1.s233 · Cited by 1,197
Topic-sensitive pagerank: A context-sensitive ranking algorithm for web search
Haveliwala, T. H. (2003) · IEEE Transactions on Knowledge and Data Engineering · doi:10.1109/tkde.2003.1208999 · Cited by 1,046
STRUCTURE AND FUNCTION OF PHOTOSYSTEMS I AND II
Nelson, N., & Yocum, C. F. (2006) · Annual Review of Plant Biology · doi:10.1146/annurev.arplant.57.032905.105350 · Cited by 1,034
Source to sink: regulation of carotenoid biosynthesis in plants
Cazzonelli, C. I., & Pogson, B. J. (2010) · Trends in Plant Science · doi:10.1016/j.tplants.2010.02.003 · Cited by 904
Associating Genes and Protein Complexes with Disease via Network Propagation
Vanunu, O., Magger, O., Ruppin, E., Shlomi, T., & Sharan, R. (2010) · PLoS Computational Biology · doi:10.1371/journal.pcbi.1000641 · Cited by 872
Multiple-laboratory comparison of microarray platforms
Irizarry, R. A., Warren, D., Spencer, F., Kim, I. F., Biswal, S., Frank, B. C., Gabrielson, E., Garcia, J. G. N., Geoghegan, J., Germino, G., et al. (2005) · Nature Methods · doi:10.1038/nmeth756 · Cited by 862
An empirical Bayes approach to inferring large-scale gene association networks
Schäfer, J., & Strimmer, K. (2005) · Bioinformatics · doi:10.1093/bioinformatics/bti062 · Cited by 795
Revealing strengths and weaknesses of methods for gene network inference
Marbach, D., Prill, R. J., Schaffter, T., Mattiussi, C., Floreano, D., & Stolovitzky, G. (2010) · Proceedings of the National Academy of Sciences · doi:10.1073/pnas.0913357107 · Cited by 752
Graph Clustering Via a Discrete Uncoupling Process
Van Dongen, S. (2008) · SIAM Journal on Matrix Analysis and Applications · doi:10.1137/040608635 · Cited by 750
Reverse engineering gene networks using singular value decomposition and robust regression
Yeung, M. K. S., Tegnér, J., & Collins, J. J. (2002) · Proceedings of the National Academy of Sciences · doi:10.1073/pnas.092576199 · Cited by 667
Persson, S., Wei, H., Milne, J., Page, G. P., & Somerville, C. R. (2005) · Proceedings of the National Academy of Sciences · doi:10.1073/pnas.0503392102 · Cited by 598
GeneNetWeaver: in silico benchmark generation and performance profiling of network inference methods
Schaffter, T., Marbach, D., & Floreano, D. (2011) · Bioinformatics · doi:10.1093/bioinformatics/btr373 · Cited by 551
Cellulose Biosynthesis in Plants: from Genes to Rosettes
Doblin, M. S., Kurek, I., Jacob‐Wilk, D., et al. (2002) · Plant and Cell Physiology · doi:10.1093/pcp/pcf164 · Cited by 540
Identifying functional modules in protein–protein interaction networks: an integrated exact approach
Dittrich, M. T., Klau, G. W., Rosenwald, A., Dandekar, T., & Müller, T. (2008) · Bioinformatics · doi:10.1093/bioinformatics/btn161 · Cited by 536
Photoinhibition of photosystem I
Sonoike, K. (2010) · Physiologia Plantarum · doi:10.1111/j.1399-3054.2010.01437.x · Cited by 517
AraCyc: A Biochemical Pathway Database for Arabidopsis
Mueller, L. A., Zhang, P., & Rhee, S. Y. (2003) · Plant Physiology · doi:10.1104/pp.102.017236 · Cited by 433
Sparse graphical Gaussian modeling of the isoprenoid gene network in Arabidopsis thaliana
Wille, A., Zimmermann, P., Vranová, E., Fürholz, A., Laule, O., Bleuler, S., Hennig, L., Prelić, A., von Rohr, P., Thiele, L., et al. (2004) · Genome biology · doi:10.1186/gb-2004-5-11-r92 · Cited by 384
The power of protein interaction networks for associating genes with diseases
Navlakha, S., & Kingsford, C. (2010) · Bioinformatics · doi:10.1093/bioinformatics/btq076 · Cited by 362
Rational association of genes with traits using a genome-scale gene network for Arabidopsis thaliana
Lee, I., Ambaru, B., Thakkar, P., Marcotte, E. M., & Rhee, S. Y. (2010) · Nature Biotechnology · doi:10.1038/nbt.1603 · Cited by 352
Clifton, R., Millar, A. H., & Whelan, J. (2006) · Biochimica et Biophysica Acta (BBA) - Bioenergetics · doi:10.1016/j.bbabio.2006.03.009 · Cited by 343
Transitive functional annotation by shortest-path analysis of gene expression data
Zhou, X., Kao, M.-C. J., & Wong, W. H. (2002) · Proceedings of the National Academy of Sciences · doi:10.1073/pnas.192159399 · Cited by 323
Discovering molecular pathways from protein interaction and gene expression data
Segal, E., Wang, H., & Koller, D. (2003) · Bioinformatics · doi:10.1093/bioinformatics/btg1037 · Cited by 302
Alm, E. (2003) · Current Opinion in Structural Biology · doi:10.1016/s0959-440x(03)00031-9 · Cited by 298
Van den Bulcke, T., Van Leemput, K., Naudts, B., van Remortel, P., Ma, H., Verschoren, A., De Moor, B., & Marchal, K. (2006) · BMC Bioinformatics · doi:10.1186/1471-2105-7-43 · Cited by 293
Daub, C. O., Steuer, R., Selbig, J., & Kloska, S. (2004) · BMC Bioinformatics · doi:10.1186/1471-2105-5-118 · Cited by 286
GeneRank: Using search engine technology for the analysis of microarray experiments
Morrison, J. L., Breitling, R., Higham, D. J., & Gilbert, D. R. (2005) · BMC Bioinformatics · doi:10.1186/1471-2105-6-233 · Cited by 271
Lezon, T. R., Banavar, J. R., Cieplak, M., Maritan, A., & Fedoroff, N. V. (2006) · Proceedings of the National Academy of Sciences · doi:10.1073/pnas.0609152103 · Cited by 269
AnArabidopsisgene network based on the graphical Gaussian modelPreprint
Ma, S., Gong, Q., & Bohnert, H. J. (2007) · Genome Research · doi:10.1101/gr.6911207 · Cited by 244
Compartmentation in plant metabolism
Lunn, J. E. (2006) · Journal of Experimental Botany · doi:10.1093/jxb/erl134 · Cited by 211
Arabidopsis gene co-expression network and its functional modules
Mao, L., Hemert, J. L. V., Dash, S., & Dickerson, J. A. (2009) · BMC Bioinformatics · doi:10.1186/1471-2105-10-346 · Cited by 200
Transcriptional Coordination of the Metabolic Network in Arabidopsis
Wei, H., Persson, S., Mehta, T. S., Srinivasasainagendra, V., Chen, L., Page, G. P., Somerville, C. R., & Loraine, A. E. (2006) · PLANT PHYSIOLOGY · doi:10.1104/pp.106.080358 · Cited by 197
DA DA: Degree-Aware Algorithms for Network-Based Disease Gene Prioritization
Erten, S., Bebek, G., Ewing, R. M., & Koyutürk, M. (2011) · BioData Mining · doi:10.1186/1756-0381-4-19 · Cited by 195
Joët, T., Cournac, L., Peltier, G., & Havaux, M. (2002) · PLANT PHYSIOLOGY · doi:10.1104/pp.010775 · Cited by 182
Photoinhibition of photosystem I
Scheller, H. V., & Haldrup, A. (2005) · Planta · doi:10.1007/s00425-005-1507-7 · Cited by 148
Nayak, R. R., Kearns, M. J., Spielman, R. S., & Cheung, V. G. (2009) · Genome Research · doi:10.1101/gr.097600.109 · Cited by 134
Differential network expression during drug and stress response
Cabusora, L., Sutton, E., Fulmer, A. W., & Forst, C. V. (2005) · Computer applications in the biosciences · doi:10.1093/bioinformatics/bti440 · Cited by 116
Escobar, M. A., Franklin, K. A., Svensson, A. E., Salter, M. G., Whitelam, G. C., & Rasmusson, A. G. (2004) · PLANT PHYSIOLOGY · doi:10.1104/pp.104.046698 · Cited by 114
Inferring pathways from gene lists using a literature-derived network of biological relationships
Rajagopalan, D., & Agarwal, P. (2004) · Bioinformatics · doi:10.1093/bioinformatics/bti069 · Cited by 113
Identifying functional modules using expression profiles and confidence-scored protein interactions
Ulitsky, I., & Ron Shamir, A. (2009) · Bioinformatics · doi:10.1093/bioinformatics/btp118 · Cited by 111
Yi, X., Hargett, S. R., Frankel, L. K., & Bricker, T. (2006) · Journal of Biological Chemistry · doi:10.1074/jbc.m603582200 · Cited by 110
Cellulose synthesis in the Arabidopsis secondary cell wall
Taylor, N. G., Gardiner, J. C., Whiteman, R., & Turner, S. R. (2004) · Cellulose · doi:10.1023/b:cell.0000046405.11326.a8 · Cited by 104
Theory and Limitations of Genetic Network Inference from Microarray Data
Margolin, A. A., & Califano, A. (2007) · Annals of the New York Academy of Sciences · doi:10.1196/annals.1407.019 · Cited by 97
Wall associated kinases from plants — an overview
Kanneganti, V., & Gupta, A. K. (2008) · Physiology and Molecular Biology of Plants · doi:10.1007/s12298-008-0010-6 · Cited by 88
Using Bayesian Network Inference Algorithms to Recover Molecular Genetic Regulatory Networks
Yu, J. Q., Smith, V. A., Wang, P. P., Hartemink, A. J., & Jarvis, E. D. (2002) · Cited by 83
Carrera, J., Rodrigo, G., Jaramillo, A., & Elena, S. F. (2009) · Genome biology · doi:10.1186/gb-2009-10-9-r96 · Cited by 77
Identifying Regulatory Subnetworks for a Set of Genes
Scott, M. S., Perkins, T. J., Bunnell, S., Pepin, F., Thomas, D. Y., & Hallett, M. T. (2005) · Molecular & Cellular Proteomics · doi:10.1074/mcp.m400110-mcp200 · Cited by 72
Tamada, Y., Imoto, S., Araki, H., Nagasaki, M., Print, C. G., Jones, D. S., & Miyano, S. (2010) · IEEE Transactions on Computational Biology and Bioinformatics · doi:10.1109/tcbb.2010.68 · Cited by 66
Network module detection: Affinity search technique with the multi-node topological overlap measure
Li, A., & Horvath, S. (2009) · BMC Research Notes · doi:10.1186/1756-0500-2-142 · Cited by 56
Bailly‐Bechet, M., Braunstein, A., Pagnani, A., Weigt, M., & Zecchina, R. (2010) · BMC Bioinformatics · doi:10.1186/1471-2105-11-355 · Cited by 40
Pop, A.-R., Huttenhower, C., Iyer‐Pascuzzi, A. S., Benfey, P. N., & Troyanskaya, O. G. (2010) · BMC Systems Biology · doi:10.1186/1752-0509-4-180 · Cited by 21
Cited by
Transcriptome-Based Network Analysis Reveals a Spectrum Model of Human Macrophage Activation
Xue, J., Schmidt, S. V., Sander, J., Draffehn, A., Krebs, W., Quester, I., De Nardo, D., Gohel, T. D., Emde, M., Schmidleithner, L., et al. (2014) · Immunity · doi:10.1016/j.immuni.2014.01.006 · Cited by 2,210
Metadata
- Authors
- Aluru, M., Zola, J., Nettleton, D., & Aluru, S.
- Affiliations
- Department of Genetics, Development, and Cell Biology, 2Department of Electrical and Computer Engineering, 3Department of Statistics, Iowa State University, Ames, IA 50011, USA and 4Department of Computer Science and Engineering, Indian Institute of Technology Bombay, Powai, Mumbai 400076, India
- Venue
- Nucleic Acids Research
- Publisher
- Oxford University Press (OUP)
- Published
- 2012-10-05
- Volume
- 41
- Issue
- 1
- Pages
- e24-e24
- ISSN
- 1362-4962
- 0305-1048
- PMC
- PMC3592423
- Cited by
- 34
- References
- 65
- Language
- en
About these checks
Registry, retraction, Cites and statistics results are computed, not judged, with one exception: a printed reference that no index lists is read once by a model before it counts as a citation error. Claims are extracted by a model and kept only when their quote appears verbatim in the text; each cited source is then checked, with a model’s help, for whether it says what the claim relies on. Those verdicts can be wrong — read the claim’s quote and the cited source before relying on one.
Statistics and arithmetic are recomputed, not judged.
Confidence bands are shown only for fields calibrated on our annotated test set. None is calibrated yet, so no band is shown.
What counts as a claim ›How we measure confidence ›How we check this ›
Are you an author, or do you see a problem with this page? Request a review
Data sources
Bibliographic data: Semantic Scholar, OpenAlex, Crossref.
Contains information from the Semantic Scholar Academic Graph Datasets, made available under the ODC Attribution License (ODC-BY 1.0).
Semantic Scholar’s data is described in: Kinney, R., et al. (2023). The Semantic Scholar Open Data Platform. arXiv:2301.10140.
