

The DOI matches its Crossref record; 96 of the 96 references it cites were found in a registry or an index; 8 of the 30 sources its claims cite were checked for support.
Empirical Asset Pricing via Machine Learning
Open accessAbstract
We perform a comparative analysis of machine learning methods for the canonical problem of empirical asset pricing: measuring asset risk premiums. We demonstrate large economic gains to investors using machine learning forecasts, in some cases doubling the performance of leading regression-based strategies from the literature. We identify the best-performing methods (trees and neural networks) and trace their predictive gains to allowing nonlinear predictor interactions missed by other methods. All methods agree on the same set of dominant predictive signals, a set that includes variations on momentum, liquidity, and volatility. Authors have furnished an Internet Appendix, which is available on the Oxford University Press Web site next to the link to the final published paper online.
Overview
CoChat Summary
TL;DR
This paper compares machine learning methods for measuring equity risk premiums and finds that nonlinear methods—especially neural networks and trees—substantially improve out-of-sample return prediction and portfolio performance over linear benchmarks. The gains come from capturing nonlinear predictor interactions, and all methods agree on price trend, liquidity, and volatility signals as dominant predictors.
Key findings
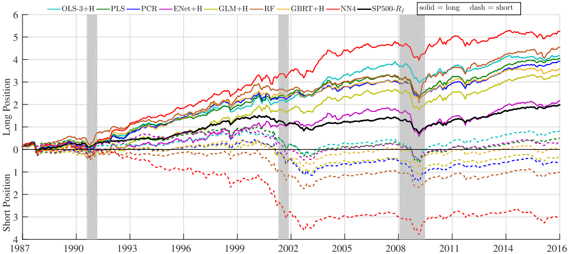
- Machine learning forecasts produce large economic gains: a value-weighted long-short decile spread based on NN4 earns an annualized out-of-sample Sharpe ratio of 1.35, versus 0.61 for the OLS-3 benchmark; equal-weighted, NN4 earns 2.45 versus 0.83 for OLS-3. Timing the S&P 500 with NN3 forecasts raises the annualized out-of-sample Sharpe ratio to 0.77 from 0.51 for buy-and-hold.
- Neural networks and trees dominate linear methods. Monthly stock-level out-of-sample R² is −3.46% for OLS with all covariates, 0.16% for OLS-3, 0.11% for elastic net, 0.27% for PCR, 0.26% for PLS, 0.33% for random forest, 0.34% for GBRT, 0.33% for NN1, and peaks at 0.40% for NN3; deeper NN4 and NN5 do not improve on NN3.
- Portfolio-level predictability is stronger: bottom-up S&P 500 monthly R² is −0.22% for OLS-3, 0.71% for GLM, and 1.80% for NN3. Annual stock-level R² is nearly an order of magnitude larger than monthly.
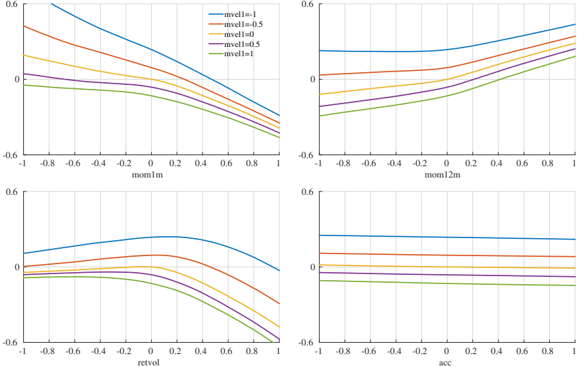
- All methods agree on the most informative predictors: price trends (momentum, short-term reversal, industry momentum), liquidity variables (market value, dollar volume, bid-ask spread, turnover), and volatility/risk measures (total and idiosyncratic volatility, beta, beta squared).
Methods
- Comparative analysis of thirteen models: OLS, OLS-3, PLS, PCR, elastic net, generalized linear model with group lasso, random forest, gradient boosted regression trees, and neural networks with one to five hidden layers (NN1–NN5), with Huber-loss variants for several methods.
- Data: monthly CRSP individual equity returns for NYSE, AMEX, and NASDAQ firms from March 1957 to December 2016, almost 30,000 stocks with an average exceeding 6,200 stocks per month; 94 stock-level characteristics, 74 industry dummies, and 8 macroeconomic predictors, totaling 920 covariates.
- Design: split into 18 years training (1957–1974), 12 years validation (1975–1986), and 30 years out-of-sample testing (1987–2016); models refit annually. Evaluation uses out-of-sample R², Diebold-Mariano tests, portfolio sorts, and variable importance measures.
Limitations
- Stated: machine learning methods are measurement tools and “do not identify deep fundamental associations” or economic mechanisms/equilibria; the analysis is not exhaustive (e.g., support vector machines are excluded), and the paper’s goal in interpreting models is “modest.”
- Stated: shallow learning outperforms deep learning, likely due to the relatively small amount of data and low signal-to-noise ratio in asset pricing.
- Evident: multiple comparisons are a concern, addressed with Bonferroni adjustments; network architectures are fixed ex ante rather than fully searched; missing characteristics are replaced with cross-sectional medians, characteristics are lagged to avoid forward-looking bias, and the sample ends in 2016.
Model-written summary. Check it against the paper before relying on it.
Integrity signals
Registry
Cites
Statistics
Figures




Verification
Claims the paper makes
7 Valid · 8 Not valid · 17 Not checked · 210 Own results and interpretations
The cited sources support only part of this claim — read each source’s verdict below.
In the paper
“The overarching model specified by ( 2) and ( 21) nests many models proposed in the literature (Rosenberg 1974; Harvey and Ferson 1999, among others).”
§ Empirical Asset Pricing via Machine Learning * > 2.1 Data and the overarching model
What the sources say
- Not checked — no full text of the sourcecites Rosenberg 1974 source
- Partly supportedcites Harvey and Ferson 1999 sourceExperimental — accuracy not yet measured
In “A. Time-Series Tests” (page unavailable), Ferson and Harvey describe a general conditional-return model and show that setting its alpha to zero gives the Fama–French model; they also relate their specification to several earlier studies. Our copy does not establish that the citing paper’s own equations (2) and (21) nest those models. (LLM, conf=0.74)
plain- Asserted: passes — The authors put it forward as true.
- Checkable: passes — It can be checked against evidence.
- Load-bearing: unclear — It is unclear whether the paper’s conclusions depend on it.
- Based: passes — The paper gives a reason why it holds.
Every source the paper cites for this claim was checked and supports it.
In the paper
“nearly all of the macroeconomic return predictor variables in the survey of Welch and Goyal (2008) fail to produce a positive out-of-sample forecast R 2 .”
§ Empirical Asset Pricing via Machine Learning * > 2.4.1 Prespecified portfolios.
What the sources say
- Supportedcites Welch and Goyal (2008) source
Section 4 (Annual Prediction, p. 8) evaluates out-of-sample forecasts against the prevailing mean; the table notes define positive ΔRMSE as superior out-of-sample performance. The Conclusion (p. 28) says that forecasting with the historical equity premium would have done just as well and that the models generally performed poorly. Although the paper reports ΔRMSE rather than out-of-sample R² as its main measure, the claim accurately paraphrases its broad finding. (LLM, conf=0.85)
plain- Asserted: passes — The authors put it forward as true.
- Checkable: passes — It can be checked against evidence.
- Load-bearing: passes — The paper’s conclusions depend on it.
- Based: passes — The paper gives a reason why it holds.
- Supported
Every source the paper cites for this claim was checked and supports it.
In the paper
“Campbell and Thompson (2008) show that small improvements in R 2 can map into large utility gains for a mean-variance investor.”
§ Empirical Asset Pricing via Machine Learning * > 2.4.1 Prespecified portfolios.
What the sources say
- Supportedcites Campbell and Thompson (2008) source
In the main-text discussion of predictive regressions, the paper says small R² statistics can generate large benefits for investors. Its Table 4 discussion measures those benefits as changes in utility for a risk-averse investor choosing a stock portfolio; the indexed copy does not provide a page number. (LLM, conf=0.92)
plainstates a cause- Asserted: passes — The authors put it forward as true.
- Checkable: passes — It can be checked against evidence.
- Load-bearing: passes — The paper’s conclusions depend on it.
- Based: passes — The paper gives a reason why it holds.
- Supported
A result the paper reports from its own data — it cites no other source for it, so there is none to check. The quote shows it is in the paper.
In the paper
“And when we form a long-short decile spread directly sorted on stock return predictions from a neural network, the strategy earns an annualized out-of-sample Sharpe ratio of 1.35 (value-weighted) and 2.45 (equal-weighted).”
§ Empirical Asset Pricing via Machine Learning * > Abstract
plain- Asserted: passes — The authors put it forward as true.
- Checkable: passes — It can be checked against evidence.
- Load-bearing: passes — The paper’s conclusions depend on it.
- Based: passes — The paper gives a reason why it holds.
A result the paper reports from its own data — it cites no other source for it, so there is none to check. The quote shows it is in the paper.
In the paper
“When we apply our machine learning repertoire to the simulated data sets, we find that linear and generalized linear methods dominate in the linear and uninteracted setting, yet tree-based methods and neural networks significantly outperform in the nonlinear and interactive setting.”
§ Empirical Asset Pricing via Machine Learning * > Abstract
plainstates an association- Asserted: passes — The authors put it forward as true.
- Checkable: passes — It can be checked against evidence.
- Load-bearing: passes — The paper’s conclusions depend on it.
- Based: passes — The paper gives a reason why it holds.
121 more claims
Create a free account to see all 242 claims and every source verdict.
- It may state two separate claims as one. 70
- Probably not a substantial claim. 50
- The quote only partly states this claim. 7
Self-check
Percentages, sums and reported differences re-computed from the paper’s own numbers.
Each contradiction between two passages listed here was confirmed by an independent check.
Rated minor: it would not touch a result — a value no result rests on, a p-value that stays on the same side of the significance level, or a conflict that is clerical, resolved elsewhere in the paper, or outside its own findings.
In the paper
§ Empirical Asset Pricing via Machine Learning * > 1.5 Generalized linear
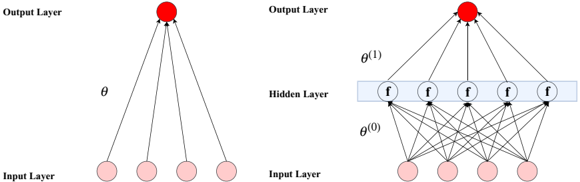
“the parameters are now a K ×N matrix θ =(θ 1 ,θ 2 ,...,θ N ).”
§ Empirical Asset Pricing via Machine Learning * > 1.5 Generalized linear
“g(z;θ,p(•)) = P j =1 p(z j ) θ j ,(13)”
Citations
Cites
Deep Residual Learning for Image Recognition
He, K., Zhang, X., Ren, S., & Sun, J. (2016) · 2016 IEEE Conference on Computer Vision and Pattern Recognition (CVPR) · doi:10.1109/cvpr.2016.90 · Cited by 235,474
Breiman, L. (2001) · Machine Learning · doi:10.1023/a:1010933404324 · Cited by 133,538
Adam: A Method for Stochastic Optimization
Kingma, D. P., & Ba, J. (2014) · arXiv · doi:10.48550/arxiv.1412.6980 · Cited by 98,946
Greedy function approximation: A gradient boosting machine
Friedman, J. H. (2001) · The Annals of Statistics · doi:10.1214/aos/1013203451 · Cited by 30,731
Batch Normalization: Accelerating Deep Network Training by Reducing Internal Covariate Shift
Ioffe, S., & Szegedy, C. (2015) · arXiv · doi:10.48550/arxiv.1502.03167 · Cited by 27,818
The Elements of Statistical Learning
Hastie, T., Tibshirani, R., & Friedman, J. (2009) · Springer Series in Statistics · doi:10.1007/978-0-387-84858-7 · Cited by 25,970
Common risk factors in the returns on stocks and bonds
Fama, E. F., & French, K. R. (1993) · Journal of Financial Economics · doi:10.1016/0304-405x(93)90023-5 · Cited by 25,754
Classification and Regression Trees.
Gordon, A. D., Breiman, L., Friedman, J. H., Olshen, R. A., & Stone, C. J. (1984) · Biometrics · doi:10.2307/2530946 · Cited by 23,522
Multilayer feedforward networks are universal approximators
Hornik, K., Stinchcombe, M., & White, H. (1989) · Neural Networks · doi:10.1016/0893-6080(89)90020-8 · Cited by 21,728
Regularization and Variable Selection Via the Elastic Net
Zou, H., & Hastie, T. (2005) · Journal of the Royal Statistical Society Series B: Statistical Methodology · doi:10.1111/j.1467-9868.2005.00503.x · Cited by 20,957
Research works printed but not linked: 2
- Goodfellow,, 2016, Deep learning
- Harvey,, 2016, Lucky factors
Cited by
Forecasting: theory and practice
Petropoulos, F., Apiletti, D., Assimakopoulos, V., Babai, M. Z., Barrow, D. K., Ben Taieb, S., Bergmeir, C., Bessa, R. J., Bijak, J., Boylan, J. E., et al. (2022) · International Journal of Forecasting · doi:10.1016/j.ijforecast.2021.11.001 · Cited by 921
Characteristics are covariances: A unified model of risk and return
Kelly, B. T., Pruitt, S., & Su, Y. (2019) · Journal of Financial Economics · doi:10.1016/j.jfineco.2019.05.001 · Cited by 809
Self-citationGoodell, J. W., Kumar, S., Lim, W. M., & Pattnaik, D. (2021) · Journal of Behavioral and Experimental Finance · doi:10.1016/j.jbef.2021.100577 · Cited by 715
Machine learning in the Chinese stock market
Leippold, M., Wang, Q., & Zhou, W. (2022) · Journal of Financial Economics · doi:10.1016/j.jfineco.2021.08.017 · Cited by 584
A Survey on Machine Learning Techniques for Cyber Security in the Last Decade
Shaukat, K., Luo, S., Varadharajan, V., Hameed, I. A., & Xu, M. (2020) · IEEE Access · doi:10.1109/access.2020.3041951 · Cited by 530
Metadata
- Authors
- Gu, S., Kelly, B., & Xiu, D.
- Affiliations
- University of Chicago (US)
- Yale University (US)
- Corresponding author
- Gu, Shihao
- Venue
- The Review of Financial Studies
- Publisher
- Oxford University Press (OUP)
- Published
- 2020-02-26
- Volume
- 33
- Issue
- 5
- Pages
- 2223-2273
- ISSN
- 0893-9454 (ISSN-L)
- 1465-7368
- OpenAlex
- W4205539948
- Cited by
- 2,545
- References
- 71
- Citations by year
- 2026: 684 · 2025: 554 · 2024: 411 · 2023: 329 · 2022: 228 · 2021: 189 · 2020: 102
- FWCI
- 220.00
- Type
- journal article
- Language
- en
- Open access
- hybrid
- doi.org
- Licence
- Locations
- Review of Financial Studies (publishedVersion, cc-by-nc-nd)
- RePEc: Research Papers in Economics (submittedVersion)
- Topics
- Social Sciences › Economics, Econometrics and Finance › Finance › Financial Markets and Investment Strategies
- Social Sciences › Decision Sciences › Management Science and Operations Research › Stock Market Forecasting Methods
- Social Sciences › Economics, Econometrics and Finance › Finance › Financial Risk and Volatility Modeling
- Keywords
- empirical asset pricing, machine learning, tree-based models, artificial neural networks, momentum, liquidity, volatility, predictive signals
About these checks
Registry, retraction, Cites and statistics results are computed, not judged, with one exception: a printed reference that no index lists is read once by a model before it counts as a citation error. Claims are extracted by a model and kept only when their quote appears verbatim in the text; each cited source is then checked, with a model’s help, for whether it says what the claim relies on. Those verdicts can be wrong — read the claim’s quote and the cited source before relying on one.
The claim verdicts this report counts are experimental: their accuracy is not yet measured.
A language model drew the claims from the paper on 2026-10-06, under version 3 of the claim definition (model deepseek-v4.1-flash, prompt extract-v3).
A second model labelled each claim on 2026-10-06 (model jev-1.13-20260917, definition revision gold-guideline-v0.2).
Cited sources are checked with a language model’s help (gpt-6-sol).
Statistics and arithmetic are recomputed, not judged.
Confidence bands are shown only for fields calibrated on our annotated test set. None is calibrated yet, so no band is shown.
What counts as a claim ›How we measure confidence ›How we check this ›
Are you an author, or do you see a problem with this page? Request a review
How to cite
Cite CoChat for the checks on this page, and the paper for its own findings.
- This page
- CoChat. (2026). Citation check: Empirical Asset Pricing via Machine Learning. https://app.cochat.ai/papers/10.1093/rfs/hhaa009
- The paper
- Gu, S., Kelly, B., & Xiu, D. (2020). Empirical Asset Pricing via Machine Learning. The Review of Financial Studies. https://doi.org/10.1093/rfs/hhaa009
Data sources
Bibliographic data: Semantic Scholar, OpenAlex, Crossref.
Contains information from the Semantic Scholar Academic Graph Datasets, made available under the ODC Attribution License (ODC-BY 1.0).
Semantic Scholar’s data is described in: Kinney, R., et al. (2023). The Semantic Scholar Open Data Platform. arXiv:2301.10140.
