Cited by 751

The DOI matches its Crossref record; 2 of the 2 references it cites were found in a registry or an index.

A 2018 Reference Guide to the Banff Classification of Renal Allograft Pathology

Roufosse, Candice, Simmonds, Naomi, Clahsen-van Groningen, Marian, Haas, Mark, Henriksen, Kammi J., Horsfield, Catherine, Loupy, Alexandre, Mengel, Michael, Perkowska-Ptasińska, Agnieszka, Rabant, Marion, Racusen, Lorraine C., Solez, Kim, Becker, Jan U.·2018·Transplantation

Abstract

The Banff Classification of Allograft Pathology is an international consensus classification for the reporting of biopsies from solid organ transplants. Since its initial conception in 1991 for renal transplants, it has undergone review every 2 years, with attendant updated publications. The rapid expansion of knowledge in the field has led to numerous revisions of the classification. The resultant dispersal of relevant content makes it difficult for novices and experienced pathologists to faithfully apply the classification in routine diagnostic work and in clinical trials. This review shall provide a complete and simple illustrated reference guide of the Banff Classification of Kidney Allograft Pathology based on all publications including the 2017 update. It is intended as a concise desktop reference for pathologists and clinicians, providing definitions, Banff Lesion Scores and Banff Diagnostic Categories. An online website reference guide hosted by the Banff Foundation for Allograft Pathology (www.banfffoundation.org) is being developed, which will be updated with future refinement of the Banff Classification from 2019 onward.

Overview

The claims and statistics of this paper haven’t been checked yet.

Run the check — free, no account needed. It reads the open-access text and checks the sources it cites.

A few free checks a day · papers already verified open instantly · results are public

Integrity signals

Registry

Crossref · 10.1097/tp.0000000000002366

Cites

2 of 2 references verified0 citation errors · 0 not checkable

Statistics

Figures

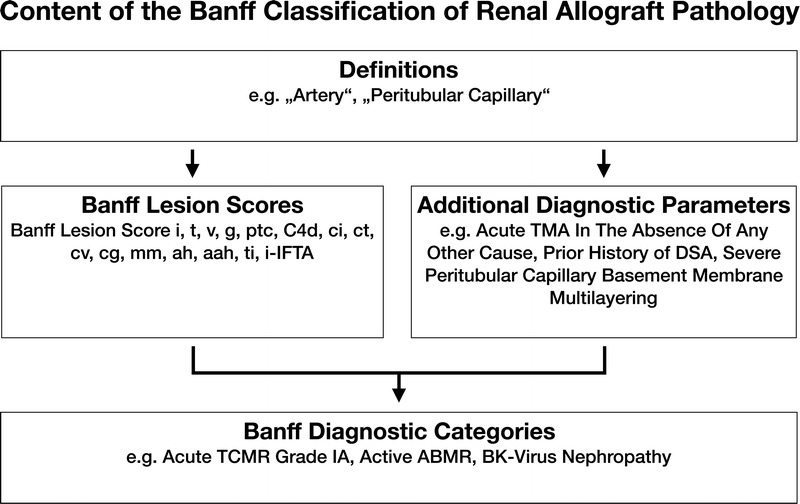
FIGURE 1 The content of the Banff Classification of Kidney Allograft Pathology can be inventoried as Banff Lesion Scores and Additional Diagnostic Parameters required by the algorithms behind the Banff Diagnostic Categories to reach a diagnosis. Moreover, overarching definitions are important and inform, for example, how one or even several Banff Lesion Scores are applied. TMA, thrombotic microangiopathy.
FIGURE 1 The content of the Banff Classification of Kidney Allograft Pathology can be inventoried as Banff Lesion Scores and Additional Diagnostic Parameters required by the algorithms behind the Banff Diagnostic Categories to reach a diagnosis. Moreover, overarching definitions are important and inform, for example, how one or even several Banff Lesion Scores are applied. TMA, thrombotic microangiopathy.CC BY · PubMed Central
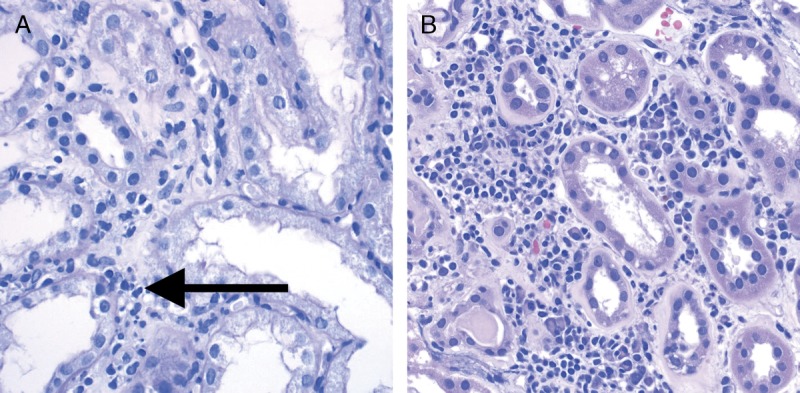
FIGURE 2 Banff Lesion Score i (interstitial Inflammation in nonscarred areas of the cortex). A, Interstitial inflammation in nonscarred areas of the cortex. This Banff Lesion Score, often a marker of TCMR, ranges from 0 to 3, based on the percentage of nonscarred cortex involved, and is usually dominated by mononuclear cells in the case of Acute TCMR. Note the contrast between the noninfiltrated interstitium in the right half of the micrograph and the infiltrate in the edema between the tubules on the left (long arrow). PAS, original magnification, ×400. B, An example of plasma cell rich interstitial inflammation. If the infiltrate comprises more than 5% to 10% of either eosinophils, neutrophils or plasma cells an asterisk is added to the Banff Lesion Score i (eg, i1*). H&E, hematoxylin and eosin, original magnification, ×400.
FIGURE 2 Banff Lesion Score i (interstitial Inflammation in nonscarred areas of the cortex). A, Interstitial inflammation in nonscarred areas of the cortex. This Banff Lesion Score, often a marker of TCMR, ranges from 0 to 3, based on the percentage of nonscarred cortex involved, and is usually dominated by mononuclear cells in the case of Acute TCMR. Note the contrast between the noninfiltrated interstitium in the right half of the micrograph and the infiltrate in the edema between the tubules on the left (long arrow). PAS, original magnification, ×400. B, An example of plasma cell rich interstitial inflammation. If the infiltrate comprises more than 5% to 10% of either eosinophils, neutrophils or plasma cells an asterisk is added to the Banff Lesion Score i (eg, i1*). H&E, hematoxylin and eosin, original magnification, ×400.CC BY · PubMed Central
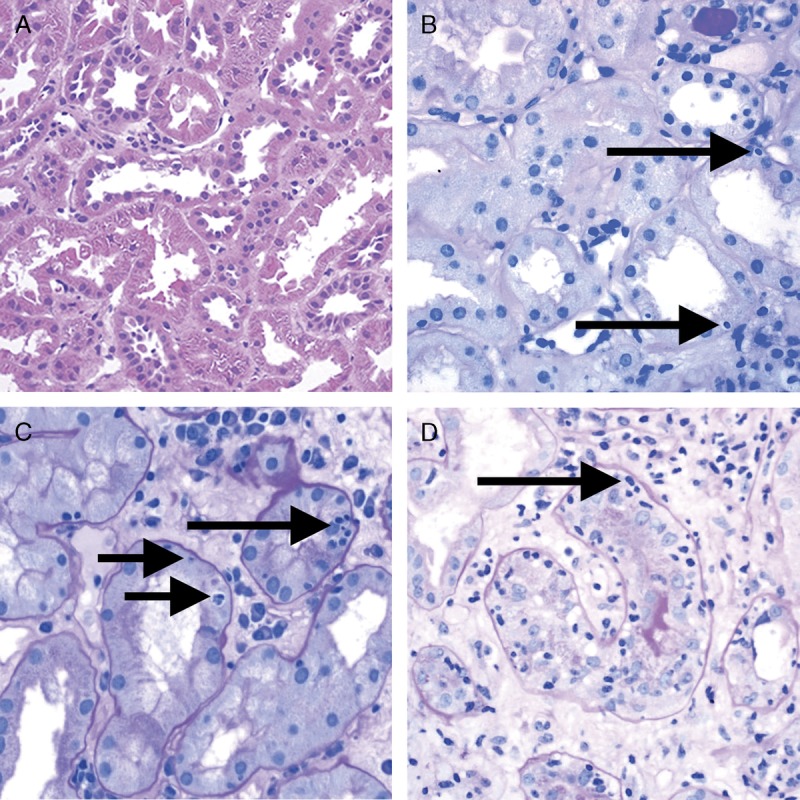
FIGURE 3 Banff Lesion Score t (tubulitis) in nonatrophic or mildly atrophic tubules. These images display various degrees of tubulitis which is characterized by the presence of mononuclear cells on the basolateral aspect of the tubular epithelial cells, within the confines of the basement membrane. Mononuclear cells (long and short arrows) are noticeable by their characteristic halo and smaller nucleus and more condensed chromatin compared to tubular epithelial cells. A, Banff Lesion Score t0—Cortical tubules without tubulitis which would be scored as t0. H&E, original magnification, ×200. B, Banff Lesion Score t1—defined as foci of 1-4 mononuclear cells (arrows) per tubular cross section or per 10 tubular epithelial cells. PAS, original magnification, ×400. C, Banff Lesion Score t2—defined as 5 to 10 mononuclear cells per tubular cross section or per 10 epithelial cells (long arrows). Note that the tubule to the left displays mild tubulitis (short arrows), but the most severely affected tubule dictates the score. PAS, original magnification, ×400. D, Banff Lesion Score t3—defined as foci with >10 mononuclear cells/tubular cross section. Note that for this particular tubule the denominator is per 10 tubular epithelial cells as this tubule is sectioned longitudinally. PAS, original magnification, ×400.
FIGURE 3 Banff Lesion Score t (tubulitis) in nonatrophic or mildly atrophic tubules. These images display various degrees of tubulitis which is characterized by the presence of mononuclear cells on the basolateral aspect of the tubular epithelial cells, within the confines of the basement membrane. Mononuclear cells (long and short arrows) are noticeable by their characteristic halo and smaller nucleus and more condensed chromatin compared to tubular epithelial cells. A, Banff Lesion Score t0—Cortical tubules without tubulitis which would be scored as t0. H&E, original magnification, ×200. B, Banff Lesion Score t1—defined as foci of 1-4 mononuclear cells (arrows) per tubular cross section or per 10 tubular epithelial cells. PAS, original magnification, ×400. C, Banff Lesion Score t2—defined as 5 to 10 mononuclear cells per tubular cross section or per 10 epithelial cells (long arrows). Note that the tubule to the left displays mild tubulitis (short arrows), but the most severely affected tubule dictates the score. PAS, original magnification, ×400. D, Banff Lesion Score t3—defined as foci with >10 mononuclear cells/tubular cross section. Note that for this particular tubule the denominator is per 10 tubular epithelial cells as this tubule is sectioned longitudinally. PAS, original magnification, ×400.CC BY · PubMed Central
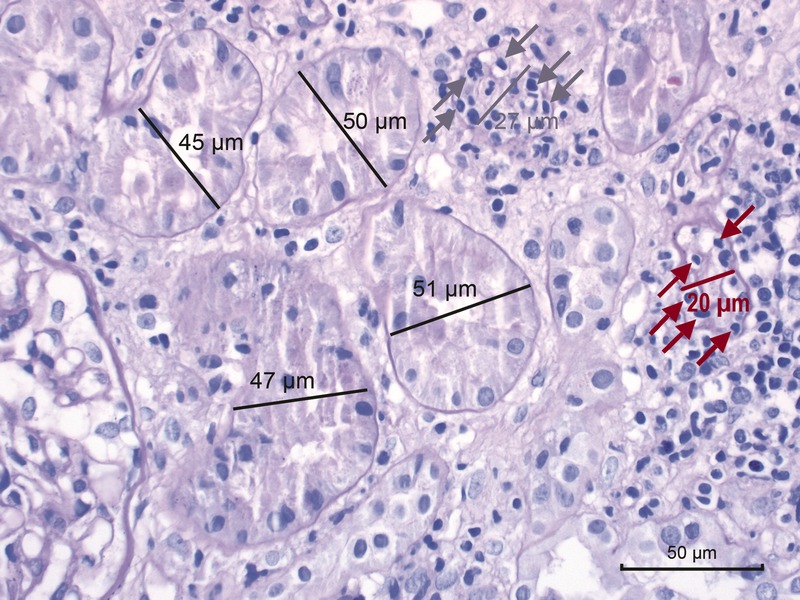
FIGURE 4 Banff Lesion Score t (tubulitis) in moderately atrophic tubules. In biopsies with Banff Lesion Scores i, ti and i-IFTA sufficient for a diagnosis of acute TCMR grade IA, IB or chronic active TCMR grade IA and IB, Banff Lesion Score t must also be scored in moderately atrophic cortical tubules. Moderately atrophic tubules are defined as having less than 50% down to 25% of the diameter of the surrounding “unaffected or minimally affected [cortical] tubules in the biopsy”.12 This example shows such unaffected or minimally affected tubules with their diameter marked in black. Their mean diameter in this image would be around 48 μm. The tubule with the diameter marked in gray has a diameter of 27 μm which is more than 50% of 48 μm. Thus, this tubule would still qualify as mildly atrophic. It is heavily infiltrated with mononuclear cells (gray arrows). In contrast, the tubule with the diameter of 20 μm marked in red is moderately atrophic. The mononuclear tubulitis in this particular tubule must be scored toward Banff Lesion Score t in this biopsy which was diagnosed as Acute TCMR Grade IB. PAS, original magnification, ×400.
FIGURE 4 Banff Lesion Score t (tubulitis) in moderately atrophic tubules. In biopsies with Banff Lesion Scores i, ti and i-IFTA sufficient for a diagnosis of acute TCMR grade IA, IB or chronic active TCMR grade IA and IB, Banff Lesion Score t must also be scored in moderately atrophic cortical tubules. Moderately atrophic tubules are defined as having less than 50% down to 25% of the diameter of the surrounding “unaffected or minimally affected [cortical] tubules in the biopsy”.12 This example shows such unaffected or minimally affected tubules with their diameter marked in black. Their mean diameter in this image would be around 48 μm. The tubule with the diameter marked in gray has a diameter of 27 μm which is more than 50% of 48 μm. Thus, this tubule would still qualify as mildly atrophic. It is heavily infiltrated with mononuclear cells (gray arrows). In contrast, the tubule with the diameter of 20 μm marked in red is moderately atrophic. The mononuclear tubulitis in this particular tubule must be scored toward Banff Lesion Score t in this biopsy which was diagnosed as Acute TCMR Grade IB. PAS, original magnification, ×400.CC BY · PubMed Central
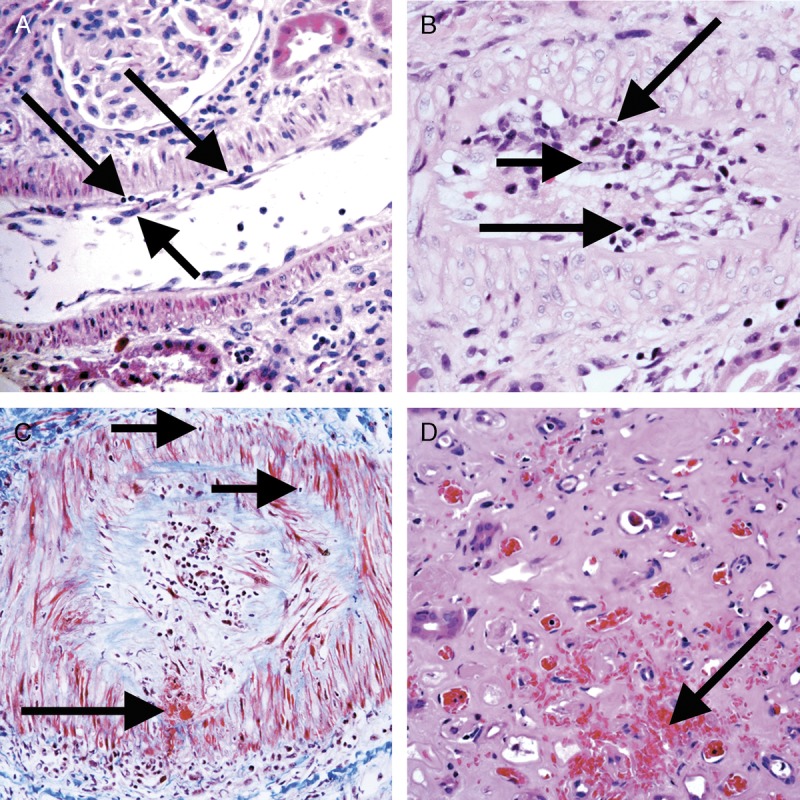
FIGURE 5 Banff Lesion Score v (intimal arteritis). These photomicrographs demonstrate intimal arteritis, characterized by the presence of inflammatory cells beneath the lining endothelial cells. A, Banff Lesion Score v1—mild to moderate arteritis with mononuclear cells (long arrows) immediately beneath lifted endothelial cells (short arrow). H&E, original magnification, ×200. B, Banff Lesion Score v2—severe intimal arteritis involving over 25% of the arterial lumen with mononuclear cells (long arrows) immediately beneath lifted endothelial cells (short arrow). H&E, original magnification, ×200; C, Banff Lesion Score v3 -Transmural arteritis with fibrinoid necrosis in the media (long arrow) and mononuclear infiltrate in the arterial wall (short arrows). Intimal arteritis can be seen in both Acute TCMR Grade II and III and Active AMR. The most severely affected artery determines the score. Masson trichrome, original magnification, ×100. D, This image demonstrates an area of interstitial hemorrhage characterized by extravasation of red blood cells into the surrounding interstitium (arrow). Although there is not a specific Banff Lesion Score for this feature, it can be recorded by attaching an asterisk to the v score (eg, v*). Note that this asterisk attached to Banff Lesion Score v is not specific for interstitial hemorrhage as an area of cortical infarct (not shown) would also be coded like this. H&E, original magnification, ×400.
FIGURE 5 Banff Lesion Score v (intimal arteritis). These photomicrographs demonstrate intimal arteritis, characterized by the presence of inflammatory cells beneath the lining endothelial cells. A, Banff Lesion Score v1—mild to moderate arteritis with mononuclear cells (long arrows) immediately beneath lifted endothelial cells (short arrow). H&E, original magnification, ×200. B, Banff Lesion Score v2—severe intimal arteritis involving over 25% of the arterial lumen with mononuclear cells (long arrows) immediately beneath lifted endothelial cells (short arrow). H&E, original magnification, ×200; C, Banff Lesion Score v3 -Transmural arteritis with fibrinoid necrosis in the media (long arrow) and mononuclear infiltrate in the arterial wall (short arrows). Intimal arteritis can be seen in both Acute TCMR Grade II and III and Active AMR. The most severely affected artery determines the score. Masson trichrome, original magnification, ×100. D, This image demonstrates an area of interstitial hemorrhage characterized by extravasation of red blood cells into the surrounding interstitium (arrow). Although there is not a specific Banff Lesion Score for this feature, it can be recorded by attaching an asterisk to the v score (eg, v*). Note that this asterisk attached to Banff Lesion Score v is not specific for interstitial hemorrhage as an area of cortical infarct (not shown) would also be coded like this. H&E, original magnification, ×400.CC BY · PubMed Central
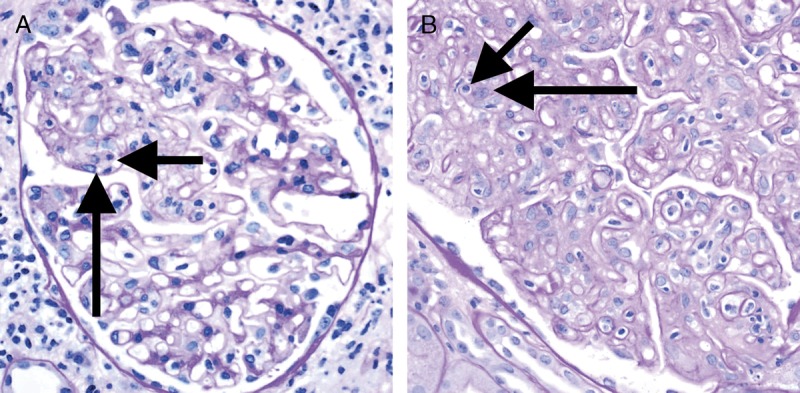
FIGURE 6 Banff Lesion Score g (glomerulitis). Glomerulitis is a form of MVI and a feature of AMR activity. A, Segmental glomerulitis; PAS, original magnification, ×400. B, Global glomerulitis. Note the characteristic complete or partial occlusion of capillary loops by leukocytes (short arrows) and endothelial cell swelling (long arrows). The score of g0 to g3 is determined by the percentage of glomeruli involved with either segmental or global glomerulitis. Complete or partial occlusion of a single capillary loop suffices to mark the respective glomerulus as involved by the glomerulitis. PAS, original magnification, ×400.
FIGURE 6 Banff Lesion Score g (glomerulitis). Glomerulitis is a form of MVI and a feature of AMR activity. A, Segmental glomerulitis; PAS, original magnification, ×400. B, Global glomerulitis. Note the characteristic complete or partial occlusion of capillary loops by leukocytes (short arrows) and endothelial cell swelling (long arrows). The score of g0 to g3 is determined by the percentage of glomeruli involved with either segmental or global glomerulitis. Complete or partial occlusion of a single capillary loop suffices to mark the respective glomerulus as involved by the glomerulitis. PAS, original magnification, ×400.CC BY · PubMed Central
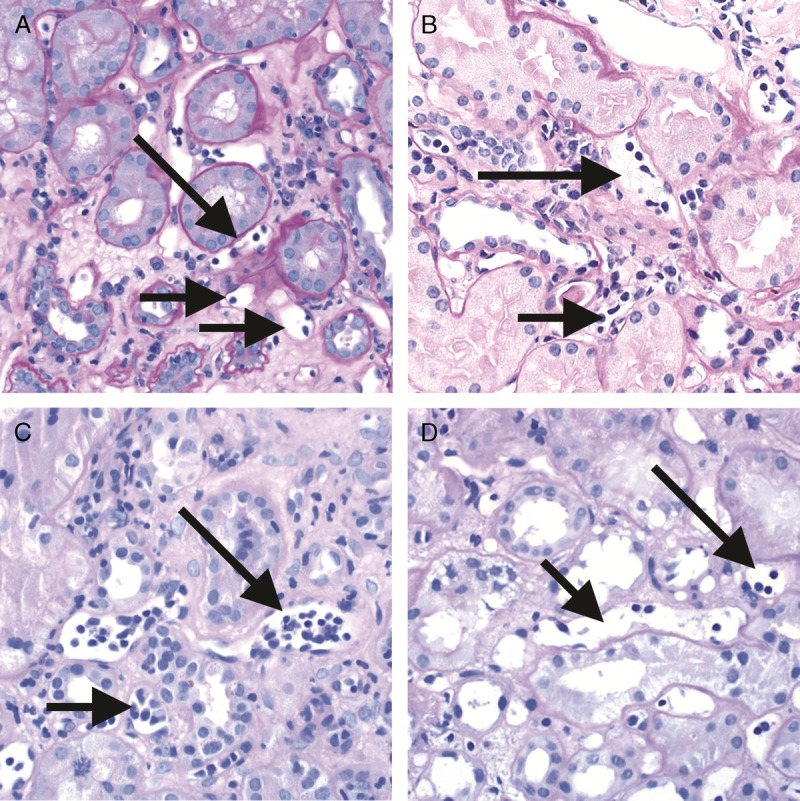
FIGURE 7 Banff Lesion Score ptc (peritubular capillaritis). Peritubular capillaritis is a form of MVI and a feature of AMR activity. Each image demonstrates the various ptc scores which are in themselves determined by the number of inflammatory cells present within capillary lumina. A, Banff Lesion Score ptc1—Mild peritubular capillaritis defined as at least 1 cell in ≥10% of cortical PTCs (short arrows) with 3 to 4 in the most severely involved PTC (long arrow). Please note the slightly distended, open appearance of the capillary which can be a helpful feature; PAS, original magnification, ×400. B, Banff Lesion Score ptc2—Moderate peritubular capillaritis defined as at least 1 cell in ≥10% of cortical PTCs (short arrows) with 5-10 in most severely involved PTC (long arrow); PAS, original magnification, ×400. C, Banff Lesion Score ptc3—severe peritubular capillaritis defined as at least 1 cell in ≥10% of cortical PTCs (short arrows) with >10 in most severely involved PTC (long arrow). PAS, original magnification, ×400. D, This peritubular capillary is cut longitudinally (short arrow) and although containing 4 mononuclear cells is to be disregarded for scoring. However, the neighboring peritubular capillary (long arrow) is cut orthogonally and would qualify for Banff Lesion Score ptc1 provided that at least 10% of all PTCs contain at least 1 leukocyte. PAS, original magnification, ×400.
FIGURE 7 Banff Lesion Score ptc (peritubular capillaritis). Peritubular capillaritis is a form of MVI and a feature of AMR activity. Each image demonstrates the various ptc scores which are in themselves determined by the number of inflammatory cells present within capillary lumina. A, Banff Lesion Score ptc1—Mild peritubular capillaritis defined as at least 1 cell in ≥10% of cortical PTCs (short arrows) with 3 to 4 in the most severely involved PTC (long arrow). Please note the slightly distended, open appearance of the capillary which can be a helpful feature; PAS, original magnification, ×400. B, Banff Lesion Score ptc2—Moderate peritubular capillaritis defined as at least 1 cell in ≥10% of cortical PTCs (short arrows) with 5-10 in most severely involved PTC (long arrow); PAS, original magnification, ×400. C, Banff Lesion Score ptc3—severe peritubular capillaritis defined as at least 1 cell in ≥10% of cortical PTCs (short arrows) with >10 in most severely involved PTC (long arrow). PAS, original magnification, ×400. D, This peritubular capillary is cut longitudinally (short arrow) and although containing 4 mononuclear cells is to be disregarded for scoring. However, the neighboring peritubular capillary (long arrow) is cut orthogonally and would qualify for Banff Lesion Score ptc1 provided that at least 10% of all PTCs contain at least 1 leukocyte. PAS, original magnification, ×400.CC BY · PubMed Central
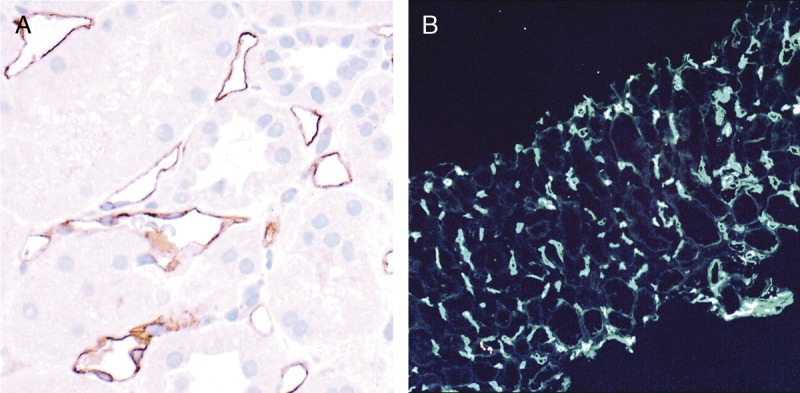
FIGURE 8 Banff Lesion Score C4d. A, IHC staining with peroxidase yielding a brown reaction product for C4d. An example of C4d3, this image demonstrates linear and circumferential staining of endothelial cells in virtually all peritubular capillaries. The staining was similar in all areas of the cortex and the medulla. The proportion of stained peritubular capillaries and medullary vasa recta informs the score. B, IF staining for C4d. This image shows an example of a Banff Lesion Score of C4d3; using IF, a minimum score of C4d ≥ 2 is considered positive. In addition to this, the staining intensity for an individual capillary or medullary vas rectum must be at least 1+ on the usual scale from negative, trace, 1+, 2+ to 3+. Indirect IF, mouse antihuman C4d followed by fluorescein isothiocyanate-conjugated antimouse IgG, original magnification, ×100.
FIGURE 8 Banff Lesion Score C4d. A, IHC staining with peroxidase yielding a brown reaction product for C4d. An example of C4d3, this image demonstrates linear and circumferential staining of endothelial cells in virtually all peritubular capillaries. The staining was similar in all areas of the cortex and the medulla. The proportion of stained peritubular capillaries and medullary vasa recta informs the score. B, IF staining for C4d. This image shows an example of a Banff Lesion Score of C4d3; using IF, a minimum score of C4d ≥ 2 is considered positive. In addition to this, the staining intensity for an individual capillary or medullary vas rectum must be at least 1+ on the usual scale from negative, trace, 1+, 2+ to 3+. Indirect IF, mouse antihuman C4d followed by fluorescein isothiocyanate-conjugated antimouse IgG, original magnification, ×100.CC BY · PubMed Central
FIGURE 9 Banff Lesion Scores for ct (tubular atrophy) and ci (interstitial fibrosis). The ci and ct scores are both based on calculating the total percentage of cortex involved and require a diligent assessment of all foci of ct and ci as this process is often multifocal; ct and ci scores may not always be equally advanced. A, This image demonstrates an area of nonatrophic tubules (long arrow), compared to an area of tubular atrophy (short arrow) without an obvious increase in interstitial fibrosis. PAS, original magnification, ×200. There are different morphological types of tubular atrophy with differing histological appearances, including conventional, thyroidization, and endocrine-like types. B, Tubular atrophy of conventional type with interstitial fibrosis. Tubular areas are separated by areas of interstitial fibrosis and tubules show thickened basement membranes and > 50% reduction in tubular diameter (long arrows). PAS, original magnification ×200. C, Thyroidization type atrophy. Here, tubules appear dilated, have flattened epithelial cells, and contain eosinophilic and brightly periodic-acid-Schiff-positive uromodulin casts (long arrow). PAS, original magnification, ×200. D, endocrine-like type, characterized by shrunken tubules with cuboidal epithelium and “tubular simplification” (long arrow). Compared with the other types of tubular atrophy, endocrine-like type does not have thickened basement membranes but still counts toward the ct score. PAS, original magnification, ×400.
FIGURE 9 Banff Lesion Scores for ct (tubular atrophy) and ci (interstitial fibrosis). The ci and ct scores are both based on calculating the total percentage of cortex involved and require a diligent assessment of all foci of ct and ci as this process is often multifocal; ct and ci scores may not always be equally advanced. A, This image demonstrates an area of nonatrophic tubules (long arrow), compared to an area of tubular atrophy (short arrow) without an obvious increase in interstitial fibrosis. PAS, original magnification, ×200. There are different morphological types of tubular atrophy with differing histological appearances, including conventional, thyroidization, and endocrine-like types. B, Tubular atrophy of conventional type with interstitial fibrosis. Tubular areas are separated by areas of interstitial fibrosis and tubules show thickened basement membranes and > 50% reduction in tubular diameter (long arrows). PAS, original magnification ×200. C, Thyroidization type atrophy. Here, tubules appear dilated, have flattened epithelial cells, and contain eosinophilic and brightly periodic-acid-Schiff-positive uromodulin casts (long arrow). PAS, original magnification, ×200. D, endocrine-like type, characterized by shrunken tubules with cuboidal epithelium and “tubular simplification” (long arrow). Compared with the other types of tubular atrophy, endocrine-like type does not have thickened basement membranes but still counts toward the ct score. PAS, original magnification, ×400.CC BY · PubMed Central
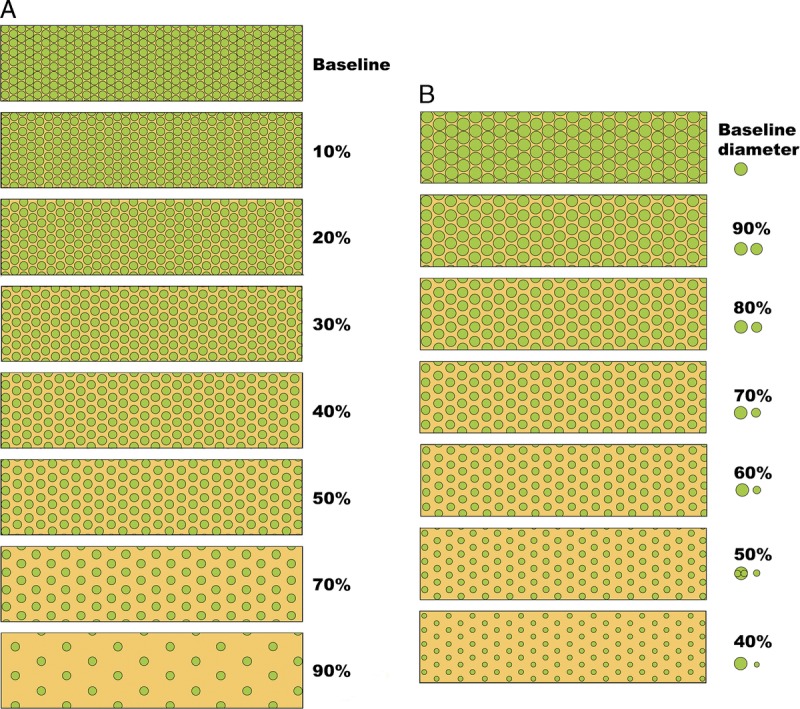
FIGURE 10 Visual analogue scales provided by the Banff Working Group on Fibrosis. This working group developed schematic diagrams to facilitate and standardize scoring of Banff Lesion Scores ci and ct. A, Scale for the assessment of interstitial fibrosis without tubular atrophy. B, Scale for the assessment of diffuse tubular atrophy with “replacement fibrosis.”16 Reproduced with kind permission from American Journal of Transplantation.
FIGURE 10 Visual analogue scales provided by the Banff Working Group on Fibrosis. This working group developed schematic diagrams to facilitate and standardize scoring of Banff Lesion Scores ci and ct. A, Scale for the assessment of interstitial fibrosis without tubular atrophy. B, Scale for the assessment of diffuse tubular atrophy with “replacement fibrosis.”16 Reproduced with kind permission from American Journal of Transplantation.CC BY · PubMed Central
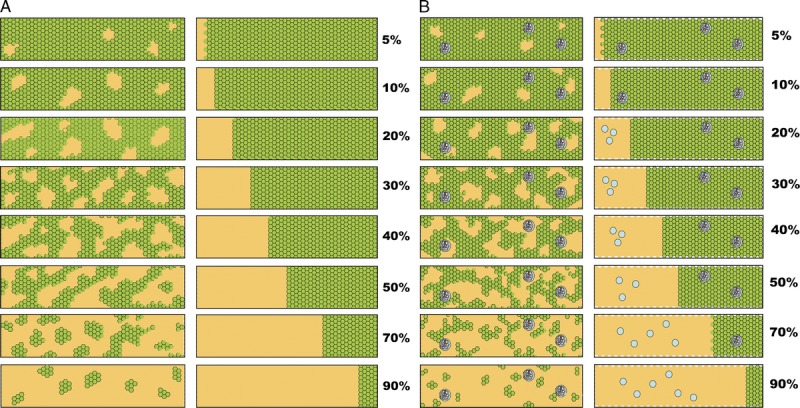
FIGURE 11 More visual analogue scales provided by the Banff Working Group on Fibrosis.17 A, Scale for the assessment of patchy (left) and confluent (right) interstitial fibrosis without glomeruli. B, Scale for patchy (left) and confluent (right) fibrosis with glomeruli.16 Reproduced with kind permission from American Journal of Transplantation.
FIGURE 11 More visual analogue scales provided by the Banff Working Group on Fibrosis.17 A, Scale for the assessment of patchy (left) and confluent (right) interstitial fibrosis without glomeruli. B, Scale for patchy (left) and confluent (right) fibrosis with glomeruli.16 Reproduced with kind permission from American Journal of Transplantation.CC BY · PubMed Central
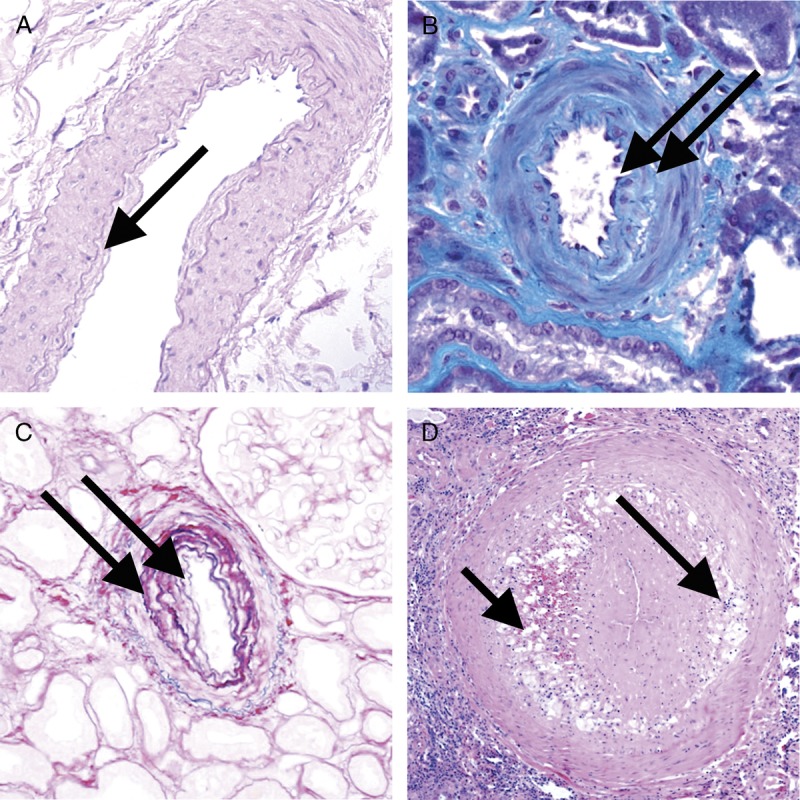
FIGURE 12 Banff Lesion Score cv (vascular fibrous intimal thickening). A, Banff Lesion Score cv1—very mild purely fibrous thickening of the arterial intima (arrow). PAS, original magnification, ×200. B, Purely fibrous intimal thickening is depicted here in between the arrows in a trichrome stain. Note that this type of fibrous intimal thickening can also represent chronic damage in AMR. Masson trichrome, original magnification ×400. C, Arterial fibrous intimal thickening in between the arrows. Note the multiplication of the internal elastic lamina. Trichrome-elastica, original magnification, ×400. D, Severe fibrointimal thickening cv3, with mononuclear infiltrates (long arrow) and foam cells (short arrow) in the fibrotic intima which can be a feature of both Chronic Active TCMR and Chronic Active AMR. Both types of lesion qualify for Banff Lesion Score cv, the score is determined by the loss of luminal area as shown in Figure 13 below. H&E, original magnification, ×100.
FIGURE 12 Banff Lesion Score cv (vascular fibrous intimal thickening). A, Banff Lesion Score cv1—very mild purely fibrous thickening of the arterial intima (arrow). PAS, original magnification, ×200. B, Purely fibrous intimal thickening is depicted here in between the arrows in a trichrome stain. Note that this type of fibrous intimal thickening can also represent chronic damage in AMR. Masson trichrome, original magnification ×400. C, Arterial fibrous intimal thickening in between the arrows. Note the multiplication of the internal elastic lamina. Trichrome-elastica, original magnification, ×400. D, Severe fibrointimal thickening cv3, with mononuclear infiltrates (long arrow) and foam cells (short arrow) in the fibrotic intima which can be a feature of both Chronic Active TCMR and Chronic Active AMR. Both types of lesion qualify for Banff Lesion Score cv, the score is determined by the loss of luminal area as shown in Figure 13 below. H&E, original magnification, ×100.CC BY · PubMed Central
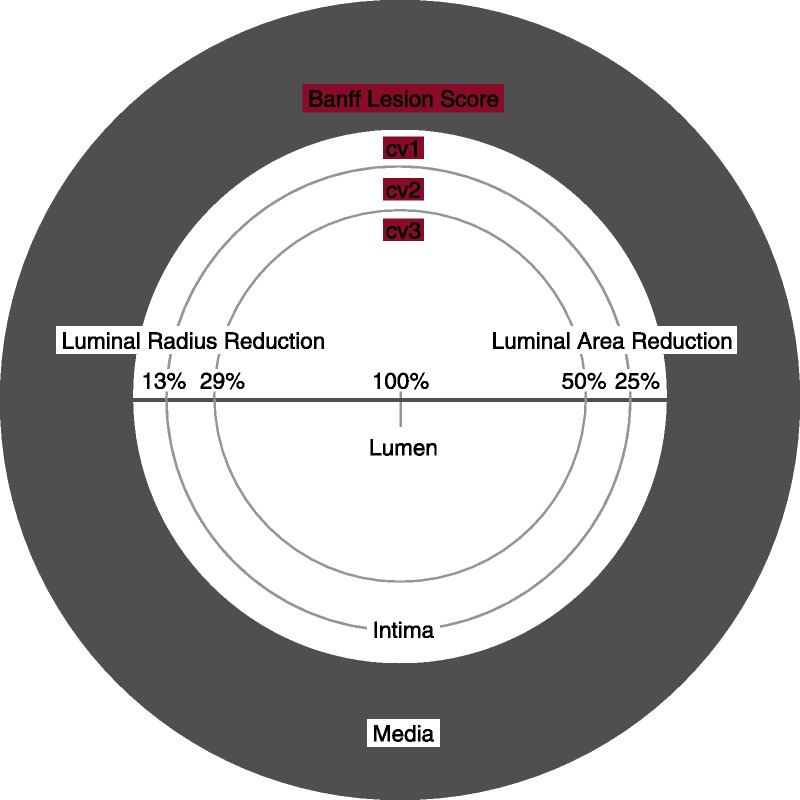
FIGURE 13 Visual analogue scale for the determination of Banff Lesion Score cv (arterial fibrous intimal thickening). The remaining luminal area is related to the square of the remaining luminal radius. Thus, relatively modest decreases in luminal radius of 13% or 29% translate into relatively large reductions in luminal area of 25% or 50%, reflecting the thresholds for Banff Lesion Score cv.
FIGURE 13 Visual analogue scale for the determination of Banff Lesion Score cv (arterial fibrous intimal thickening). The remaining luminal area is related to the square of the remaining luminal radius. Thus, relatively modest decreases in luminal radius of 13% or 29% translate into relatively large reductions in luminal area of 25% or 50%, reflecting the thresholds for Banff Lesion Score cv.CC BY · PubMed Central
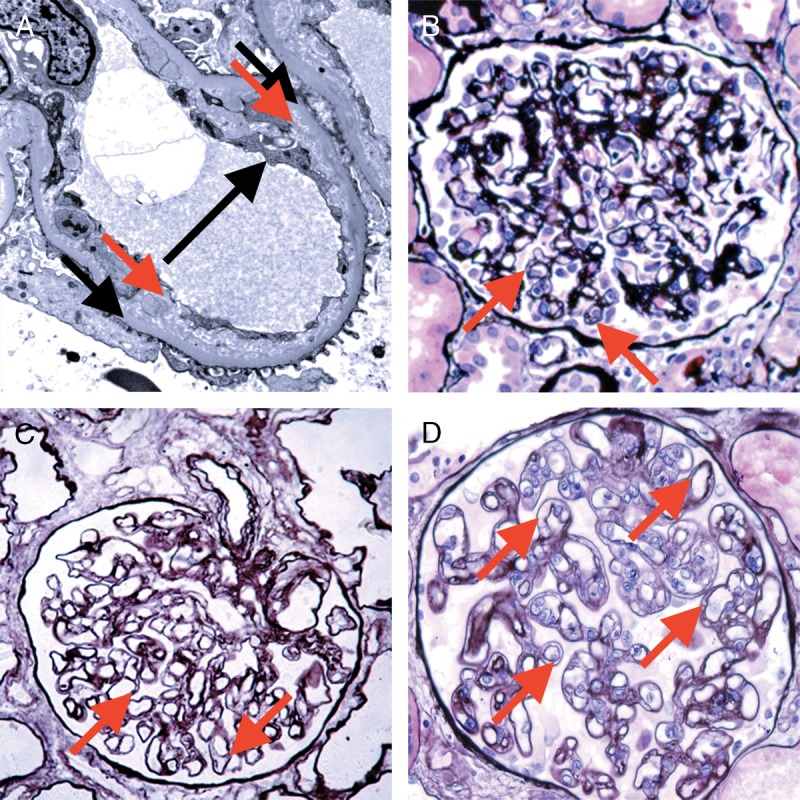
FIGURE 14 Banff Lesion Score cg (GBM double contours). This score represents the presence and extent of GBM double contours, a criterion for Chronic Active AMR. The score ranges from 0 to 3 and is based on the percentage of capillary loops with double contours as evident on EM (Banff Lesion Score cg1a) or LM (cg1b to cg3) in the most severely affected glomerulus. A, cg1a—GBM with double contours (short black arrows point to areas of original basement membrane and red arrows point to areas of new basement membrane formation), visible by EM only. Double contours, such as those noted in this image must be accompanied by endothelial cell swelling (long black arrow) and/or subendothelial rarefaction, and must involve at least 3 glomerular capillaries by EM for a score of cg1a. Scores of greater than cg1a are based on light microscopic appearance which can best be examined by silver stains. Transmission EM, original magnification ×8000. B, Banff Lesion Score cg1b—double contours (arrow) identified on LM which involve up to 25% of the capillary loops of this most affected glomerulus. Jones silver stain, original magnification, ×400. C, Banff Lesion Score cg2—double contours (arrows) present in 26-50% of this most affected glomerulus; Jones silver stain, original magnification, ×400. D, Banff Lesion Score cg3—double contours (arrows) present in >50% of this most affected glomerulus. Jones silver stain, original magnification, ×400.
FIGURE 14 Banff Lesion Score cg (GBM double contours). This score represents the presence and extent of GBM double contours, a criterion for Chronic Active AMR. The score ranges from 0 to 3 and is based on the percentage of capillary loops with double contours as evident on EM (Banff Lesion Score cg1a) or LM (cg1b to cg3) in the most severely affected glomerulus. A, cg1a—GBM with double contours (short black arrows point to areas of original basement membrane and red arrows point to areas of new basement membrane formation), visible by EM only. Double contours, such as those noted in this image must be accompanied by endothelial cell swelling (long black arrow) and/or subendothelial rarefaction, and must involve at least 3 glomerular capillaries by EM for a score of cg1a. Scores of greater than cg1a are based on light microscopic appearance which can best be examined by silver stains. Transmission EM, original magnification ×8000. B, Banff Lesion Score cg1b—double contours (arrow) identified on LM which involve up to 25% of the capillary loops of this most affected glomerulus. Jones silver stain, original magnification, ×400. C, Banff Lesion Score cg2—double contours (arrows) present in 26-50% of this most affected glomerulus; Jones silver stain, original magnification, ×400. D, Banff Lesion Score cg3—double contours (arrows) present in >50% of this most affected glomerulus. Jones silver stain, original magnification, ×400.CC BY · PubMed Central
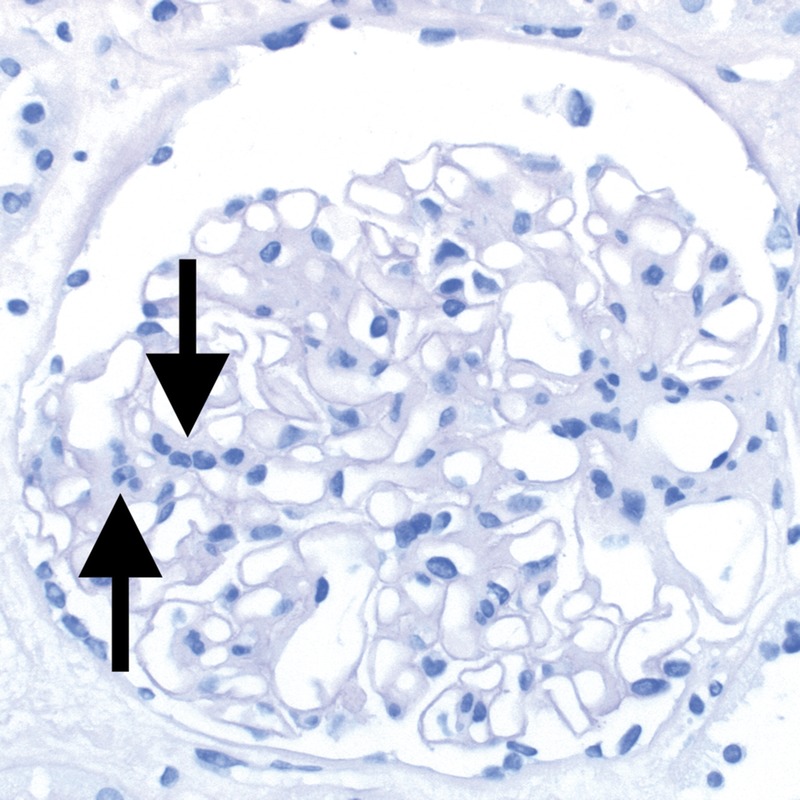
FIGURE 15 Banff Lesion Score mm (mesangial matrix expansion). This glomerulus fulfils the criteria for moderate mesangial matrix expansion with more than 2 mesangial cells in these 2 adjacent glomerular lobules (arrows). The proportion of glomeruli with such mesangial matrix expansion among all nonsclerosed glomeruli informs the score. The underlying reason for the mesangial matrix expansion in this biopsy was recurrent IgA glomerulonephritis revealed by IHC and EM. PAS, original magnification, ×400.
FIGURE 15 Banff Lesion Score mm (mesangial matrix expansion). This glomerulus fulfils the criteria for moderate mesangial matrix expansion with more than 2 mesangial cells in these 2 adjacent glomerular lobules (arrows). The proportion of glomeruli with such mesangial matrix expansion among all nonsclerosed glomeruli informs the score. The underlying reason for the mesangial matrix expansion in this biopsy was recurrent IgA glomerulonephritis revealed by IHC and EM. PAS, original magnification, ×400.CC BY · PubMed Central
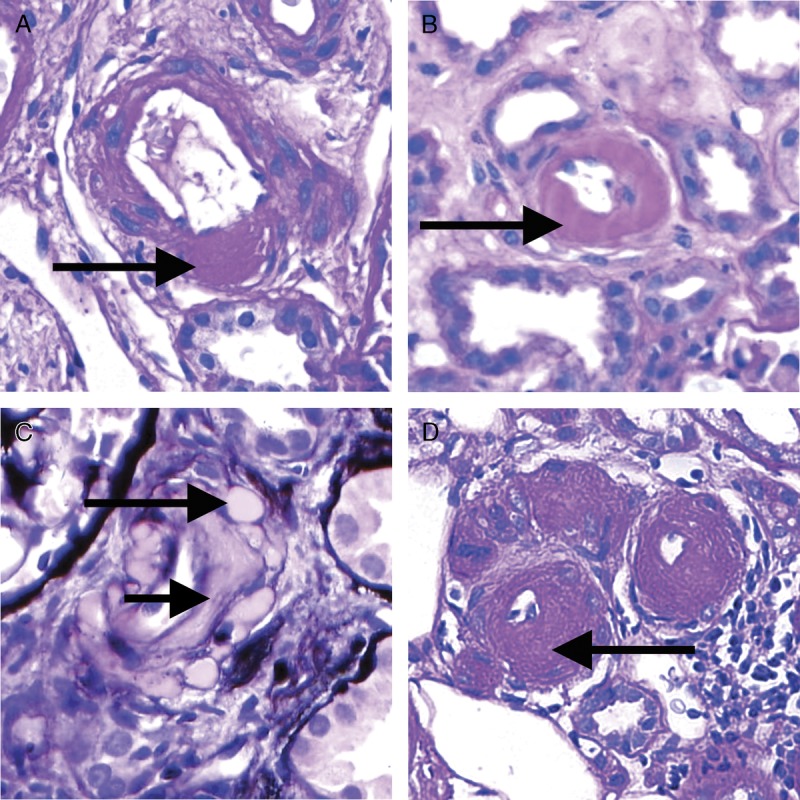
FIGURE 16 Banff Lesion Score ah (arteriolar hyalinosis). A, Banff Lesion Score ah1—mild focal arteriolar hyalinosis (arrow). PAS, original magnification, ×630. B, ah2—Moderate arteriolar hyalinosis (arrow). PAS, original magnification, ×630. C, Banff Lesion Score ah2—Note in this image there is both linear (short arrow) and nodular hyalinosis (long arrow). For a score of ah2, more than 1 arteriole displaying moderate to severe is required. Jones silver stain, original magnification ×630. D, Banff Lesion Score ah3—severe circumferential arteriolar hyalinosis with luminal occlusion. For Banff Lesion Score ah3, hyalinosis of this severity (arrow) must be present in many arterioles as depicted here. PAS, original magnification, ×630.
FIGURE 16 Banff Lesion Score ah (arteriolar hyalinosis). A, Banff Lesion Score ah1—mild focal arteriolar hyalinosis (arrow). PAS, original magnification, ×630. B, ah2—Moderate arteriolar hyalinosis (arrow). PAS, original magnification, ×630. C, Banff Lesion Score ah2—Note in this image there is both linear (short arrow) and nodular hyalinosis (long arrow). For a score of ah2, more than 1 arteriole displaying moderate to severe is required. Jones silver stain, original magnification ×630. D, Banff Lesion Score ah3—severe circumferential arteriolar hyalinosis with luminal occlusion. For Banff Lesion Score ah3, hyalinosis of this severity (arrow) must be present in many arterioles as depicted here. PAS, original magnification, ×630.CC BY · PubMed Central
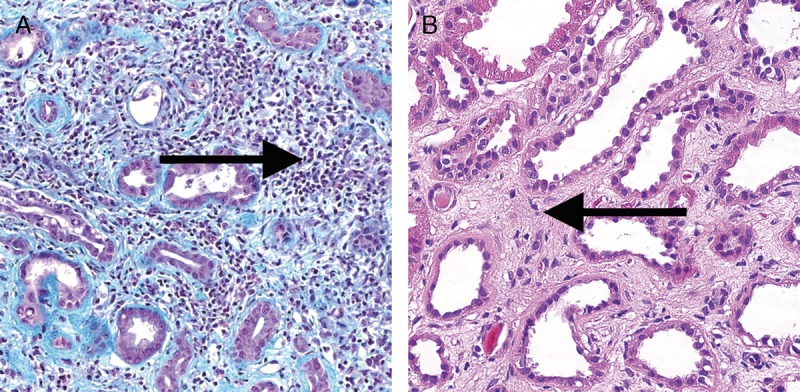
FIGURE 17 Banff Lesions Score i-IFTA (Inflammation in areas of IFTA). Image A shows Inflammation in areas of IFTA (arrow). This lesion score ranges from 0 to 3, based on the percentage of scarred areas of the cortex (ie, areas qualifying for ci and ct) involved by inflammation. It is one of the criteria necessary for a diagnosis of chronic active TCMR Grade IA or IB. Masson trichrome, original magnification ×200. B, In contrast shows interstitial fibrosis without significant infiltrate (arrow). H&E, original magnification, ×400.
FIGURE 17 Banff Lesions Score i-IFTA (Inflammation in areas of IFTA). Image A shows Inflammation in areas of IFTA (arrow). This lesion score ranges from 0 to 3, based on the percentage of scarred areas of the cortex (ie, areas qualifying for ci and ct) involved by inflammation. It is one of the criteria necessary for a diagnosis of chronic active TCMR Grade IA or IB. Masson trichrome, original magnification ×200. B, In contrast shows interstitial fibrosis without significant infiltrate (arrow). H&E, original magnification, ×400.CC BY · PubMed Central
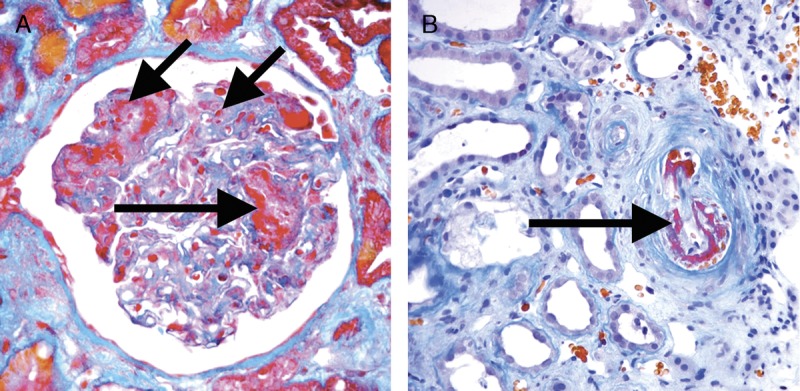
FIGURE 18 Acute TMA. A, An acute TMA affecting a glomerulus with fibrin thrombi (long arrows) and fragmented red blood cells (short arrow) in capillary loops. Trichrome, original magnification ×400. B, An acute TMA affecting a small arteriole (arrow). Acute TMA is one of the histological features used as histological evidence of acute tissue injury in Active AMR. However, TMA is not specific for AMR and can be seen in, for example, recurrent disease or calcineurin inhibitor toxicity. Trichrome, original magnification, ×400.
FIGURE 18 Acute TMA. A, An acute TMA affecting a glomerulus with fibrin thrombi (long arrows) and fragmented red blood cells (short arrow) in capillary loops. Trichrome, original magnification ×400. B, An acute TMA affecting a small arteriole (arrow). Acute TMA is one of the histological features used as histological evidence of acute tissue injury in Active AMR. However, TMA is not specific for AMR and can be seen in, for example, recurrent disease or calcineurin inhibitor toxicity. Trichrome, original magnification, ×400.CC BY · PubMed Central
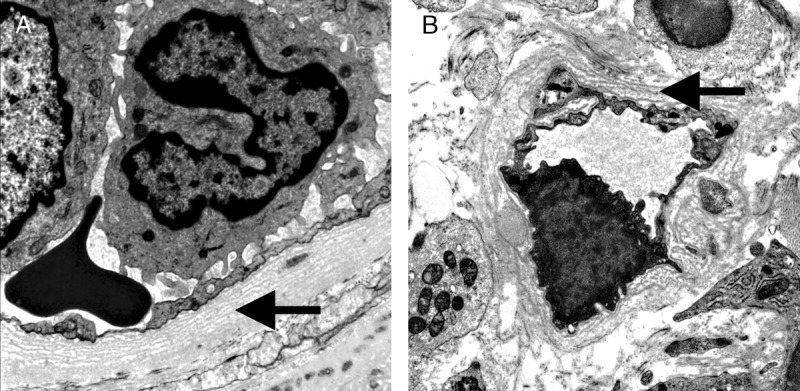
FIGURE 19 Severe Peritubular Capillary Basement Membrane Multilayering (PTCML) as demonstrated by EM. A, This Additional Diagnostic Parameter is a criterion for AMR chronicity. It is defined as 7 or more layers of basement membrane in at least a single cortical peritubular capillary and 5 or more in at least 2 additional capillaries. This particular capillary shows 8 layers (arrow). Transmission EM, original magnification ×14 000. B, This image demonstrates a peritubular capillary with 5 layers of basement membrane (arrow). Transmission EM, original magnification, ×10 000.
FIGURE 19 Severe Peritubular Capillary Basement Membrane Multilayering (PTCML) as demonstrated by EM. A, This Additional Diagnostic Parameter is a criterion for AMR chronicity. It is defined as 7 or more layers of basement membrane in at least a single cortical peritubular capillary and 5 or more in at least 2 additional capillaries. This particular capillary shows 8 layers (arrow). Transmission EM, original magnification ×14 000. B, This image demonstrates a peritubular capillary with 5 layers of basement membrane (arrow). Transmission EM, original magnification, ×10 000.CC BY · PubMed Central
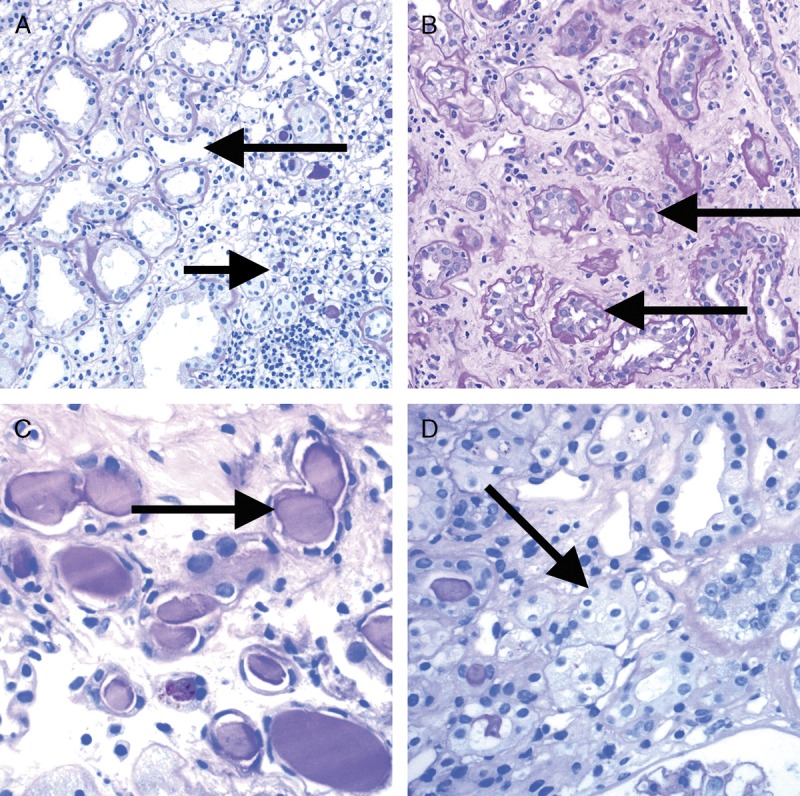
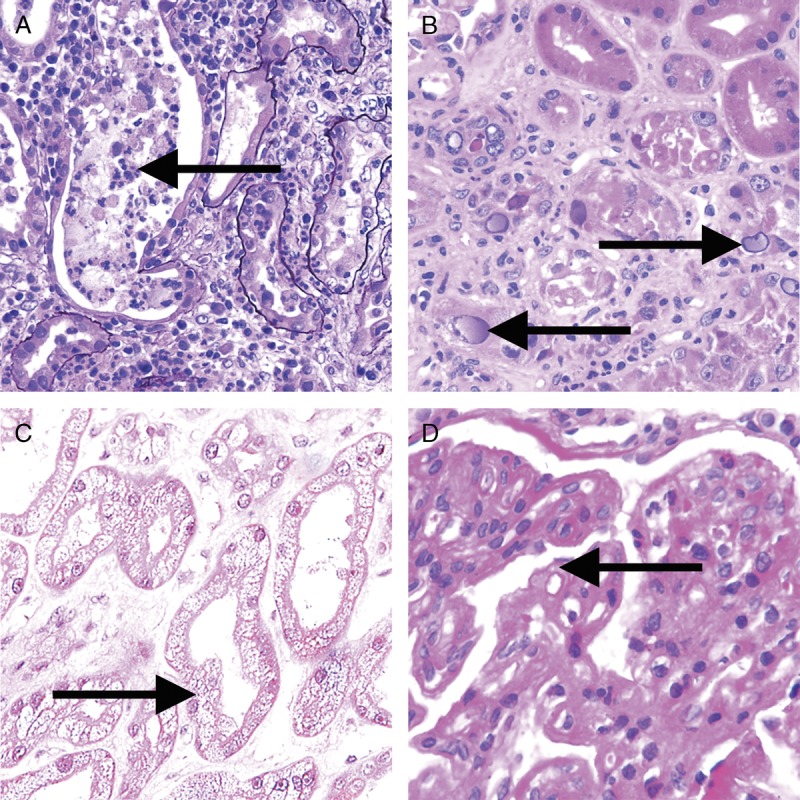
FIGURE 20 Banff Classification Diagnostic Category 6 (other). These images illustrate some of the more common examples of key lesions specified under category 6. A, Pyelonephritis with neutrophilic casts (arrow) and neutrophilic infiltrates with tubulitis. H&E, original magnification, ×200. B, BK virus nephropathy with typical ground glass intranuclear inclusions as seen on hematoxylin and eosin stain (arrows). H&E, original magnification ×400. C, Acute tubular injury with widespread isometric vacuolization of tubular epithelial cells (arrow) associated with acute Calcineurin Inhibitor Toxicity and other forms of injury. H&E, original magnification, ×200. D, Recurrent glomerulonephritis (membranoproliferative immune complex glomerulonephritis type I in this case) with split GBMs (arrow). The diagnosis was confirmed and TG excluded by positive IF for immunoglobulin heavy-, light-chains and complement slit products as well as abundant subendothelial electron dense immune complex deposits on EM. PAS, original magnification, ×400.
FIGURE 20 Banff Classification Diagnostic Category 6 (other). These images illustrate some of the more common examples of key lesions specified under category 6. A, Pyelonephritis with neutrophilic casts (arrow) and neutrophilic infiltrates with tubulitis. H&E, original magnification, ×200. B, BK virus nephropathy with typical ground glass intranuclear inclusions as seen on hematoxylin and eosin stain (arrows). H&E, original magnification ×400. C, Acute tubular injury with widespread isometric vacuolization of tubular epithelial cells (arrow) associated with acute Calcineurin Inhibitor Toxicity and other forms of injury. H&E, original magnification, ×200. D, Recurrent glomerulonephritis (membranoproliferative immune complex glomerulonephritis type I in this case) with split GBMs (arrow). The diagnosis was confirmed and TG excluded by positive IF for immunoglobulin heavy-, light-chains and complement slit products as well as abundant subendothelial electron dense immune complex deposits on EM. PAS, original magnification, ×400.CC BY · PubMed Central

Verification

Claims the paper makes

The claims and statistics of this paper haven’t been checked yet.

Run the check — free, no account needed. It reads the open-access text and checks the sources it cites.

A few free checks a day · papers already verified open instantly · results are public

Claims other papers make about this one

Each is checked against this paper’s own text: does it say what the citing paper says it does?

Self-check

Percentages, sums and reported differences re-computed from the paper’s own numbers.

The self-check needs the paper’s full text.

Citations

Cites

Show all 2 references

Research works printed but not linked: 26

  1. 1993, International standardization of criteria for the histologic diagnosis of renal allograft rejection: the Banff working classification of kidney transplant pathology, Kidney Int, 44, 411, 10.1038/ki.1993.259 · DOI
  2. 2007, SWOT analysis of Banff: strengths, weaknesses, opportunities and threats of the international Banff consensus process and classification system for renal allograft pathology, Am J Transplant, 7, 2221, 10.1111/j.1600-6143.2007.01924.x · DOI
  3. 2016, Banff borderline changes suspicious for acute T cell-mediated rejection: where do we stand?, Am J Transplant, 16, 2654, 10.1111/ajt.13784 · DOI
  4. 1996, Report of the Third Banff Conference on Allograft Pathology (July 20–24, 1995) on classification and lesion scoring in renal allograft pathology, Transplant Proc, 28, 441
  5. 1999, The Banff 97 working classification of renal allograft pathology, Kidney Int, 55, 713, 10.1046/j.1523-1755.1999.00299.x · DOI
  6. 2004, Banff 2003 meeting report: new diagnostic insights and standards, Am J Transplant, 4, 1562, 10.1111/j.1600-6143.2004.00585.x · DOI
  7. 2007, Banff '05 Meeting Report: differential diagnosis of chronic allograft injury and elimination of chronic allograft nephropathy ('CAN'), Am J Transplant, 7, 518, 10.1111/j.1600-6143.2006.01688.x · DOI
  8. 2008, Banff 07 classification of renal allograft pathology: updates and future directions, Am J Transplant, 8, 753, 10.1111/j.1600-6143.2008.02159.x · DOI
  9. 2012, Banff 2011 meeting report: new concepts in antibody-mediated rejection, Am J Transplant, 12, 563, 10.1111/j.1600-6143.2011.03926.x · DOI
  10. 2014, Banff 2013 meeting report: inclusion of c4d-negative antibody-mediated rejection and antibody-associated arterial lesions, Am J Transplant, 14, 272, 10.1111/ajt.12590 · DOI
  11. 2017, The Banff 2015 Kidney meeting report: current challenges in rejection classification and prospects for adopting molecular pathology, Am J Transplant, 17, 28, 10.1111/ajt.14107 · DOI
  12. 2018, The Banff 2017 kidney meeting report: revised diagnostic criteria for chronic active T cell-mediated rejection, antibody-mediated rejection, and prospects for integrative endpoints for next-generation clinical trials, Am J Transplant, 18, 293, 10.1111/ajt.14625 · DOI
  13. 2013, Consensus guidelines on the testing and clinical management issues associated with HLA and non-HLA antibodies in transplantation, Transplantation, 95, 19, 10.1097/TP.0b013e31827a19cc · DOI
  14. 2017, Banff histopathological consensus criteria for preimplantation kidney biopsies, Am J Transplant, 17, 140, 10.1111/ajt.13929 · DOI
  15. 2005, Loss of peritubular capillaries in the development of chronic allograft nephropathy, Transplant Proc, 37, 981, 10.1016/j.transproceed.2004.12.284 · DOI
  16. 2011, Morphometric and visual evaluation of fibrosis in renal biopsies, J Am Soc Nephrol, 22, 176, 10.1681/ASN.2009091005 · DOI
  17. 2014, Banff fibrosis study: multicenter visual assessment and computerized analysis of interstitial fibrosis in kidney biopsies, Am J Transplant, 14, 897, 10.1111/ajt.12641 · DOI
  18. 2011, Overlapping pathways to transplant glomerulopathy: chronic humoral rejection, hepatitis C infection, and thrombotic microangiopathy, Kidney Int, 80, 879, 10.1038/ki.2011.194 · DOI
  19. 2009, Scoring total inflammation is superior to the current Banff inflammation score in predicting outcome and the degree of molecular disturbance in renal allografts, Am J Transplant, 9, 1859, 10.1111/j.1600-6143.2009.02727.x · DOI
  20. 2010, Inflammation in areas of tubular atrophy in kidney allograft biopsies: a potent predictor of allograft failure, Am J Transplant, 10, 2066, 10.1111/j.1600-6143.2010.03240.x · DOI
  21. 2018, T cell-mediated rejection is a major determinant of inflammation in scarred areas in kidney allografts, Am J Transplant, 18, 377, 10.1111/ajt.14565 · DOI
  22. 2018, The causes, significance and consequences of inflammatory fibrosis in kidney transplantation: the Banff i-IFTA lesion, Am J Transplant, 18, 364, 10.1111/ajt.14609 · DOI
  23. 2018, The bridge between transplantation and regenerative medicine: beginning a new Banff classification of tissue engineering pathology, Am J Transplant, 18, 321, 10.1111/ajt.14610 · DOI
  24. 2017, Kim Solez, Edmonton, Alberta, Canada Banff: a unique start setting standards for consensus conferences, Transplantation, 101, 2264, 10.1097/TP.0000000000001901 · DOI
  25. 2002, Stem cells in the kidney, Kidney Int, 61, 387, 10.1046/j.1523-1755.2002.00164.x · DOI
  26. 2017, Single-cell transcriptomics to explore the immune system in health and disease, Science, 358, 58, 10.1126/science.aan6828 · DOI

Cited by

Sorted by citations

Metadata

Authors
Roufosse, C., Simmonds, N., Clahsen-van Groningen, M., Haas, M., Henriksen, K. J., Horsfield, C., Loupy, A., Mengel, M., Perkowska-Ptasińska, A., Rabant, M., Racusen, L. C., Solez, K., & Becker, J. U.
Venue
Transplantation
Published
2018-11
Volume
102
Issue
11
Pages
1795-1814
ISSN
  • 1534-6080
  • 0041-1337
Cited by
751
References
2
Language
en

About these checks

Registry, retraction, Cites and statistics results are computed, not judged, with one exception: a printed reference that no index lists is read once by a model before it counts as a citation error. Claims are extracted by a model and kept only when their quote appears verbatim in the text; each cited source is then checked, with a model’s help, for whether it says what the claim relies on. Those verdicts can be wrong — read the claim’s quote and the cited source before relying on one.

Statistics and arithmetic are recomputed, not judged.

Confidence bands are shown only for fields calibrated on our annotated test set. None is calibrated yet, so no band is shown.

What counts as a claim ›How we measure confidence ›How we check this ›

Are you an author, or do you see a problem with this page? Request a review