

The DOI matches its Crossref record; 2 of the 2 references it cites were found in a registry or an index.
Iconicity can ground the creation of vocal symbols
Abstract
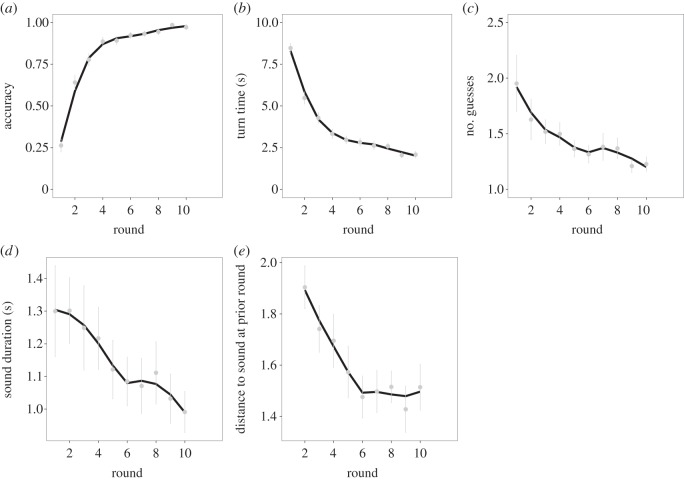
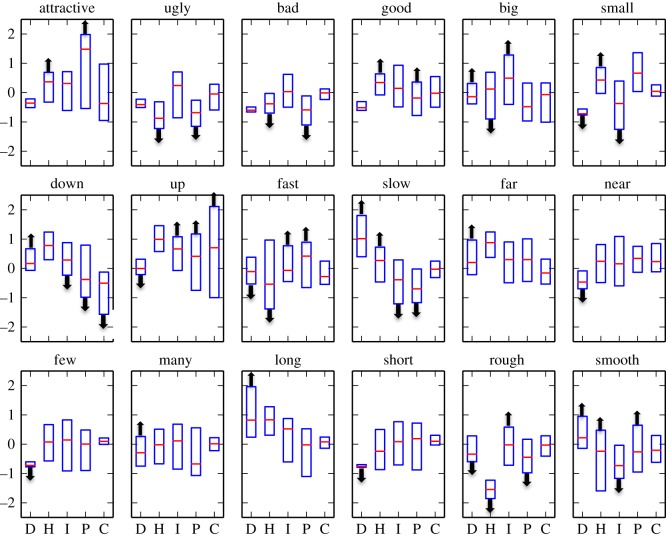
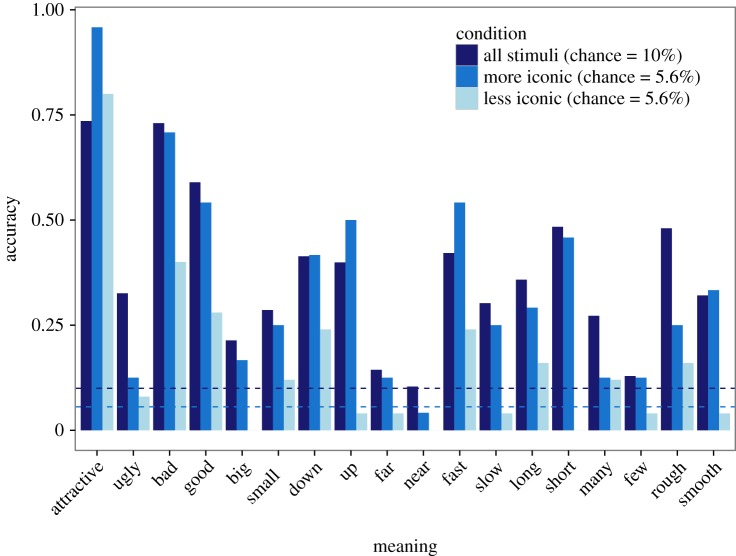
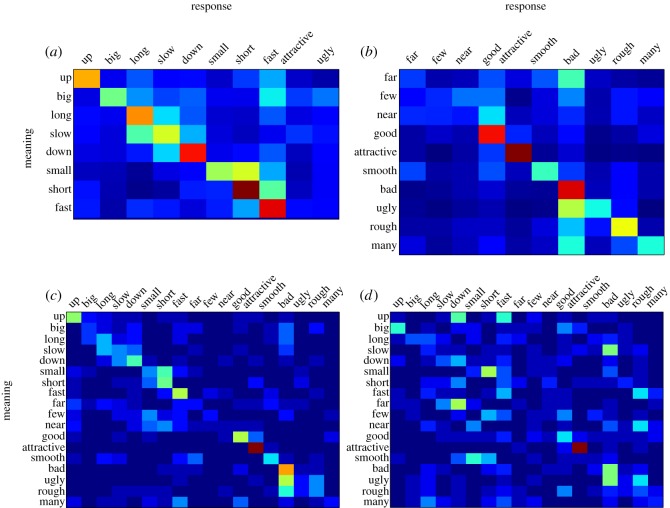
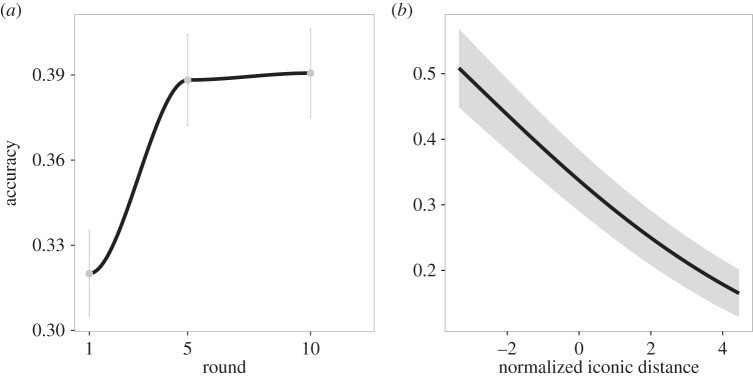
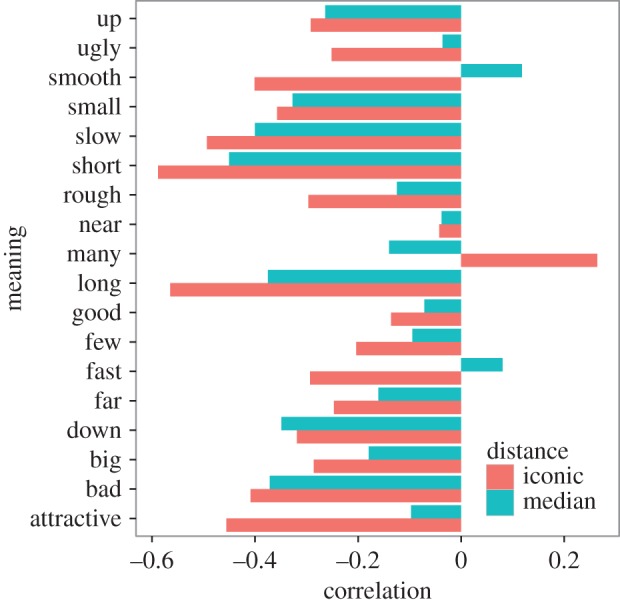
Studies of gestural communication systems find that they originate from spontaneously created iconic gestures. Yet, we know little about how people create vocal communication systems, and many have suggested that vocalizations do not afford iconicity beyond trivial instances of onomatopoeia. It is unknown whether people can generate vocal communication systems through a process of iconic creation similar to gestural systems. Here, we examine the creation and development of a rudimentary vocal symbol system in a laboratory setting. Pairs of participants generated novel vocalizations for 18 different meanings in an iterative ‘vocal’ charades communication game. The communicators quickly converged on stable vocalizations, and naive listeners could correctly infer their meanings in subsequent playback experiments. People's ability to guess the meanings of these novel vocalizations was predicted by how close the vocalization was to an iconic ‘meaning template’ we derived from the production data. These results strongly suggest that the meaningfulness of these vocalizations derived from iconicity. Our findings illuminate a mechanism by which iconicity can ground the creation of vocal symbols, analogous to the function of iconicity in gestural communication systems.
Overview
The claims and statistics of this paper haven’t been checked yet.
Run the check — free, no account needed. It reads the open-access text and checks the sources it cites.
Integrity signals
Registry
Cites
Statistics
Figures
Verification
Claims the paper makes
The claims and statistics of this paper haven’t been checked yet.
Run the check — free, no account needed. It reads the open-access text and checks the sources it cites.
Claims other papers make about this one
Each is checked against this paper’s own text: does it say what the citing paper says it does?
The source backs part of the claim, not all of it — or backs it for a different population, condition or comparison.
In the citing paper
“Such pantomimes are able to represent the sound-generating properties of objects and actions—as in the “ruff” of a dog barking—as well as non-vocal object-properties like size, height, velocity, and temperature that are correlated with the acoustics of objects”
From A Joint Prosodic Origin of Language and Music (2017) · cites this paper as Perlman et al., 2015
Experimental — accuracy not yet measuredIn the citing paper
“Perlman et al. (2015) showed that participants could modulate pitch in non-linguistic vocalizations to convey information about vertical position, speed, and texture.”
From A Joint Prosodic Origin of Language and Music (2017) · cites this paper as Perlman et al., 2015
Self-check
Percentages, sums and reported differences re-computed from the paper’s own numbers.
The self-check needs the paper’s full text.
Citations
Cites
Crossmodal correspondences: A tutorial review
Spence, C. (2011) · Attention, Perception, & Psychophysics · doi:10.3758/s13414-010-0073-7 · Cited by 1,618
Arbib, M. A. (2005) · Behavioral and Brain Sciences · doi:10.1017/s0140525x05000038 · Cited by 1,164
Research works printed but not linked: 53
- 10.1146/annurev-linguist-030514-124958 · DOI
- 10.1073/pnas.0405448102 · DOI
- 10.1126/science.1100199 · DOI
- 10.2307/412894 · DOI
- 10.1075/lv.12.2.04mei · DOI
- 10.1126/science.877567 · DOI
- 10.1515/9783110865028 · DOI
- Kendon A, 1988, Sign languages of aboriginal Australia: cultural, semiotic and communicative perspectives
- 10.1037/0033-295X.103.1.34 · DOI
- Dediu D, 2013, On the antiquity of language: the reinterpretation of Neandertal linguistic capacities and its consequences, Lang. Sci., 4, 397
- 10.1098/rstb.2013.0293 · DOI
- 10.1093/acprof:oso/9780195163483.001.0001 · DOI · Paper page
- 10.1515/cog-2013-0010 · DOI
- 10.1098/rstb.2013.0300 · DOI
- 10.1017/CBO9780511509629 · DOI
- 10.1080/03640210701703659 · DOI
- 10.1111/cogs.12190 · DOI
- 10.1098/rstb.2013.0298 · DOI · Paper page
- 10.1111/cogs.12048 · DOI
- Goldin-Meadow S, 2003, The resilience of language: what gesture creation in deaf children can tell us about how all children learn language
- 10.1353/lan.2005.0043 · DOI
- 10.1007/s11049-011-9128-2 · DOI
- Gelb IJ, 1952, A study of writing: the foundations of grammatology
- Sampson G, 1985, Writing systems: a linguistic introduction
- Vaccari O, 1964, Pictorial Chinese–Japanese characters: a new and fascinating method to learn ideographs
- Corballis MC, 2003, From hand to mouth: the origins of language
- 10.7551/mitpress/7551.001.0001 · DOI
- 10.2307/455140 · DOI
- 10.3389/fpsyg.2014.00354 · DOI
- Quine WV, 1960, Word and object
- 10.1016/j.cortex.2014.10.015 · DOI
- Ramachandran VS, 2001, Synaesthesia—a window into perception, thought and language, J. Conscious. Stud., 8, 3
- 10.1177/0956797609354734 · DOI
- Hinton L, 1994, Sound symbolism
- 10.1146/annurev.anthro.28.1.225 · DOI
- 10.3389/fpsyg.2010.00227 · DOI · Paper page
- Ohala JJ, 1994, Sound symbolism, 325
- 10.12697/SSS.2010.38.1-4.11 · DOI
- 10.1080/00437956.1964.11659816 · DOI
- 10.1023/A:1008184423824 · DOI
- 10.1002/lnc3.361 · DOI
- 10.1075/tsl.44 · DOI
- 10.1515/langcog-2012-0019 · DOI
- Boersma P, 2001, Praat, a system for doing phonetics by computer, Glot Int., 5, 341
- 10.1073/pnas.0707835105 · DOI · Paper page
- 10.1098/rstb.2013.0299 · DOI
- Clark N, 2013, Language and the creative mind, 393
- 10.1177/0956797612457374 · DOI
- Zbikowski LM, 1998, Metaphor and music theory: reflections from cognitive science, Music Theory Online, 4, 10.30535/mto.4.1.1 · DOI
- Klima E, 1988, The signs of language
- Nuckolls JB, 2003, Proc. 11th Annual Symp. about Language and Society, 131
- McNeill D, 1992, Hand and mind: what gestures reveal about thought
- 10.1017/CBO9780511807572 · DOI
Cited by
Sorted by citations
A Joint Prosodic Origin of Language and Music
Brown, S. (2017) · Frontiers in Psychology · doi:10.3389/fpsyg.2017.01894 · Cited by 132
Metadata
- Authors
- Perlman, M., Dale, R., & Lupyan, G.
- Affiliations
- Department of Psychology, University of Wisconsin-Madison, Madison, WI, USA
- Cognitive and Information Sciences, University of California, Merced, Merced, CA, USA
- Venue
- Royal Society Open Science
- Publisher
- The Royal Society
- Published
- 2015-08
- Volume
- 2
- Issue
- 8
- Pages
- 150152
- ISSN
- 2054-5703
- PMC
- PMC4555852
- Cited by
- 99
- References
- 2
- Language
- en
About these checks
Registry, retraction, Cites and statistics results are computed, not judged, with one exception: a printed reference that no index lists is read once by a model before it counts as a citation error. Claims are extracted by a model and kept only when their quote appears verbatim in the text; each cited source is then checked, with a model’s help, for whether it says what the claim relies on. Those verdicts can be wrong — read the claim’s quote and the cited source before relying on one.
Statistics and arithmetic are recomputed, not judged.
Confidence bands are shown only for fields calibrated on our annotated test set. None is calibrated yet, so no band is shown.
What counts as a claim ›How we measure confidence ›How we check this ›
Are you an author, or do you see a problem with this page? Request a review
How to cite
Cite CoChat for the checks on this page, and the paper for its own findings.
- This page
- CoChat. (2026). Citation check: Iconicity can ground the creation of vocal symbols. https://app.cochat.ai/papers/10.1098/rsos.150152
- The paper
- Perlman, M., Dale, R., & Lupyan, G. (2015). Iconicity can ground the creation of vocal symbols. Royal Society Open Science. https://doi.org/10.1098/rsos.150152
