

The DOI matches its Crossref record; 1 of the 1 references it cites were found in a registry or an index.
A phylogenomic approach reveals a low somatic mutation rate in a long-lived plant
Published version of a preprint
Abstract
Somatic mutations can have important effects on the life history, ecology, and evolution of plants, but the rate at which they accumulate is poorly understood and difficult to measure directly. Here, we develop a method to measure somatic mutations in individual plants and use it to estimate the somatic mutation rate in a large, long-lived, phenotypically mosaic Eucalyptus melliodora tree. Despite being 100 times larger than Arabidopsis, this tree has a per-generation mutation rate only ten times greater, which suggests that this species may have evolved mechanisms to reduce the mutation rate per unit of growth. This adds to a growing body of evidence that illuminates the correlated evolutionary shifts in mutation rate and life history in plants.
Overview
The claims and statistics of this paper haven’t been checked yet.
Run the check — free, no account needed. It reads the open-access text and checks the sources it cites.
Integrity signals
Registry
Cites
Statistics
Figures
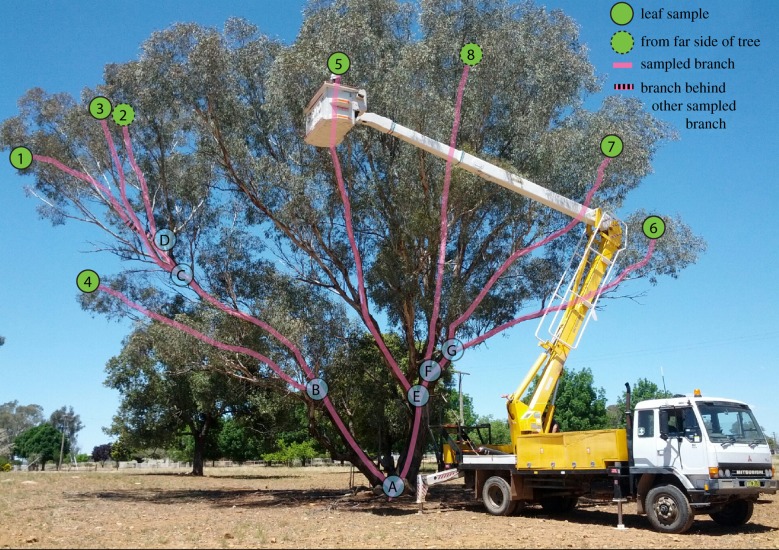
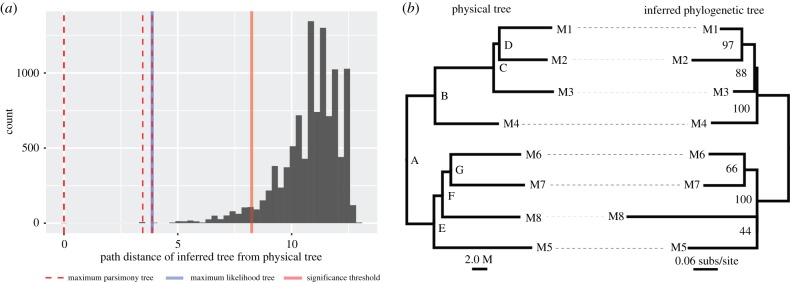
Verification
Claims the paper makes
The claims and statistics of this paper haven’t been checked yet.
Run the check — free, no account needed. It reads the open-access text and checks the sources it cites.
Claims other papers make about this one
Each is checked against this paper’s own text: does it say what the citing paper says it does?
The source backs part of the claim, not all of it — or backs it for a different population, condition or comparison.
In the citing paper
“With the exception of some initial studies, far less is known about somatic mutation in other species1–7.”
From Somatic mutation rates scale with lifespan across mammals (2022) · cites this paper as [6]
Experimental — accuracy not yet measured
Self-check
Percentages, sums and reported differences re-computed from the paper’s own numbers.
The self-check needs the paper’s full text.
Citations
Cites
Van der Auwera, G. A., Carneiro, M. O., Hartl, C., Poplin, R., del Angel, G., Levy‐Moonshine, A., Jordan, T., Shakir, K., Roazen, D., Thibault, J., et al. (2013) · Current Protocols in Bioinformatics · doi:10.1002/0471250953.bi1110s43 · Cited by 6,687
Research works printed but not linked: 43
- 10.1038/s41477-018-0172-3 · DOI
- 10.1038/s41477-017-0066-9 · DOI · Paper page
- 10.1007/BF00347587 · DOI
- 10.1073/pnas.80.5.1387 · DOI
- 10.1016/0168-9525(85)90071-X · DOI
- 10.1038/320305a0 · DOI
- 10.1038/340389a0 · DOI
- 10.1371/journal.pbio.1000454 · DOI
- 10.1146/annurev.es.26.110195.002231 · DOI
- 10.1038/ncomms2836 · DOI
- 10.1007/s10722-010-9534-z · DOI
- 10.1073/pnas.95.1.394 · DOI
- 10.1111/j.1365-294X.2004.02280.x · DOI
- 10.1016/0025-326X(94)90393-X · DOI
- 10.1002/evl3.121 · DOI
- 10.1371/journal.pbio.3000191 · DOI
- 10.1086/600100 · DOI
- 10.1038/hdy.2013.57 · DOI
- 10.1186/1471-2229-13-29 · DOI
- 10.1038/347434a0 · DOI
- 10.1111/nph.13150 · DOI
- 10.1093/bioinformatics/btt468 · DOI
- 10.1093/bioinformatics/btr509 · DOI
- 10.1093/bioinformatics/btq706 · DOI
- Steel MA, 1993, Distributions of tree comparison metrics-some new results, Syst. Biol., 42, 126
- 10.1038/nmeth.2611 · DOI
- Martin M Patterson M Garg S Fischer SO Pisanti N Klau GW Schoenhuth A Marschall T. 2016 WhatsHap: fast and accurate read-based phasing. bioRxiv 085050. (doi:10.1101/085050) · DOI
- 10.1534/genetics.112.145078 · DOI
- 10.1007/s11295-012-0491-x · DOI
- 10.1101/gr.107524.110 · DOI · Paper page
- 10.1111/nph.15887 · DOI
- 10.1534/genetics.113.158758 · DOI
- 10.1073/pnas.1609686113 · DOI
- 10.1016/j.cub.2016.03.067 · DOI
- 10.1071/9780643069701 · DOI
- 10.1371/journal.pbio.2005439 · DOI
- 10.1126/science.1180677 · DOI
- 10.1093/gbe/evu087 · DOI
- 10.7312/klek92068 · DOI
- 10.1038/hdy.2013.114 · DOI
- 10.1126/science.1163197 · DOI
- 10.1007/978-3-662-01662-6 · DOI
- 10.1371/journal.pbio.1002355 · DOI
Cited by
Sorted by citations
Somatic mutation rates scale with lifespan across mammals
Cagan, A., Baez-Ortega, A., Brzozowska, N., Abascal, F., Coorens, T. H. H., Sanders, M. A., Lawson, A. R. J., Harvey, L. M. R., Bhosle, S., Jones, D., et al. (2022) · Nature · doi:10.1038/s41586-022-04618-z · Cited by 481
Metadata
- Authors
- Orr, A. J., Padovan, A., Kainer, D., Külheim, C., Bromham, L., Bustos-Segura, C., Foley, W., Haff, T., Hsieh, J.-F., Morales-Suarez, A., Cartwright, R. A., & Lanfear, R.
- Venue
- Proceedings of the Royal Society B: Biological Sciences
- Publisher
- The Royal Society
- Published
- 2020-03-11
- Volume
- 287
- Issue
- 1922
- Pages
- 20192364
- ISSN
- 0962-8452
- 1471-2954
- PMC
- PMC7126060
- Cited by
- 63
- References
- 1
- Language
- en
- Funders
- The Hermon Slade Foundation
- Australian Research Council
About these checks
Registry, retraction, Cites and statistics results are computed, not judged, with one exception: a printed reference that no index lists is read once by a model before it counts as a citation error. Claims are extracted by a model and kept only when their quote appears verbatim in the text; each cited source is then checked, with a model’s help, for whether it says what the claim relies on. Those verdicts can be wrong — read the claim’s quote and the cited source before relying on one.
Statistics and arithmetic are recomputed, not judged.
Confidence bands are shown only for fields calibrated on our annotated test set. None is calibrated yet, so no band is shown.
What counts as a claim ›How we measure confidence ›How we check this ›
Are you an author, or do you see a problem with this page? Request a review
