

The DOI matches its Crossref record; 48 of the 48 references it cites were found in a registry or an index.
Discrete Distributional Differential Expression (D 3 E) - A Tool for Gene Expression Analysis of Single-cell RNA-seq Data
Open accessPreprint — published as 10.1186/s12859-016-0944-6 · Paper page
Abstract
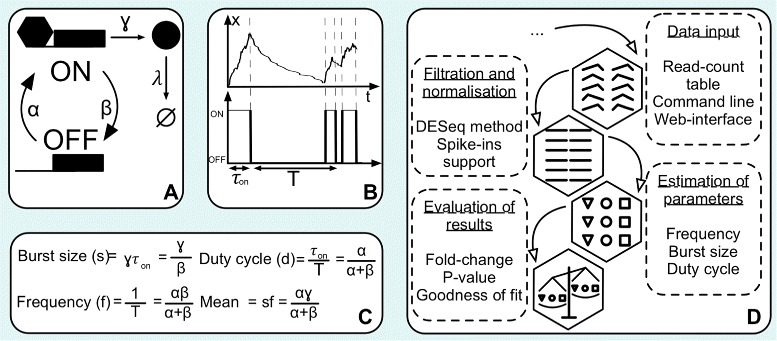
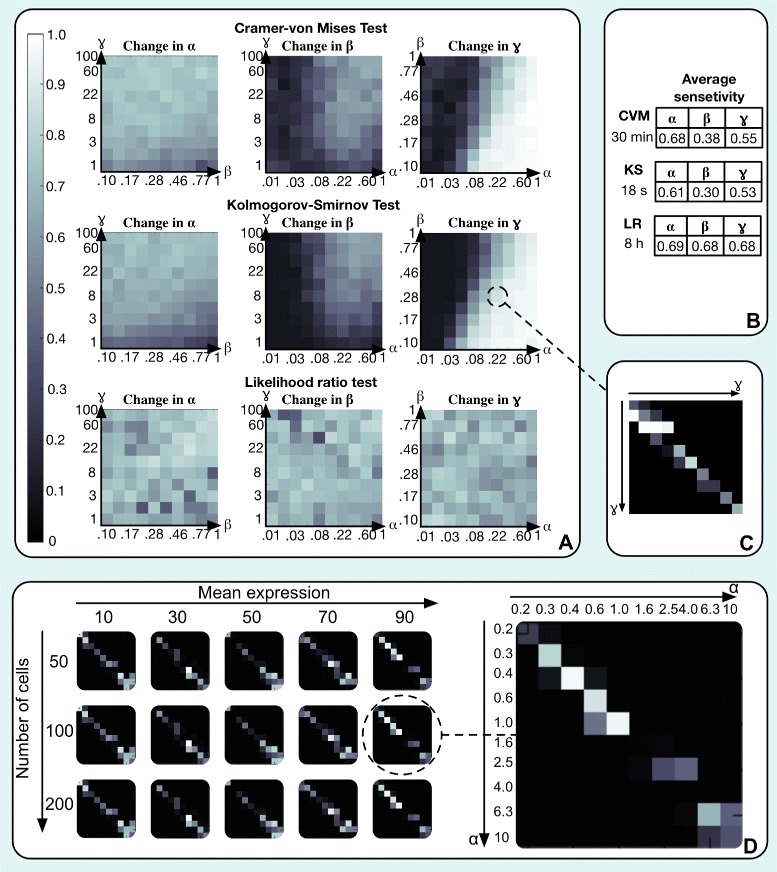
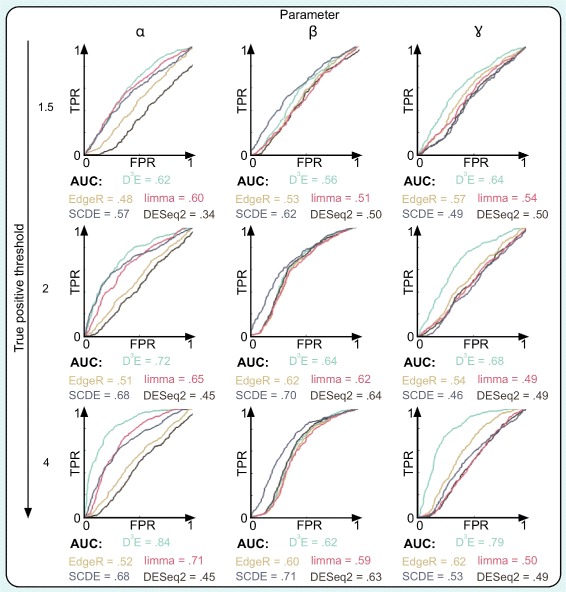
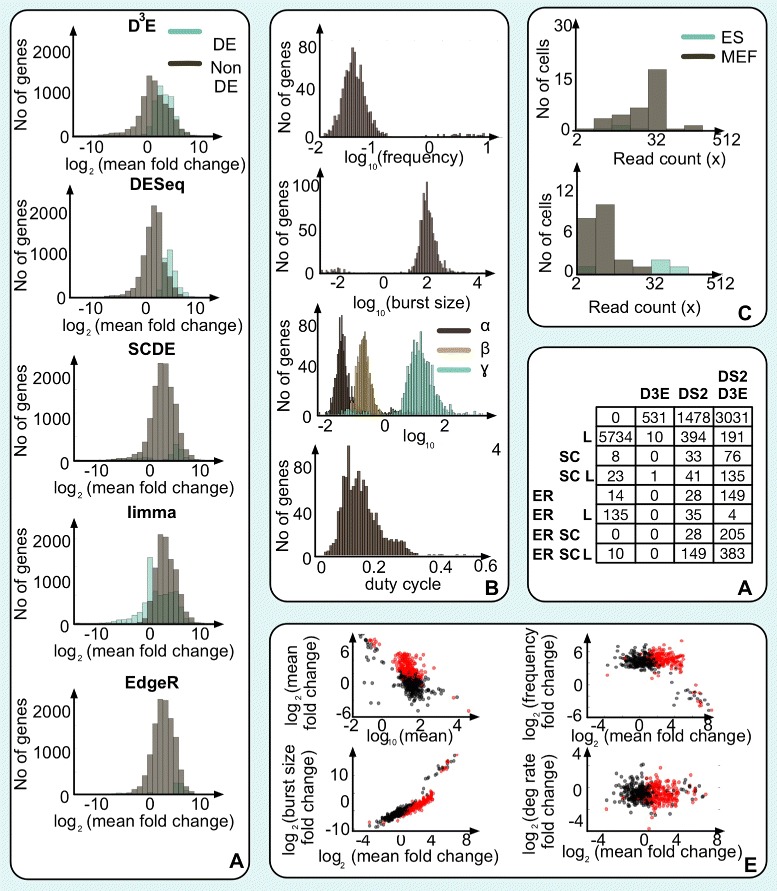
The advent of high throughput RNA-seq at the single-cell level has opened up new opportunities to elucidate the heterogeneity of gene expression. One of the most widespread applications of RNA-seq is to identify genes which are differentially expressed between two experimental conditions. Here, we present a discrete, distributional method for differential gene expression (D 3 E), a novel algorithm specifically designed for single-cell RNA-seq data. We use synthetic data to evaluate D 3 E, demonstrating that it can detect changes in expression, even when the mean level remains unchanged. Since D 3 E is based on an analytically tractable stochastic model, it provides additional biological insights by quantifying biologically meaningful properties, such as the average burst size and frequency. We use D 3 E to investigate experimental data, and with the help of the underlying model, we directly test hypotheses about the driving mechanism behind changes in gene expression.
Overview
The claims and statistics of this paper haven’t been checked yet.
Run the check — free, no account needed. It reads the open-access text and checks the sources it cites.
Integrity signals
Registry
Cites
Statistics
Figures
Verification
Claims the paper makes
The claims and statistics of this paper haven’t been checked yet.
Run the check — free, no account needed. It reads the open-access text and checks the sources it cites.
Self-check
Percentages, sums and reported differences re-computed from the paper’s own numbers.
The self-check needs the paper’s full text.
Citations
Cites
Controlling the False Discovery Rate: A Practical and Powerful Approach to Multiple Testing
Benjamini, Y., & Hochberg, Y. (1995) · Journal of the Royal Statistical Society Series B: Statistical Methodology · doi:10.1111/j.2517-6161.1995.tb02031.x · Cited by 109,482
Moderated estimation of fold change and dispersion for RNA-seq data with DESeq2
Love, M. I., Huber, W., & Anders, S. (2014) · Genome Biology · doi:10.1186/s13059-014-0550-8 · Cited by 95,106
Robinson, M. D., McCarthy, D. J., & Smyth, G. K. (2010) · Bioinformatics · doi:10.1093/bioinformatics/btp616 · Cited by 41,364
limma powers differential expression analyses for RNA-sequencing and microarray studies
Ritchie, M. E., Phipson, B., Wu, D., Hu, Y., Law, C. W., Shi, W., & Smyth, G. K. (2015) · Nucleic Acids Research · doi:10.1093/nar/gkv007 · Cited by 40,458
Global quantification of mammalian gene expression control
Schwanhäusser, B., Busse, D., Li, N., Dittmar, G., Schuchhardt, J., Wolf, J., Chen, W., & Selbach, M. (2011) · Nature · doi:10.1038/nature10098 · Cited by 6,566
Gillespie, D. T. (1976) · Journal of Computational Physics · doi:10.1016/0021-9991(76)90041-3 · Cited by 6,029
Controlling the false discovery rate in behavior genetics research
Benjamini, Y., Drai, D., Elmer, G., Kafkafi, N., & Golani, I. (2001) · Behavioural Brain Research · doi:10.1016/s0166-4328(01)00297-2 · Cited by 4,146
mRNA-Seq whole-transcriptome analysis of a single cell
Tang, F., Barbacioru, C., Wang, Y., Nordman, E., Lee, C., Xu, N., Wang, X., Bodeau, J., Tuch, B. B., Siddiqui, A., et al. (2009) · Nature Methods · doi:10.1038/nmeth.1315 · Cited by 3,969
Asymptotic Theory of Certain "Goodness of Fit" Criteria Based on Stochastic Processes
Anderson, T. W., & Darling, D. A. (1952) · The Annals of Mathematical Statistics · doi:10.1214/aoms/1177729437 · Cited by 3,542
Differential analysis of gene regulation at transcript resolution with RNA-seq
Trapnell, C., Hendrickson, D. G., Sauvageau, M., Goff, L., Rinn, J. L., & Pachter, L. (2013) · Nature Biotechnology · doi:10.1038/nbt.2450 · Cited by 3,492
Cited by
Sorted by citations
Scenic: single-cell regulatory network inference and clustering.
Aibar, S., González-Blas, C. B., Moerman, T., Huynh-Thu, V. A., Imrichova, H., Hulselmans, G., Rambow, F., Marine, J.-C., Geurts, P., Aerts, J., et al. (2017) · Nature Methods · doi:10.1038/nmeth.4463 · Cited by 6,520
Single-Cell RNA-Seq Technologies and Related Computational Data Analysis
Chen, G., Ning, B., & Shi, T. (2019) · Frontiers in Genetics · doi:10.3389/fgene.2019.00317 · Cited by 966
Bias, robustness and scalability in single-cell differential expression analysis
Soneson, C., & Robinson, M. D. (2018) · Nature Methods · doi:10.1038/nmeth.4612 · Cited by 770
Wang, T., Li, B., Nelson, C. E., & Nabavi, S. (2019) · BMC Bioinformatics · doi:10.1186/s12859-019-2599-6 · Cited by 286
A statistical approach for identifying differential distributions in single-cell RNA-seq experiments
Korthauer, K. D., Chu, L.-F., Newton, M. A., Li, Y., Thomson, J., Stewart, R., & Kendziorski, C. (2016) · Genome Biology · doi:10.1186/s13059-016-1077-y · Cited by 273
Metadata
- Authors
- Delmans, M., & Hemberg, M.
- Affiliations
- University of Cambridge (GB)
- Wellcome Sanger Institute (GB)
- Corresponding author
- Delmans, Mihails
- Hemberg, Martin
- Venue
- BMC Bioinformatics
- Publisher
- openRxiv
- Published
- 2015-06-10
- Volume
- 17
- Issue
- 1
- Pages
- 110-110
- ISSN
- 1471-2105 (ISSN-L)
- PMC
- PMC4772470
- OpenAlex
- W2950583356
- Cited by
- 111
- References
- 48
- Citations by year
- 2026: 3 · 2025: 3 · 2024: 9 · 2023: 15 · 2022: 17 · 2021: 25 · 2020: 10 · 2019: 7 · 2018: 12 · 2017: 8 · 2016: 2
- FWCI
- 5.03
- Type
- journal article
- Language
- en
- Open access
- gold
- doi.org
- Licence
- Locations
- BMC Bioinformatics (publishedVersion, cc-by)
- bioRxiv (Cold Spring Harbor Laboratory) (acceptedVersion, cc-by)
- PubMed Central (publishedVersion, cc-by)
- PubMed (publishedVersion)
- Funders
- Wellcome Trust
- University of Cambridge
- Biotechnology and Biological Sciences Research Council (1497818)
- Topics
- Life Sciences › Biochemistry, Genetics and Molecular Biology › Molecular Biology › Single-cell and spatial transcriptomics
- Life Sciences › Biochemistry, Genetics and Molecular Biology › Molecular Biology › Gene expression and cancer classification
- Life Sciences › Biochemistry, Genetics and Molecular Biology › Molecular Biology › Gene Regulatory Network Analysis
- Keywords
- differential gene expression, single-cell RNA sequencing, stochastic gene expression models, gene expression heterogeneity, burst size, burst frequency, synthetic data evaluation
- MeSH terms
- Algorithms, Humans, RNA, Statistical Distributions, Sequence Analysis, RNA, Gene Expression Profiling, Single-Cell Analysis, High-Throughput Nucleotide Sequencing
About these checks
Registry, retraction, Cites and statistics results are computed, not judged, with one exception: a printed reference that no index lists is read once by a model before it counts as a citation error. Claims are extracted by a model and kept only when their quote appears verbatim in the text; each cited source is then checked, with a model’s help, for whether it says what the claim relies on. Those verdicts can be wrong — read the claim’s quote and the cited source before relying on one.
Statistics and arithmetic are recomputed, not judged.
Confidence bands are shown only for fields calibrated on our annotated test set. None is calibrated yet, so no band is shown.
What counts as a claim ›How we measure confidence ›How we check this ›
Are you an author, or do you see a problem with this page? Request a review
