

The DOI matches its Crossref record; 49 of the 49 references it cites were found in a registry or an index.
Comparative analysis of differential gene expression analysis tools for single-cell RNA sequencing data
Open accessAbstract
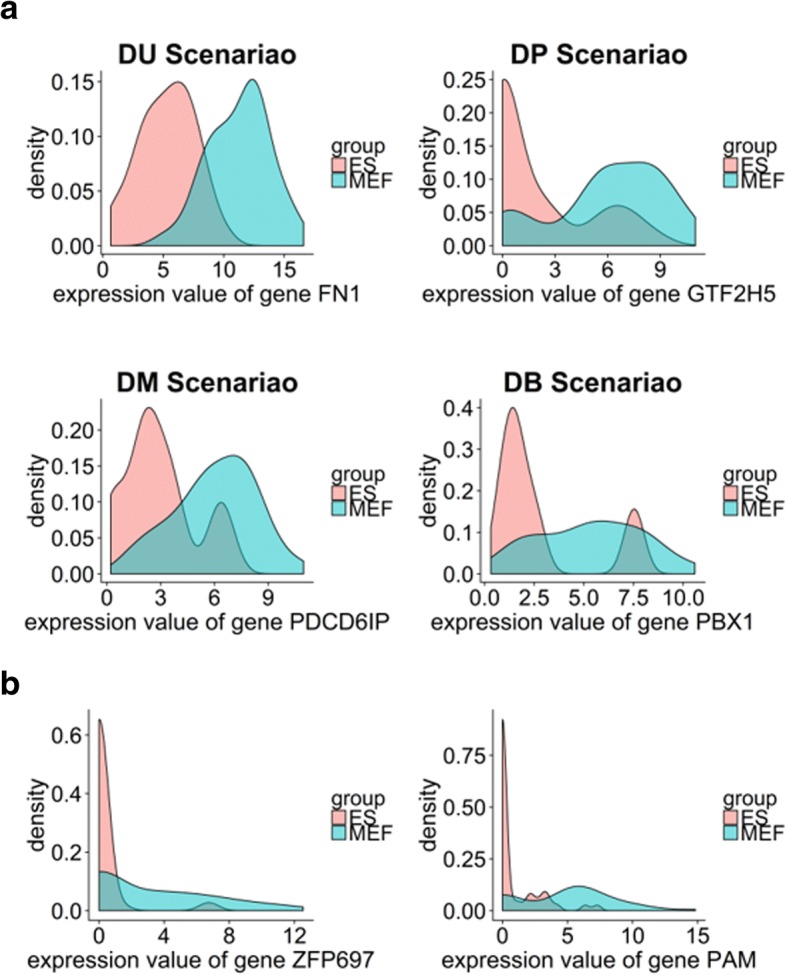
BACKGROUND: The analysis of single-cell RNA sequencing (scRNAseq) data plays an important role in understanding the intrinsic and extrinsic cellular processes in biological and biomedical research. One significant effort in this area is the detection of differentially expressed (DE) genes. scRNAseq data, however, are highly heterogeneous and have a large number of zero counts, which introduces challenges in detecting DE genes. Addressing these challenges requires employing new approaches beyond the conventional ones, which are based on a nonzero difference in average expression. Several methods have been developed for differential gene expression analysis of scRNAseq data. To provide guidance on choosing an appropriate tool or developing a new one, it is necessary to evaluate and compare the performance of differential gene expression analysis methods for scRNAseq data. RESULTS: In this study, we conducted a comprehensive evaluation of the performance of eleven differential gene expression analysis software tools, which are designed for scRNAseq data or can be applied to them. We used simulated and real data to evaluate the accuracy and precision of detection. Using simulated data, we investigated the effect of sample size on the detection accuracy of the tools. Using real data, we examined the agreement among the tools in identifying DE genes, the run time of the tools, and the biological relevance of the detected DE genes. CONCLUSIONS: In general, agreement among the tools in calling DE genes is not high. There is a trade-off between true-positive rates and the precision of calling DE genes. Methods with higher true positive rates tend to show low precision due to their introducing false positives, whereas methods with high precision show low true positive rates due to identifying few DE genes. We observed that current methods designed for scRNAseq data do not tend to show better performance compared to methods designed for bulk RNAseq data. Data multimodality and abundance of zero read counts are the main characteristics of scRNAseq data, which play important roles in the performance of differential gene expression analysis methods and need to be considered in terms of the development of new methods.
Overview
The claims and statistics of this paper haven’t been checked yet.
Run the check — free, no account needed. It reads the open-access text and checks the sources it cites.
Integrity signals
Registry
Cites
Statistics
Figures


Verification
Claims the paper makes
The claims and statistics of this paper haven’t been checked yet.
Run the check — free, no account needed. It reads the open-access text and checks the sources it cites.
Claims other papers make about this one
Each is checked against this paper’s own text: does it say what the citing paper says it does?
The source backs part of the claim, not all of it — or backs it for a different population, condition or comparison.
In the citing paper
“Unfortunately, different computational methods diverge significantly in estimating differential expression (Soneson and Robinson, 2018), and techniques specifically designed for sc/snRNA-seq may not perform better than standard methods used for bulk RNA-seq (Wang et al., 2019).”
From Single-Cell Sequencing of Brain Cell Transcriptomes and Epigenomes (2021) · cites this paper as Wang et al., 2019
Experimental — accuracy not yet measuredThe cited source says what the claim attributes to it.
In the citing paper
“The consensus and robustness between DGE tools is low83,84”
From Best practices for single-cell analysis across modalities (2023) · cites this paper as [83]
The cited source says what the claim attributes to it.
In the citing paper
“Current methods for DGE analysis still show a trade-off between true positive rate (TPR) and precision.”
From Best practices for single-cell analysis across modalities (2023) · cites this paper as [83]
Self-check
Percentages, sums and reported differences re-computed from the paper’s own numbers.
The self-check needs the paper’s full text.
Citations
Cites
R: A Language and Environment for Statistical Computing
R Core Team (2025) · doi:10.32614/r.manuals · Cited by 352,181
Controlling the False Discovery Rate: A Practical and Powerful Approach to Multiple Testing
Benjamini, Y., & Hochberg, Y. (1995) · Journal of the Royal Statistical Society Series B: Statistical Methodology · doi:10.1111/j.2517-6161.1995.tb02031.x · Cited by 109,482 · cited 2×
“For the differential expression analysis, a test with asymptotic chi-square null distribution is utilized, and a false discovery rate (FDR) adjustment control [44] is used to decide whether a gene is differentially expressed.”
MethodModerated estimation of fold change and dispersion for RNA-seq data with DESeq2
Love, M. I., Huber, W., & Anders, S. (2014) · Genome Biology · doi:10.1186/s13059-014-0550-8 · Cited by 95,106 · cited 3×
“We also considered tools designed for bulk RNAseq data that are widely used [4, 43] (edgeR, and DESeq2) or can apply to multimodal data [31] (EMDomics).”
Robinson, M. D., McCarthy, D. J., & Smyth, G. K. (2010) · Bioinformatics · doi:10.1093/bioinformatics/btp616 · Cited by 41,364 · cited 1×
“Tools developed for differential gene expression analysis on bulk RNAseq data, such as DESeq [11] and edgeR [12], can be applied to single-cell data [11 – 20].”
Methodlimma powers differential expression analyses for RNA-sequencing and microarray studies
Ritchie, M. E., Phipson, B., Wu, D., Hu, Y., Law, C. W., Shi, W., & Smyth, G. K. (2015) · Nucleic Acids Research · doi:10.1093/nar/gkv007 · Cited by 40,458
Differential expression analysis for sequence count data
Anders, S., & Huber, W. (2010) · Genome Biology · doi:10.1186/gb-2010-11-10-r106 · Cited by 15,581
Smyth, G. K. (2004) · Statistical Applications in Genetics and Molecular Biology · doi:10.2202/1544-6115.1027 · Cited by 11,829
Trapnell, C., Cacchiarelli, D., Grimsby, J., Pokharel, P., Li, S., Morse, M., Lennon, N. J., Livak, K. J., Mikkelsen, T. S., & Rinn, J. L. (2014) · Nature Biotechnology · doi:10.1038/nbt.2859 · Cited by 7,314
Sequencing technologies – the next generation
Metzker, M. L. (2010) · Nature Reviews Genetics · doi:10.1038/nrg2626 · Cited by 7,066
Stochastic Gene Expression in a Single Cell
Elowitz, M. B., Levine, A. J., Siggia, E. D., & Swain, P. S. (2002) · Science · doi:10.1126/science.1070919 · Cited by 5,441
Cited by
Deciphering cell–cell interactions and communication from gene expression
Armingol, E., Officer, A., Harismendy, O., & Lewis, N. E. (2021) · Nature Reviews Genetics · doi:10.1038/s41576-020-00292-x · Cited by 1,267
Best practices for single-cell analysis across modalities
Heumos, L., Schaar, A. C., Lance, C., Litinetskaya, A., Drost, F., Zappia, L., Lücken, M. D., Strobl, D. C., Henao, J., Curion, F., et al. (2023) · Nature Reviews Genetics · doi:10.1038/s41576-023-00586-w · Cited by 1,051
“3).”
Orchestrating single-cell analysis with Bioconductor
Amezquita, R. A., Lun, A. T. L., Becht, E., Carey, V. J., Carpp, L. N., Geistlinger, L., Marini, F., Rue-Albrecht, K., Risso, D., Soneson, C., et al. (2020) · Nature Methods · doi:10.1038/s41592-019-0654-x · Cited by 945
Molecular topography of an entire nervous system
Taylor, S. R., Santpere, G., Weinreb, A., Barrett, A., Reilly, M. B., Xu, C., Varol, E., Oikonomou, P., Glenwinkel, L., McWhirter, R., et al. (2021) · Cell · doi:10.1016/j.cell.2021.06.023 · Cited by 687
Dysregulation of brain and choroid plexus cell types in severe COVID-19
Yang, A. C., Kern, F., Losada, P. M., Agam, M. R., Maat, C. A., Schmartz, G. P., Fehlmann, T., Stein, J. A., Schaum, N., Lee, D. P., et al. (2021) · Nature · doi:10.1038/s41586-021-03710-0 · Cited by 620
Metadata
- Authors
- Wang, T., Li, B., Nelson, C. E., & Nabavi, S.
- Affiliations
- University of Connecticut (US)
- Corresponding author
- Nabavi, Sheida
- Venue
- BMC Bioinformatics
- Published
- 2019-01-18
- Volume
- 20
- Issue
- 1
- Pages
- 40-40
- ISSN
- 1471-2105 (ISSN-L)
- PMC
- PMC6339299
- OpenAlex
- W2911822431
- Cited by
- 286
- References
- 48
- Citations by year
- 2026: 10 · 2025: 19 · 2024: 48 · 2023: 43 · 2022: 54 · 2021: 62 · 2020: 39 · 2019: 10
- FWCI
- 13.81
- Type
- journal article
- Language
- en
- Open access
- gold
- doi.org
- Licence
- cc-by
- creativecommons.org/licenses/by/4.0/ (tdm)
- creativecommons.org/licenses/by/4.0/ (vor)
- Locations
- BMC Bioinformatics (publishedVersion, cc-by)
- Europe PMC (PubMed Central) (publishedVersion, other-oa)
- PubMed Central (publishedVersion, cc-by)
- PubMed (publishedVersion)
- DOAJ (DOAJ: Directory of Open Access Journals) (submittedVersion)
- Funders
- National Institutes of Health (R00LM011595)
- Topics
- Life Sciences › Biochemistry, Genetics and Molecular Biology › Molecular Biology › Single-cell and spatial transcriptomics
- Life Sciences › Biochemistry, Genetics and Molecular Biology › Molecular Biology › Gene expression and cancer classification
- Life Sciences › Biochemistry, Genetics and Molecular Biology › Molecular Biology › Genomics and Phylogenetic Studies
- Keywords
- differential gene expression, single-cell RNA sequencing, software tool comparison, zero counts, diagnostic sensitivity, false discovery rate, sample size effects, multimodality
- MeSH terms
- Humans, Sequence Analysis, RNA, Gene Expression Profiling
About these checks
Registry, retraction, Cites and statistics results are computed, not judged, with one exception: a printed reference that no index lists is read once by a model before it counts as a citation error. Claims are extracted by a model and kept only when their quote appears verbatim in the text; each cited source is then checked, with a model’s help, for whether it says what the claim relies on. Those verdicts can be wrong — read the claim’s quote and the cited source before relying on one.
Statistics and arithmetic are recomputed, not judged.
Confidence bands are shown only for fields calibrated on our annotated test set. None is calibrated yet, so no band is shown.
What counts as a claim ›How we measure confidence ›How we check this ›
Are you an author, or do you see a problem with this page? Request a review
How to cite
Cite CoChat for the checks on this page, and the paper for its own findings.
- This page
- CoChat. (2026). Citation check: Comparative analysis of differential gene expression analysis tools for single-cell RNA sequencing data. https://app.cochat.ai/papers/10.1186/s12859-019-2599-6
- The paper
- Wang, T., Li, B., Nelson, C. E., & Nabavi, S. (2019). Comparative analysis of differential gene expression analysis tools for single-cell RNA sequencing data. BMC Bioinformatics. https://doi.org/10.1186/s12859-019-2599-6
Data sources
Bibliographic data: Semantic Scholar, OpenAlex, Crossref.
Contains information from the Semantic Scholar Academic Graph Datasets, made available under the ODC Attribution License (ODC-BY 1.0).
Semantic Scholar’s data is described in: Kinney, R., et al. (2023). The Semantic Scholar Open Data Platform. arXiv:2301.10140.
