

The DOI matches its Crossref record; 15 of the 15 references it cites were found in a registry or an index.
Comparative dynamic aerosol efficiencies of three emergent coronaviruses and the unusual persistence of SARS-CoV-2 in aerosol suspensions
Open accessPreprint — published as 10.3201/eid2609.201806 · Paper page
Abstract
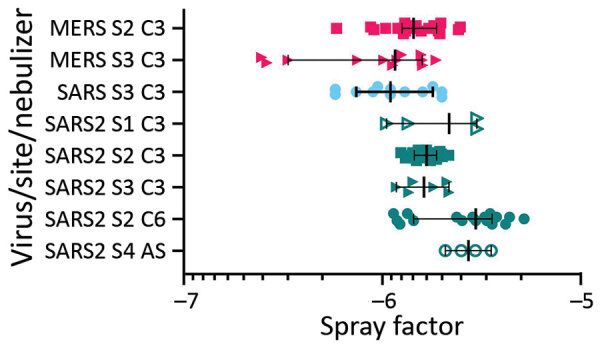
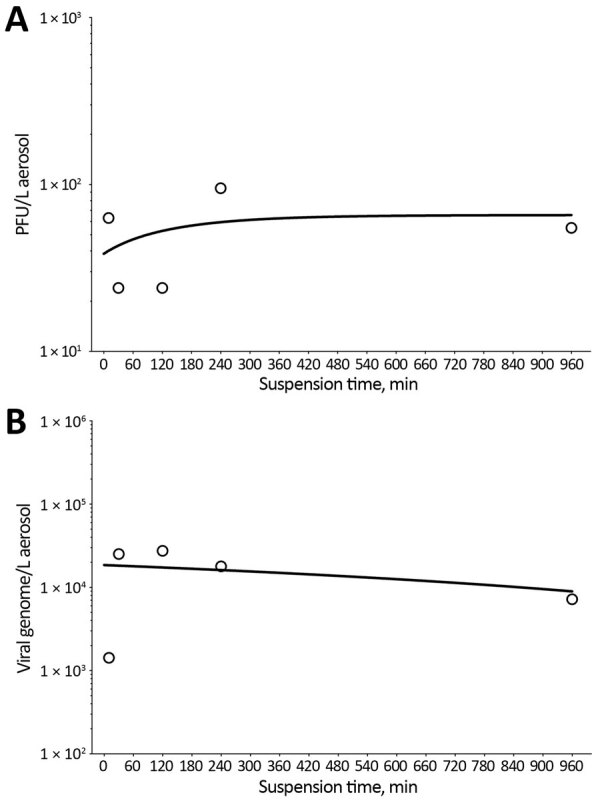
The emergent coronavirus, designated severe acute respiratory syndrome coronavirus-2 (SARS-CoV-2), is a zoonotic pathogen that has demonstrated remarkable transmissibility in the human population and is the etiological agent of a current global pandemic called COVID-19 1 . We measured the dynamic (short-term) aerosol efficiencies of SARS-CoV-2 and compared the efficiencies with two other emerging coronaviruses, SARS-CoV (emerged in 2002) and Middle Eastern respiratory syndrome CoV (MERS-CoV; emerged starting in 2012). We also quantified the long-term persistence of SARS-CoV-2 and its ability to maintain infectivity when suspended in aerosols for up to 16 hours.
Overview
Integrity signals
Registry
Cites
Statistics
Figures
Verification
Claims the paper makes
Claims other papers make about this one
Each is checked against this paper’s own text: does it say what the citing paper says it does?
In the citing paper
“particle sizes smaller than the minimum pathogen physical size (viral [da > 0.1 µm] [44,45] and bacterial [da > 1 µm] [46]) were assumed to be non-infectious”
From Comparative Mask Protection against Inhaling Wildfire Smoke, Allergenic Bioaerosols, and Infectious Particles (2022) · cites this paper as [44]
Citations
Cites
Aerosol and surface stability of SARS-CoV-2 as compared with SARS-CoV-1
van Doremalen, N., Bushmaker, T., Morris, D. H., Holbrook, M. G., Gamble, A., Williamson, B. N., Tamin, A., Harcourt, J. L., Thornburg, N. J., Gerber, S. I., et al. (2020) · New England Journal of Medicine · doi:10.1056/nejmc2004973 · Cited by 9,951
Airborne transmission of SARS-CoV-2: The world should face the reality
Morawska, L., & Cao, J. (2020) · Environment International · doi:10.1016/j.envint.2020.105730 · Cited by 1,728
Molecular Diagnosis of a Novel Coronavirus (2019-nCoV) Causing an Outbreak of Pneumonia
Chu, D. K. W., Pan, Y., Cheng, S. M. S., Hui, K. P. Y., Krishnan, P., Liu, Y., Ng, D. Y. M., Wan, C. K. C., Yang, P., Wang, Q., et al. (2020) · Clinical Chemistry · doi:10.1093/clinchem/hvaa029 · Cited by 1,278
Stadnytskyi, V., Bax, C. E., Bax, A., & Anfinrud, P. (2020) · Proceedings of the National Academy of Sciences · doi:10.1073/pnas.2006874117 · Cited by 1,104
SARS-CoV-2: an Emerging Coronavirus that Causes a Global Threat
Zheng, J. (2020) · International Journal of Biological Sciences · doi:10.7150/ijbs.45053 · Cited by 1,062
Buonanno, G., Stabile, L., & Morawska, L. (2020) · Environment International · doi:10.1016/j.envint.2020.105794 · Cited by 776
Milton, D. K., Fabian, M. P., Cowling, B. J., Grantham, M. L., & McDevitt, J. J. (2013) · PLoS Pathogens · doi:10.1371/journal.ppat.1003205 · Cited by 669
Pung, R., Chiew, C. J., Young, B. E., Chin, S. N. M., Chen, M. I.-C., Clapham, H., Cook, A. R., Maurer‐Stroh, S., Toh, M. P. H., Poh, C., et al. (2020) · The Lancet · doi:10.1016/s0140-6736(20)30528-6 · Cited by 648
Severe Acute Respiratory Syndrome Coronavirus 2 from Patient with Coronavirus Disease, United States
Harcourt, J. L., Tamin, A., Lu, X., Kamili, S., Sakthivel, S. K., Murray, J., Queen, K. J., Tao, Y., Paden, C. R., Zhang, J., et al. (2020) · Emerging infectious diseases · doi:10.3201/eid2606.200516 · Cited by 534
Self-citationTHE USE OF A ROTATING DRUM FOR THE STUDY OF AEROSOLS OVER EXTENDED PERIODS OF TIME1
Goldberg, L. J., Watkins, H. M. S., BOERKE, E. E., & Chatigny, M. A. (1958) · American Journal of Epidemiology · doi:10.1093/oxfordjournals.aje.a119954 · Cited by 158
A Cough Aerosol Simulator for the Study of Disease Transmission by Human Cough-Generated Aerosols
Lindsley, W. G., Reynolds, J. S., Szalajda, J. V., Noti, J. D., & Beezhold, D. H. (2013) · Aerosol Science and Technology · doi:10.1080/02786826.2013.803019 · Cited by 128
Dynamics of Cough Frequency in Adults Undergoing Treatment for Pulmonary Tuberculosis
Proaño, Á., Bravard, M. A., López, J. W., Lee, G. O., Bui, D. P., Datta, S., Cómina, G., Zimic, M., Coronel, J., Caviedes, L., et al. (2017) · Clinical Infectious Diseases · doi:10.1093/cid/cix039 · Cited by 86
Susceptibility of monkeypox virus aerosol suspensions in a rotating chamber
Verreault, D., Killeen, S. Z., Redmann, R. K., & Roy, C. J. (2012) · Journal of Virological Methods · doi:10.1016/j.jviromet.2012.10.009 · Cited by 51
Self-citationInfectious disease aerobiology: miasma incarnate
Roy, C. J., & Reed, D. S. (2012) · Frontiers in Cellular and Infection Microbiology · doi:10.3389/fcimb.2012.00163 · Cited by 12
Self-citationO’Malley, K. J., Bowling, J., Barry, E. M., Hazlett, K. R. O., & Reed, D. S. (2019) · Infection and Immunity · doi:10.1128/iai.00198-19 · Cited by 9
Self-citation
Cited by
Sorted by citations
SARS-CoV-2 in wastewater: State of the knowledge and research needs
Kitajima, M., Ahmed, W., Bibby, K. J., Carducci, A., Gerba, C. P., Hamilton, K. A., Haramoto, E., & Rose, J. B. (2020) · The Science of The Total Environment · doi:10.1016/j.scitotenv.2020.139076 · Cited by 778
“…from wastewater facilities, but a recent laboratory-scale study on persistence of coronaviruses in aerosols revealed that SARS-CoV-2 could maintain its infectivity in aerosols for up to 16 h (Fears et al., 2020), suggesting potential human exposure if wastewater aerosols contain viable SARS-CoV-2.”
Miller, S. L., Nazaroff, W. W., Jimenez, J. L., Boerstra, A., Buonanno, G., Dancer, S. J., Kurnitski, J., Marr, L. C., Morawska, L., & Noakes, C. (2021) · Indoor Air · doi:10.1111/ina.12751 · Cited by 734
Viable SARS-CoV-2 in the air of a hospital room with COVID-19 patients
Lednicky, J. A., Lauzardo, M., Fan, Z. H., Jutla, A., Tilly, T. B., Gangwar, M., Usmani, M., Shankar, S. N., Mohamed, K., Eiguren-Fernandez, A., et al. (2020) · International Journal of Infectious Diseases · doi:10.1016/j.ijid.2020.09.025 · Cited by 683
Aerosol transmission of SARS-CoV-2? Evidence, prevention and control
Tang, S., Mao, Y., Jones, R. M., Tan, Q., Ji, J. S., Li, N., Shen, J., Lv, Y., Pan, L., Ding, P., et al. (2020) · Environment International · doi:10.1016/j.envint.2020.106039 · Cited by 552
A guideline to limit indoor airborne transmission of COVID-19
Bazant, M. Z., & Bush, J. W. M. (2021) · Proceedings of the National Academy of Sciences · doi:10.1073/pnas.2018995118 · Cited by 493
Metadata
- Authors
- Fears, A. C., Klimstra, W. B., Duprex, P., Hartman, A., Weaver, S. C., Plante, K. C., Mirchandani, D., Plante, J. A., Aguilar, P. V., Fernández, D., Nalca, A., Totura, A., Dyer, D., Kearney, B., Lackemeyer, M., Bohannon, J. K., Johnson, R., Garry, R. F., Reed, D. S., & Roy, C. J.
- Affiliations
- Tulane University (US)
- Corresponding author
- Roy, C.J.
- ORCID
- Venue
- Emerging infectious diseases
- Publisher
- openRxiv
- Published
- 2020-04-18
- Volume
- 26
- Issue
- 9
- Pages
- 2168-2171
- ISSN
- 1080-6040 (ISSN-L)
- PMC
- PMC7454081
- OpenAlex
- W3036295571
- Cited by
- 453
- References
- 15
- Citations by year
- 2026: 5 · 2025: 13 · 2024: 32 · 2023: 40 · 2022: 102 · 2021: 165 · 2020: 95
- FWCI
- 56.65
- Type
- journal article
- Language
- en
- Open access
- diamond
- doi.org
- Licence
- cc-by
- Locations
- Emerging infectious diseases (publishedVersion, cc-by)
- medRxiv (acceptedVersion)
- PubMed Central (publishedVersion, cc-by)
- PubMed (publishedVersion)
- PubMed Central (submittedVersion)
- DOAJ (DOAJ: Directory of Open Access Journals) (submittedVersion, cc-by-sa)
- Funders
- U.S. Department of Health and Human Services (HHSN272201800013C)
- Battelle (HHSN272200700016I)
- University of Pittsburgh
- National Institutes of Health (HHSN272201800013C, USA-WA1/2020, P51OD011104)
- Centers for Disease Control and Prevention
- U.S. Army
- National Institute of Allergy and Infectious Diseases (R24AI120942, HHS N272200700016I, HHSN272201800013C, U19AI135995)
- NHLBI Division of Intramural Research
- Topics
- Health Sciences › Medicine › Pulmonary and Respiratory Medicine › Infection Control and Ventilation
- Health Sciences › Medicine › Infectious Diseases › SARS-CoV-2 and COVID-19 Research
- Health Sciences › Dentistry › General Dentistry › Dental Research and COVID-19
- Keywords
- SARS-CoV-2, COVID-19 pandemic, aerosol stability, viral persistence, SARS-CoV, MERS-CoV, airborne transmission
About these checks
Registry, retraction, Cites and statistics results are computed, not judged, with one exception: a printed reference that no index lists is read once by a model before it counts as a citation error. Claims are extracted by a model and kept only when their quote appears verbatim in the text; each cited source is then checked, with a model’s help, for whether it says what the claim relies on. Those verdicts can be wrong — read the claim’s quote and the cited source before relying on one.
Statistics and arithmetic are recomputed, not judged.
Confidence bands are shown only for fields calibrated on our annotated test set. None is calibrated yet, so no band is shown.
What counts as a claim ›How we measure confidence ›How we check this ›
Are you an author, or do you see a problem with this page? Request a review
