PreprintCited by 12Computational Drug Discovery MethodsChemical Synthesis and AnalysisMachine Learning in Bioinformatics

The DOI matches its Crossref record; 1 of the 1 references it cites were found in a registry or an index.

Assessing sequence-based protein-protein interaction predictors for use in therapeutic peptide engineering

Open access

Preprint — published as 10.1038/s41598-022-13227-9

Abstract

Engineering peptides to achieve a desired therapeutic effect through the inhibition of a specific target activity or protein interaction is a non-trivial task. Few of the existing in silico peptide design algorithms generate target-specific peptides. Instead, many methods produce peptides that achieve a desired effect through an unknown mechanism. In contrast with resource-intensive high-throughput experiments, in silico screening is a cost-effective alternative that can prune the space of candidates when engineering target-specific peptides. Using a set of FDA-approved peptides we curated specifically for this task, we assess the applicability of several sequence-based protein-protein interaction predictors as a screening tool within the context of peptide therapeutic engineering. We show that similarity-based protein-protein interaction predictors are more suitable for this purpose than the state-of-the-art deep learning methods publicly available at the time of writing. We also show that this approach is mostly useful when designing new peptides against targets for which naturally-occurring interactors are already known, and that deploying it for de novo peptide engineering tasks may require gathering additional target-specific training data. Taken together, this work offers evidence that supports the use of similarity-based protein-protein interaction predictors for peptide therapeutic engineering, especially peptide analogs.

Overview

The claims and statistics of this paper haven’t been checked yet.

Run the check — free, no account needed. It reads the open-access text and checks the sources it cites.

A few free checks a day · papers already verified open instantly · results are public

Integrity signals

Registry

Crossref · 10.1101/2021.09.29.462289

Cites

1 of 1 references verified0 citation errors · 0 not checkable

Statistics

Figures

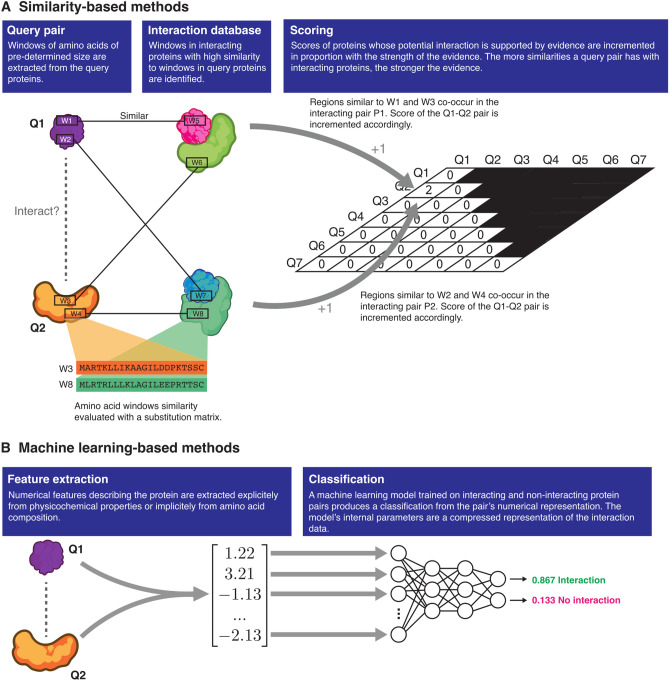
Figure 1 Similarity- and machine learning-based protein–protein interaction predictors. Similarity-based methods differ from machine learning-based methods in that the evidence supporting an interaction is quantified by counting the number of similarities to known instances of interacting proteins in a database. Machine learning-based methods are trained to learn patterns found in interacting protein pairs, and identify those patterns in the query proteins.
Figure 1 Similarity- and machine learning-based protein–protein interaction predictors. Similarity-based methods differ from machine learning-based methods in that the evidence supporting an interaction is quantified by counting the number of similarities to known instances of interacting proteins in a database. Machine learning-based methods are trained to learn patterns found in interacting protein pairs, and identify those patterns in the query proteins.CC BY · PubMed Central
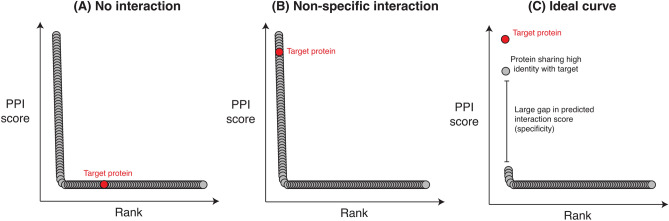
Figure 2 Representative one-to-all curves. Many one-to-all curves adopt one of three morphologies: (A) no interaction between the peptide and the target, (B) non-specific interaction where the peptide is predicted to interact with many proteins in addition to the target, and (C) where the peptide specifically interacts with the intended protein target (and possibly, closely related proteins).
Figure 2 Representative one-to-all curves. Many one-to-all curves adopt one of three morphologies: (A) no interaction between the peptide and the target, (B) non-specific interaction where the peptide is predicted to interact with many proteins in addition to the target, and (C) where the peptide specifically interacts with the intended protein target (and possibly, closely related proteins).CC BY · PubMed Central
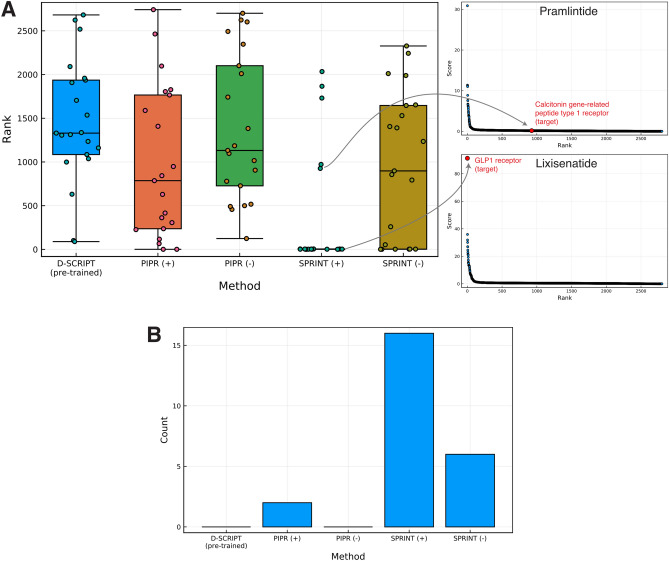
Figure 3 Rankings of interactions involving peptide-target pairs. (A) Distributions of ranks of the peptide-target pairs are shown for models whose training data included interactions involving an endogenous peptide analog (optimistic scenario; +) and models trained without (pessimistic scenario; −). The ranks of the true targets for two therapeutic peptides are illustrated on their one-to-all curves on the right side of the box plot. (B) Counts of therapeutic peptide targets ranking in the top 1% on the corresponding one-to-all curve.
Figure 3 Rankings of interactions involving peptide-target pairs. (A) Distributions of ranks of the peptide-target pairs are shown for models whose training data included interactions involving an endogenous peptide analog (optimistic scenario; +) and models trained without (pessimistic scenario; −). The ranks of the true targets for two therapeutic peptides are illustrated on their one-to-all curves on the right side of the box plot. (B) Counts of therapeutic peptide targets ranking in the top 1% on the corresponding one-to-all curve.CC BY · PubMed Central
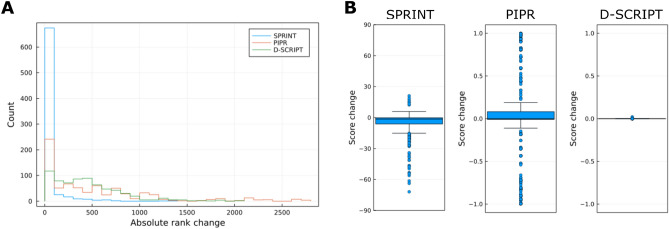
Figure 4 Distribution of changes in rank and score. The one-to-all curves were regenerated for each peptide by mutating each non-Gly residue to Gly to evaluate (A) the absolute change in rank on the one-to-all curve and (B) the change in score. As a reminder, SPRINT scores are unbounded, while PIPR and D-SCRIPT scores are probabilities that range from 0 to 1.
Figure 4 Distribution of changes in rank and score. The one-to-all curves were regenerated for each peptide by mutating each non-Gly residue to Gly to evaluate (A) the absolute change in rank on the one-to-all curve and (B) the change in score. As a reminder, SPRINT scores are unbounded, while PIPR and D-SCRIPT scores are probabilities that range from 0 to 1.CC BY · PubMed Central
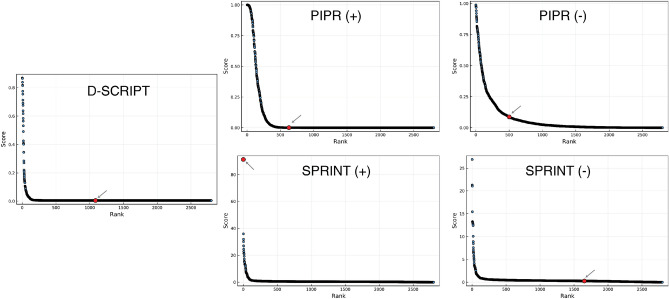
Figure 5 One-to-all curves for lixisenatide. The one-to-all curves generated using the predicted interaction scores of the three predictors are shown here. The true target protein is highlighted in red, while the black dots represent off-target proteins. One-to-all curves generated with predictors trained in the optimistic scenario are indicated with a (+).
Figure 5 One-to-all curves for lixisenatide. The one-to-all curves generated using the predicted interaction scores of the three predictors are shown here. The true target protein is highlighted in red, while the black dots represent off-target proteins. One-to-all curves generated with predictors trained in the optimistic scenario are indicated with a (+).CC BY · PubMed Central
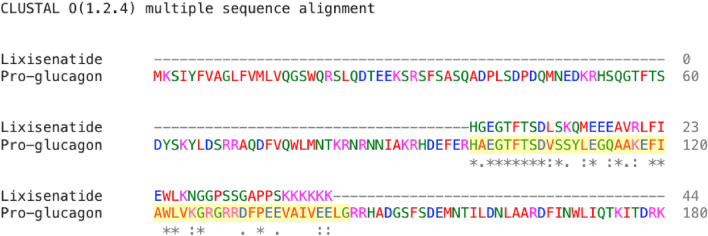
Figure 6 Alignment between lixisenatide and pro-glucagon. Results of the alignment between lixisenatide and pro-glucagon generated with Clustal Omega31. The highlighted region corresponds to the endogenously expressed GLP1 peptide.
Figure 6 Alignment between lixisenatide and pro-glucagon. Results of the alignment between lixisenatide and pro-glucagon generated with Clustal Omega31. The highlighted region corresponds to the endogenously expressed GLP1 peptide.CC BY · PubMed Central
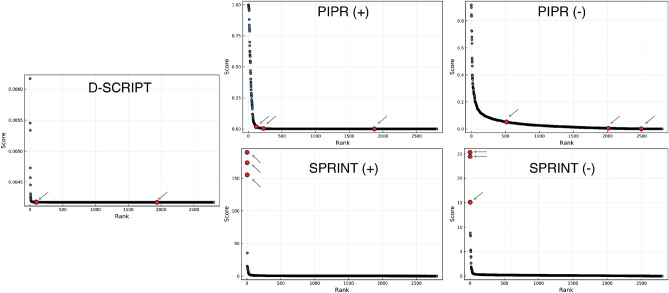
Figure 7 One-to-all curves for carperitide. The one-to-all curves generated using the predicted interaction scores of the three predictors are shown here. The true target protein is highlighted in red, while the black dots represent off-target proteins. One-to-all curves generated with predictors trained in the optimistic scenario are indicated with a (+).
Figure 7 One-to-all curves for carperitide. The one-to-all curves generated using the predicted interaction scores of the three predictors are shown here. The true target protein is highlighted in red, while the black dots represent off-target proteins. One-to-all curves generated with predictors trained in the optimistic scenario are indicated with a (+).CC BY · PubMed Central
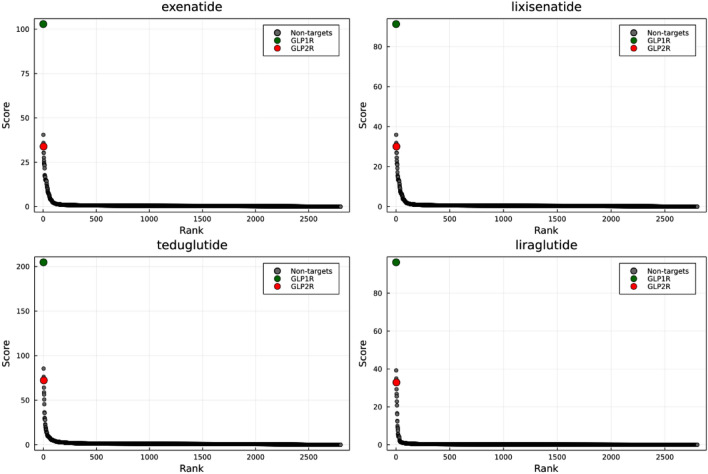
Figure 8 One-to-all curves of the peptides targeting a GLP receptor. Exenatide, liraglutide and lixsenatide target the GLP-1 receptor while teduglutide was developed to target the GLP-2 receptor. The curves were generated with SPRINT (+).
Figure 8 One-to-all curves of the peptides targeting a GLP receptor. Exenatide, liraglutide and lixsenatide target the GLP-1 receptor while teduglutide was developed to target the GLP-2 receptor. The curves were generated with SPRINT (+).CC BY · PubMed Central
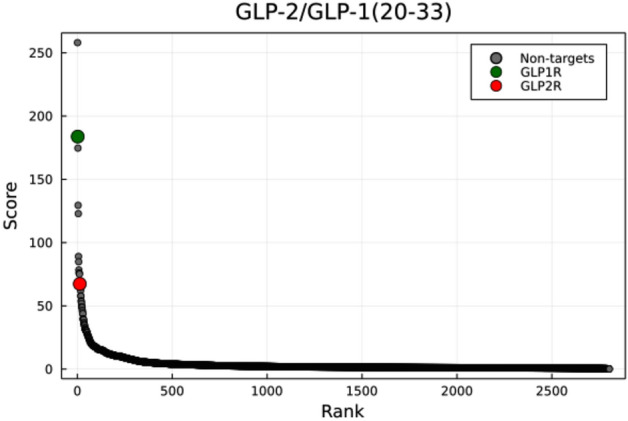
Figure 9 One-to-all curve of a chimeric peptide with roughly equal affinity for GLP1R and GLP2R. The one-to-all curve of the chimeric peptide GLP-2/GLP-1(20-33) generated with SPRINT (+).
Figure 9 One-to-all curve of a chimeric peptide with roughly equal affinity for GLP1R and GLP2R. The one-to-all curve of the chimeric peptide GLP-2/GLP-1(20-33) generated with SPRINT (+).CC BY · PubMed Central

Verification

Claims the paper makes

The claims and statistics of this paper haven’t been checked yet.

Run the check — free, no account needed. It reads the open-access text and checks the sources it cites.

A few free checks a day · papers already verified open instantly · results are public

Self-check

Percentages, sums and reported differences re-computed from the paper’s own numbers.

The self-check needs the paper’s full text.

Citations

Cites

Research works printed but not linked: 34

  1. 10.1016/j.ijpharm.2020.119491 · DOI
  2. 10.1038/s41573-019-0053-0 · DOI
  3. 10.1038/s41573-020-00135-8 · DOI
  4. 10.1517/17425247.2012.735658 · DOI · Paper page
  5. 10.1021/acs.jcim.7b00414 · DOI · Paper page
  6. 10.1016/j.chempr.2018.01.005 · DOI
  7. 10.1186/s12859-019-2766-9 · DOI
  8. 10.1002/cmdc.201800204 · DOI
  9. 10.1093/bioinformatics/bty1047 · DOI
  10. 10.1038/s41467-018-07717-6 · DOI
  11. 10.1016/j.isci.2018.11.038 · DOI
  12. 10.1002/jcc.20917 · DOI
  13. Kinghorn, A. et al. Progress in the Chemistry of Organic Natural Products 110: Cheminformatics in Natural Product Research. Progress in the Chemistry of Organic Natural Products (Springer International Publishing, 2019). · DOI
  14. 10.1186/s12859-017-1871-x · DOI
  15. 10.1038/s41598-019-56895-w · DOI
  16. 10.7717/peerj.7126 · DOI
  17. 10.1093/bioinformatics/btz328 · DOI
  18. 10.1093/bioinformatics/bty573 · DOI
  19. 10.1038/s41598-018-30044-1 · DOI
  20. 10.1038/s41598-020-68251-4 · DOI
  21. 10.1016/j.bmc.2017.06.052 · DOI · Paper page
  22. 10.1093/nar/gkx1037 · DOI · Paper page
  23. 10.1101/2021.01.22.427866 · DOI
  24. Bepler, T. & Berger, B. Learning protein sequence embeddings using information from structure. In 7th International Conference on Learning Representations, arXiv (2019).
  25. 10.1093/nar/gky1079 · DOI
  26. 10.1109/cibcb.2017.8058545 · DOI
  27. 10.1073/pnas.1808790115 · DOI
  28. 10.1186/1471-2105-10-421 · DOI · Paper page
  29. 10.1016/0167-0115(96)00135-8 · DOI
  30. 10.1093/nar/gkz268 · DOI · Paper page
  31. 10.1038/s41422-020-00442-0 · DOI
  32. 10.1021/acscombsci.0c00003 · DOI
  33. 10.1038/s41467-021-25772-4 · DOI
  34. 10.1093/bib/bbab499 · DOI

Metadata

Authors
Charih, F., Biggar, K. K., & Green, J. R.
Affiliations
Carleton University (CA)
Corresponding author
Green, James R.
Venue
Scientific Reports
Publisher
openRxiv
Published
2021-09-30
Volume
12
Issue
1
Pages
9610-9610
ISSN
2045-2322 (ISSN-L)
OpenAlex
W4281648937
Cited by
12
References
1
Citations by year
2026: 4 · 2025: 4 · 2024: 3 · 2023: 1
FWCI
1.08
Type
journal article
Language
en
Open access
Licence
cc-by
Locations
  • Scientific Reports (publishedVersion, cc-by)
  • bioRxiv (Cold Spring Harbor Laboratory) (acceptedVersion, cc-by)
  • PubMed Central (publishedVersion, cc-by)
  • PubMed (publishedVersion)
  • DOAJ (DOAJ: Directory of Open Access Journals) (submittedVersion, cc-by-sa)
Funders
Natural Sciences and Engineering Research Council of Canada (PGSD‐3, PGSD3-534359-2019)
Topics
  • Life Sciences › Pharmacology, Toxicology and Pharmaceutics › Drug Discovery › Computational Drug Discovery Methods
  • Physical Sciences › Chemistry › Organic Chemistry › Chemical Synthesis and Analysis
  • Life Sciences › Biochemistry, Genetics and Molecular Biology › Molecular Biology › Machine Learning in Bioinformatics
Keywords
protein-protein interaction prediction, in silico peptide design, peptide analogues, de novo peptide design, virtual screening
MeSH terms
Algorithms, Peptides

About these checks

Registry, retraction, Cites and statistics results are computed, not judged, with one exception: a printed reference that no index lists is read once by a model before it counts as a citation error. Claims are extracted by a model and kept only when their quote appears verbatim in the text; each cited source is then checked, with a model’s help, for whether it says what the claim relies on. Those verdicts can be wrong — read the claim’s quote and the cited source before relying on one.

Statistics and arithmetic are recomputed, not judged.

Confidence bands are shown only for fields calibrated on our annotated test set. None is calibrated yet, so no band is shown.

What counts as a claim ›How we measure confidence ›How we check this ›

Are you an author, or do you see a problem with this page? Request a review