Student or educator? Sign up with your school email and get 6 months of Pro free.
PreprintCited by 21Plant Molecular Biology ResearchPlant nutrient uptake and metabolismPlant Parasitism and Resistance

The DOI matches its Crossref record; 1 of the 1 references it cites were found in a registry or an index.

Divergence of trafficking and polarization mechanisms for PIN auxin transporters during land plant evolution

Open access
Tang, Han, Lu, Kuan-Ju, Zhang, YuZhou, Cheng, You-Liang, Tu, Shih-Long, Friml, Jiří·2022·Plant Communications

Preprint — published as 10.1016/j.xplc.2023.100669 · Paper page

Abstract

The phytohormone auxin and its directional transport through tissues play a fundamental role in development of higher plants. This polar auxin transport predominantly relies on PIN-FORMED (PIN) auxin exporters. Hence, PIN polarization is crucial for development, but its evolution during the rise of morphological complexity in land plants remains unclear. Here, we performed a cross-species investigation by observing the trafficking and localization of endogenous and xenologous PINs in two bryophytes, Physcomitrium patens and Marchantia polymorpha , and in the flowering plant Arabidopsis thaliana . We confirmed that the GFP fusion did not compromise the auxin export function of all examined PINs by using radioactive auxin export assay and by observing the phenotypic changes in transgenic bryophytes. Endogenous PINs polarize to filamentous apices, while xenologous Arabidopsis PINs distribute symmetrically on the membrane in both bryophytes. In Arabidopsis root epidermis, bryophytic PINs show no defined polarity. Pharmacological interference revealed a strong cytoskeleton dependence of bryophytic but not Arabidopsis PIN polarization. The divergence of PIN polarization and trafficking is also observed within the bryophyte clade and between tissues in individual species. These results collectively reveal a divergence of PIN trafficking and polarity mechanisms throughout land plant evolution and a co-evolution of PIN sequence-based and cell-based polarity mechanisms.

Overview

The claims and statistics of this paper haven’t been checked yet.

Run the check — free, no account needed. It reads the open-access text and checks the sources it cites.

A few free checks a day · papers already verified open instantly · results are public

Integrity signals

Registry

Crossref · 10.1101/2022.04.28.489888

Cites

1 of 1 references verified0 citation errors · 0 not checkable

Statistics

Figures

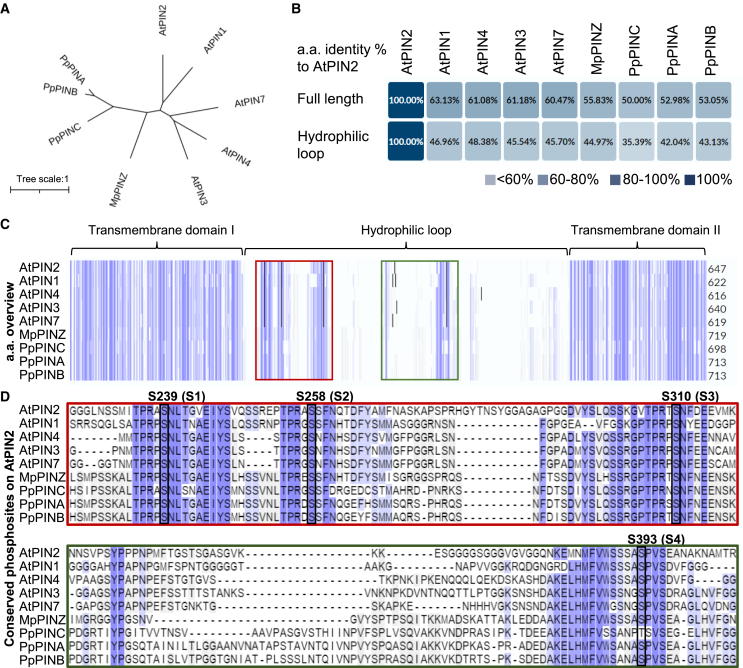
Figure 1 Phosphorylation sites are highly conserved between bryophytic and Arabidopsis PINs. (A) Phylogenetic analysis of canonical PINs from the early-divergent plants P. patens (Pp) and M. polymorpha (Mp) and the representative angiosperm A. thaliana (At). The unrooted tree shows the relationships between different PINs in two representative bryophytes and Arabidopsis. The scale bar represents the number of changes per site. (B) Identity indexes of all PINs compared with AtPIN2 with full-length or only the HL region of coding amino acid sequences. Identity indexes of all PINs compared with AtPIN1 are shown in Supplemental Figure 1. (C) Alignment of PIN amino acid sequences. Identical amino acids are highlighted with blue columns. The red and green boxes highlight the HL regions bearing conserved phosphorylation sites, which are enlarged in (D). (D) Four conserved phosphorylation sites, labeled S1-S4, were verified in previous AtPIN2 studies and are depicted with black frames. Note that S1-S4 are conserved in every examined PIN.
Figure 1 Phosphorylation sites are highly conserved between bryophytic and Arabidopsis PINs. (A) Phylogenetic analysis of canonical PINs from the early-divergent plants P. patens (Pp) and M. polymorpha (Mp) and the representative angiosperm A. thaliana (At). The unrooted tree shows the relationships between different PINs in two representative bryophytes and Arabidopsis. The scale bar represents the number of changes per site. (B) Identity indexes of all PINs compared with AtPIN2 with full-length or only the HL region of coding amino acid sequences. Identity indexes of all PINs compared with AtPIN1 are shown in Supplemental Figure 1. (C) Alignment of PIN amino acid sequences. Identical amino acids are highlighted with blue columns. The red and green boxes highlight the HL regions bearing conserved phosphorylation sites, which are enlarged in (D). (D) Four conserved phosphorylation sites, labeled S1-S4, were verified in previous AtPIN2 studies and are depicted with black frames. Note that S1-S4 are conserved in every examined PIN.CC BY · PubMed Central
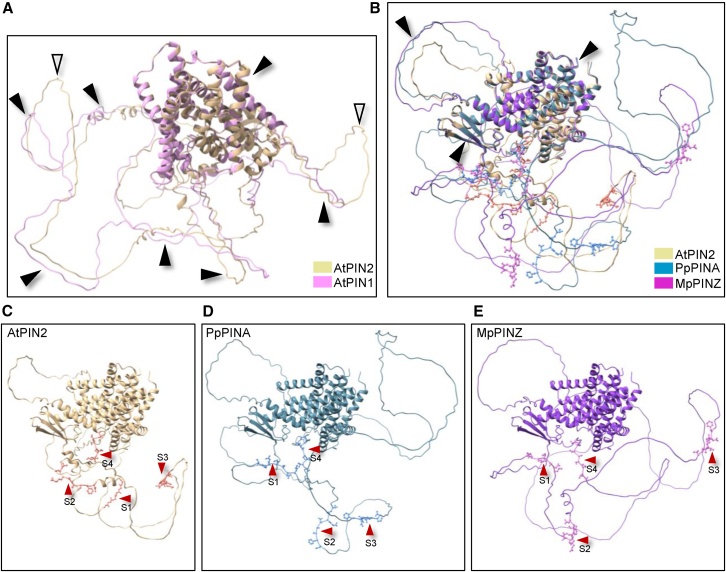
Figure 2 The HL regions in AtPIN2, PpPINA, and MpPINZ are less conserved. (A) Structural alignment of AtPIN1 and AtPIN2. The protein structures were predicted using Alphafold2 and aligned using ChimeraX. The structurally conserved regions are indicated by black arrowheads, and the non-conserved regions are indicated by white arrowheads. (B) Structural alignment of AtPIN2 with PpPINA and MpPINZ. Only the transmembrane domains and a single loop align with each other, while the majority of HL regions are not conserved. The four conserved phosphorylation sites are labeled with atomic details in ball-and-stick style. (C–E) Individual protein structures retrieved from (B). The four conserved phosphorylation sites are indicated by red arrowheads.
Figure 2 The HL regions in AtPIN2, PpPINA, and MpPINZ are less conserved. (A) Structural alignment of AtPIN1 and AtPIN2. The protein structures were predicted using Alphafold2 and aligned using ChimeraX. The structurally conserved regions are indicated by black arrowheads, and the non-conserved regions are indicated by white arrowheads. (B) Structural alignment of AtPIN2 with PpPINA and MpPINZ. Only the transmembrane domains and a single loop align with each other, while the majority of HL regions are not conserved. The four conserved phosphorylation sites are labeled with atomic details in ball-and-stick style. (C–E) Individual protein structures retrieved from (B). The four conserved phosphorylation sites are indicated by red arrowheads.CC BY · PubMed Central
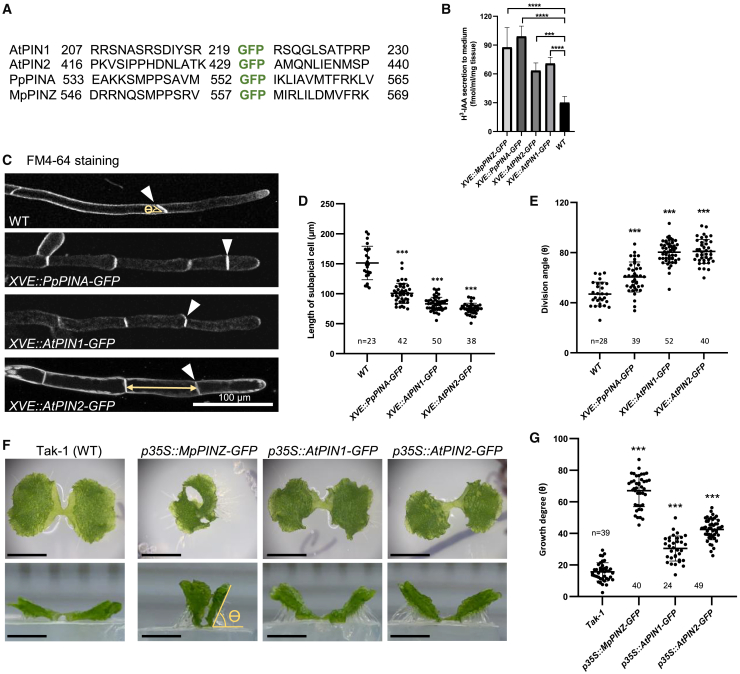
Figure 3 GFP-fused PIN proteins possess auxin export activity. (A) The insertion site of GFP in the indicated PIN proteins. Numbers represent the amino acid position in the respective proteins. (B) The auxin export assay with P. patens transgenic plants. Fresh tissues were cultured in liquid medium supplied with 1μM β-estradiol to induce XVE overexpression. Tissues were then incubated with radioactive H3-IAA followed by washing. Radioactive H3-IAA exported into the new culture medium was measured using a scintillation detector after one day. Wild-type moss plants treated with the same conditions were used as a control. Ten to fifteen 10-day-old moss colonies were used for one measurement, and the graph shows the mean ± SD from four independent experiments. (C) Representative protonema cells of the indicated genetic background. The cell outline was stained with FM4-64. White arrowheads indicate the first cell division plane, and the yellow double arrow indicates the length of the subapical cell. Scale bar, 100 μm. (D and E) Quantification of the subapical cell length and division angle (ϴ) of the indicated lines. Bold horizontal lines indicate the median, and whiskers indicate the first and third quartile. ∗∗∗P < 0.001, Student’s t-test. (F) Top (top panels) and side (bottom panels) views of the indicated M. polymorpha lines. Takaragaike-1 (WT) expands its thallus horizontally on the agar surface. Overexpression of MpPINZ-, AtPIN1-, and AtPIN2-GFP showed vertical thallus growth, which generated a large angle between the lower surface of the thallus and the surface of the agar (Ɵ). Scale bar, 0.5 cm. (G) Quantification of the thallus growth angle (Ɵ) shown in (A). Bold horizontal lines indicate the median, and whiskers indicate the first and third quartile. ∗∗∗P < 0.001, Student’s t-test.
Figure 3 GFP-fused PIN proteins possess auxin export activity. (A) The insertion site of GFP in the indicated PIN proteins. Numbers represent the amino acid position in the respective proteins. (B) The auxin export assay with P. patens transgenic plants. Fresh tissues were cultured in liquid medium supplied with 1μM β-estradiol to induce XVE overexpression. Tissues were then incubated with radioactive H3-IAA followed by washing. Radioactive H3-IAA exported into the new culture medium was measured using a scintillation detector after one day. Wild-type moss plants treated with the same conditions were used as a control. Ten to fifteen 10-day-old moss colonies were used for one measurement, and the graph shows the mean ± SD from four independent experiments. (C) Representative protonema cells of the indicated genetic background. The cell outline was stained with FM4-64. White arrowheads indicate the first cell division plane, and the yellow double arrow indicates the length of the subapical cell. Scale bar, 100 μm. (D and E) Quantification of the subapical cell length and division angle (ϴ) of the indicated lines. Bold horizontal lines indicate the median, and whiskers indicate the first and third quartile. ∗∗∗P < 0.001, Student’s t-test. (F) Top (top panels) and side (bottom panels) views of the indicated M. polymorpha lines. Takaragaike-1 (WT) expands its thallus horizontally on the agar surface. Overexpression of MpPINZ-, AtPIN1-, and AtPIN2-GFP showed vertical thallus growth, which generated a large angle between the lower surface of the thallus and the surface of the agar (Ɵ). Scale bar, 0.5 cm. (G) Quantification of the thallus growth angle (Ɵ) shown in (A). Bold horizontal lines indicate the median, and whiskers indicate the first and third quartile. ∗∗∗P < 0.001, Student’s t-test.CC BY · PubMed Central
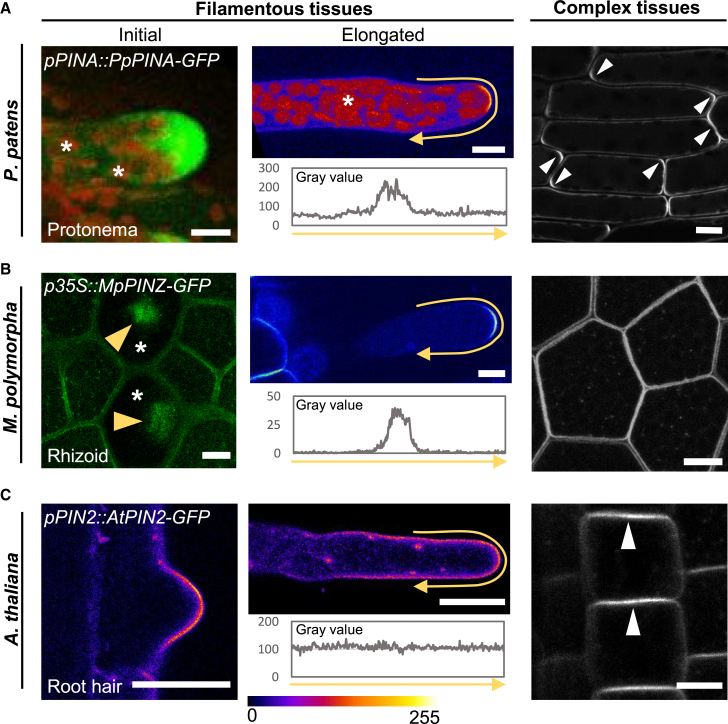
Figure 4 Endogenous PINs present different localization patterns in different tissues. (A) The localization of PpPINA-GFP in tissues with different complexities. PpPINA-GFP is polarized to the tip of initial and elongated protonema cells. The initial protonema cell is regenerated from a detached leaf, and the representative image shows the maximum projection with a 5-μm-thick Z section. Autofluorescence from the chloroplasts is indicated by asterisks. In elongated protonema cells, the polarity of PpPINA-GFP is plotted using an intensity measurement along the PM, as represented by the yellow arrows. The same measurement is applied to (B) and (C). In complex tissues composed of multiple cell layers (e.g. young leaves in P. patens), PpPINA-GFP is polarized at apical and basal domains (white arrowheads). Scale bars, 10 μm. (B) The localization of MpPINZ-GFP in emerging rhizoids, young rhizoids, and gemma epidermal cells. A representative image with a 5-μm-thick Z section at the gemma surface shows the accumulation of MpPINZ-GFP at the tips of emerging rhizoids, as indicated by yellow arrowheads in rhizoid precursor cells (asterisks). MpPINZ-GFP is polarized at the tip of young rhizoids (center). A middle section image shows the even distribution of MpPINZ-GFP on the PM of gemmae composed of multiple cell layers. Scale bars, 10 μm. (C) AtPIN2-GFP shows a polarized signal at the tip of the initial root hair, but the polarized signal is not observed in elongated root hairs. All imaging details are described in the Methods. The pixel values ranging from 0-255 are represented by the rainbow color. In Arabidopsis epidermal cells, AtPIN2-GFP shows apical polarization, as indicated by white arrowheads. Scale bars, 10 μm for root hairs and 1 cm for epidermis.
Figure 4 Endogenous PINs present different localization patterns in different tissues. (A) The localization of PpPINA-GFP in tissues with different complexities. PpPINA-GFP is polarized to the tip of initial and elongated protonema cells. The initial protonema cell is regenerated from a detached leaf, and the representative image shows the maximum projection with a 5-μm-thick Z section. Autofluorescence from the chloroplasts is indicated by asterisks. In elongated protonema cells, the polarity of PpPINA-GFP is plotted using an intensity measurement along the PM, as represented by the yellow arrows. The same measurement is applied to (B) and (C). In complex tissues composed of multiple cell layers (e.g. young leaves in P. patens), PpPINA-GFP is polarized at apical and basal domains (white arrowheads). Scale bars, 10 μm. (B) The localization of MpPINZ-GFP in emerging rhizoids, young rhizoids, and gemma epidermal cells. A representative image with a 5-μm-thick Z section at the gemma surface shows the accumulation of MpPINZ-GFP at the tips of emerging rhizoids, as indicated by yellow arrowheads in rhizoid precursor cells (asterisks). MpPINZ-GFP is polarized at the tip of young rhizoids (center). A middle section image shows the even distribution of MpPINZ-GFP on the PM of gemmae composed of multiple cell layers. Scale bars, 10 μm. (C) AtPIN2-GFP shows a polarized signal at the tip of the initial root hair, but the polarized signal is not observed in elongated root hairs. All imaging details are described in the Methods. The pixel values ranging from 0-255 are represented by the rainbow color. In Arabidopsis epidermal cells, AtPIN2-GFP shows apical polarization, as indicated by white arrowheads. Scale bars, 10 μm for root hairs and 1 cm for epidermis.CC BY · PubMed Central
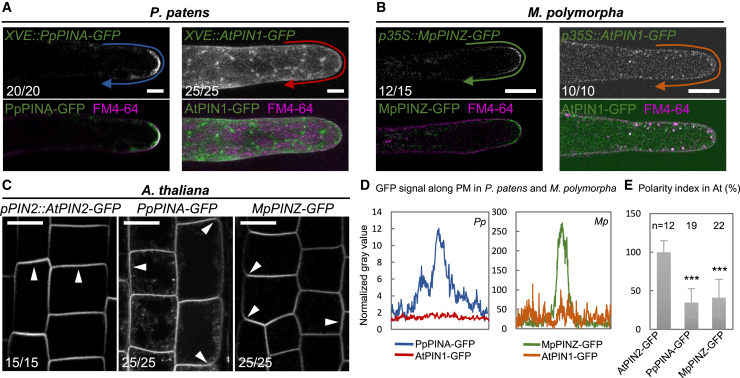
Figure 5 Exogenous PINs are PM-localized with no defined polarity. (A) Overexpressed PpPINA-GFP is polarized to the tip of protonemata, but overexpressed AtPIN1-GFP is evenly distributed on the PM with intracellular puncta. The PM is stained with the membrane dye FM4-64. The occurrence frequency is indicated in the bottom left corner of each image. Scale bars, 10 μm. (B) Overexpressed MpPINZ-GFP is polarized to the tip of young rhizoids, while overexpressed AtPIN1-GFP shows strong cytosolic signals and weak PM localization with no polarity. The PM is stained with the membrane dye FM4-64. Scale bars, 10 μm. (C) AtPIN2-GFP under its native promoter localizes to the apical side of epidermal cells, but PpPINA-GFP and MpPINZ-GFP are mislocalized to the basal and lateral sites, as indicated by white arrowheads. Scale bar, 1 cm. (D) Intensity plots of representative images for PpPINA-GFP, AtPIN1-GFP in P. patens protonema cells, and MpPINZ-GFP and AtPIN1-GFP in M. polymorpha young rhizoids. (E) Polarity index (ratio of signal intensity at the apical PM/signal intensity at the lateral PM) for apical localization of the indicated PIN-GFP in Arabidopsis epidermal cells. PpPINA-GFP and MpPINZ-GFP are significantly lower on the polarity index. Shown are 12-22 cells from three roots in three independent experiments for each line. ∗∗∗P < 0.001, Student’s t-test.
Figure 5 Exogenous PINs are PM-localized with no defined polarity. (A) Overexpressed PpPINA-GFP is polarized to the tip of protonemata, but overexpressed AtPIN1-GFP is evenly distributed on the PM with intracellular puncta. The PM is stained with the membrane dye FM4-64. The occurrence frequency is indicated in the bottom left corner of each image. Scale bars, 10 μm. (B) Overexpressed MpPINZ-GFP is polarized to the tip of young rhizoids, while overexpressed AtPIN1-GFP shows strong cytosolic signals and weak PM localization with no polarity. The PM is stained with the membrane dye FM4-64. Scale bars, 10 μm. (C) AtPIN2-GFP under its native promoter localizes to the apical side of epidermal cells, but PpPINA-GFP and MpPINZ-GFP are mislocalized to the basal and lateral sites, as indicated by white arrowheads. Scale bar, 1 cm. (D) Intensity plots of representative images for PpPINA-GFP, AtPIN1-GFP in P. patens protonema cells, and MpPINZ-GFP and AtPIN1-GFP in M. polymorpha young rhizoids. (E) Polarity index (ratio of signal intensity at the apical PM/signal intensity at the lateral PM) for apical localization of the indicated PIN-GFP in Arabidopsis epidermal cells. PpPINA-GFP and MpPINZ-GFP are significantly lower on the polarity index. Shown are 12-22 cells from three roots in three independent experiments for each line. ∗∗∗P < 0.001, Student’s t-test.CC BY · PubMed Central
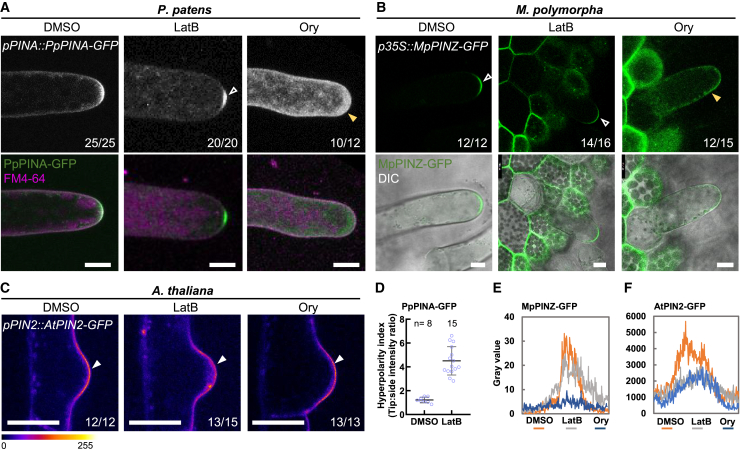
Figure 6 Cytoskeletal networks are important for the polarization of bryophytic PINs. (A) PpPINA-GFP is polarized to the tip of protonemata, and disruption of actin filaments with latrunculin (LatB) induced its hyperpolarization (white arrowhead). Disruption of microtubules by oryzalin (Ory) disturbed the polarization of PpPINA-GFP (yellow arrowhead). The occurrence frequency is indicated in the bottom right corner of each image. For P. patens and A. thaliana, tissues were treated with 20 μM LatB or 5 μM Ory for 4 h. Scale bars, 10 μm. (B) MpPINZ-GFP is polarized to the tip of young rhizoids (white arrowheads), and its polarization was only abolished by Ory treatment (yellow arrowhead). The gemmae were treated with 2 μM LatB or 10 μM Ory for 2 h. Scale bars, 10 μm. (C) AtPIN2-GFP is polarized to the tip of initial root hair cells, and disruption of either actin filaments or microtubules did not change its polarization (white arrowheads) but did attenuate the peak signal at the tips, as shown in (F). The pixel values ranging from 0-255 are represented by the rainbow color. Scale bars, 10 μm. (D) The hyperpolarity index of PpPINA-GFP treated with DMSO or LatB was calculated by dividing the intensity at the very tip by the intensity at the curvature side of the tip. (E and F) Intensity plots of representative images for MpPINZ-GFP and AtPIN2-GFP along the tips of the rhizoids in M. polymorpha and root hairs in A. thaliana.
Figure 6 Cytoskeletal networks are important for the polarization of bryophytic PINs. (A) PpPINA-GFP is polarized to the tip of protonemata, and disruption of actin filaments with latrunculin (LatB) induced its hyperpolarization (white arrowhead). Disruption of microtubules by oryzalin (Ory) disturbed the polarization of PpPINA-GFP (yellow arrowhead). The occurrence frequency is indicated in the bottom right corner of each image. For P. patens and A. thaliana, tissues were treated with 20 μM LatB or 5 μM Ory for 4 h. Scale bars, 10 μm. (B) MpPINZ-GFP is polarized to the tip of young rhizoids (white arrowheads), and its polarization was only abolished by Ory treatment (yellow arrowhead). The gemmae were treated with 2 μM LatB or 10 μM Ory for 2 h. Scale bars, 10 μm. (C) AtPIN2-GFP is polarized to the tip of initial root hair cells, and disruption of either actin filaments or microtubules did not change its polarization (white arrowheads) but did attenuate the peak signal at the tips, as shown in (F). The pixel values ranging from 0-255 are represented by the rainbow color. Scale bars, 10 μm. (D) The hyperpolarity index of PpPINA-GFP treated with DMSO or LatB was calculated by dividing the intensity at the very tip by the intensity at the curvature side of the tip. (E and F) Intensity plots of representative images for MpPINZ-GFP and AtPIN2-GFP along the tips of the rhizoids in M. polymorpha and root hairs in A. thaliana.CC BY · PubMed Central

Verification

Claims the paper makes

The claims and statistics of this paper haven’t been checked yet.

Run the check — free, no account needed. It reads the open-access text and checks the sources it cites.

A few free checks a day · papers already verified open instantly · results are public

Self-check

Percentages, sums and reported differences re-computed from the paper’s own numbers.

The self-check needs the paper’s full text.

Citations

Cites

Research works printed but not linked: 62

  1. 10.1038/ncb1369 · DOI
  2. 10.1105/tpc.114.134874 · DOI
  3. 10.1006/dbio.2000.0115 · DOI
  4. 10.1016/j.tplants.2018.03.009 · DOI
  5. 10.1093/oxfordjournals.pcp.a078679 · DOI
  6. 10.1016/j.cub.2014.09.054 · DOI
  7. 10.1146/annurev-arplant-050718-100309 · DOI
  8. 10.1073/pnas.1424856112 · DOI
  9. 10.1007/s10265-012-0496-4 · DOI
  10. Floriach-Clark, J. , Tang, H. , and Willemsen, V. (2021). Mosses: Accessible Systems for Plant Development Studies. In Model Organisms in Plant Genetics, (IntechOpen. · DOI
  11. 10.1101/cshperspect.a039859 · DOI
  12. 10.1126/science.1100618 · DOI · Paper page
  13. 10.1038/35096571 · DOI
  14. 10.1038/s41477-018-0318-3 · DOI
  15. 10.3390/biom9060222 · DOI
  16. 10.1371/journal.pone.0138876 · DOI
  17. 10.1093/bioinformatics/8.3.275 · DOI
  18. 10.1093/jxb/erx267 · DOI
  19. 10.1093/pcp/pcx095 · DOI
  20. 10.1093/mp/ssn062 · DOI
  21. 10.1016/j.cub.2008.03.021 · DOI
  22. 10.1038/msb.2011.72 · DOI
  23. 10.1186/gb-2009-10-12-249 · DOI
  24. 10.1371/journal.pone.0077356 · DOI
  25. 10.1271/bbb.120700 · DOI
  26. 10.1093/molbev/msy096 · DOI · Paper page
  27. 10.7554/eLife.13325 · DOI
  28. 10.1038/nprot.2009.1 · DOI
  29. 10.1104/pp.17.00765 · DOI · Paper page
  30. 10.1016/j.cell.2007.07.033 · DOI · Paper page
  31. 10.1146/annurev.cellbio.23.090506.123214 · DOI · Paper page
  32. 10.1105/tpc.112.098509 · DOI
  33. 10.7554/eLife.52067 · DOI
  34. 10.1093/plphys/kiab134 · DOI
  35. 10.1093/dnares/7.1.9 · DOI
  36. 10.1093/pcp/pcp031 · DOI
  37. 10.1186/s12870-015-0685-0 · DOI
  38. 10.1242/dev.154617 · DOI
  39. 10.1002/pro.3943 · DOI
  40. 10.1105/tpc.19.00828 · DOI
  41. 10.1242/dev.168088 · DOI
  42. 2002, Preparing high-quality DNA from moss (Physcomitrella patens), Plant Molecular Biology Reporter, 20, 423, 10.1007/BF02772133 · DOI
  43. 10.1093/pcp/pcv192 · DOI
  44. 10.1038/s41477-019-0542-5 · DOI
  45. 10.1016/j.pbi.2015.10.001 · DOI
  46. 10.1104/pp.108.131607 · DOI
  47. 10.1111/nph.16276 · DOI
  48. 10.1111/nph.15039 · DOI
  49. 10.1038/s41586-022-04883-y · DOI
  50. 10.1016/j.cell.2009.03.001 · DOI
  51. 10.1016/j.tplants.2012.08.009 · DOI
  52. 10.1016/j.cub.2014.09.056 · DOI
  53. 10.1371/journal.pone.0005744 · DOI
  54. 10.1242/dev.02027 · DOI
  55. 10.1126/science.1121356 · DOI
  56. 10.1007/978-1-4939-3542-0_17 · DOI · Paper page
  57. 10.1038/s41586-022-05143-9 · DOI
  58. 10.1111/jipb.13225 · DOI
  59. 10.1073/pnas.0909460107 · DOI
  60. 10.1038/s41467-019-11471-8 · DOI
  61. 10.7554/eLife.02860 · DOI
  62. 10.3389/fpls.2019.00985 · DOI

Metadata

Authors
Tang, H., Lu, K.-J., Zhang, Y., Cheng, Y.-L., Tu, S.-L., & Friml, J.
Affiliations
  • Institute of Science and Technology Austria (AT)
  • National Chung Hsing University (TW)
  • Northwest A&F University (CN)
  • Institute of Plant and Microbial Biology, Academia Sinica (TW)
Venue
Plant Communications
Publisher
openRxiv
Published
2022-04-30
Volume
5
Issue
1
Pages
100669-100669
ISSN
2590-3462 (ISSN-L)
OpenAlex
W4385431171
Cited by
21
References
1
Citations by year
2026: 4 · 2025: 5 · 2024: 11 · 2023: 1
FWCI
3.31
Type
journal article
Language
en
Open access
Licence
cc-by-nc-nd
Locations
  • Plant Communications (publishedVersion, cc-by-nc-nd)
  • bioRxiv (Cold Spring Harbor Laboratory) (acceptedVersion, cc-by-nc-nd)
  • PubMed Central (publishedVersion, cc-by)
  • PubMed (publishedVersion)
Funders
  • National Science and Technology Council
  • Ministry of Science and Technology (110-2636-B-005-001)
  • European Research Council (ETAP-742985)
  • H2020 European Research Council
Topics
  • Life Sciences › Agricultural and Biological Sciences › Plant Science › Plant Molecular Biology Research
  • Life Sciences › Agricultural and Biological Sciences › Plant Science › Plant nutrient uptake and metabolism
  • Life Sciences › Agricultural and Biological Sciences › Plant Science › Plant Parasitism and Resistance
Keywords
PIN auxin transporters, polar auxin transport, land plant evolution, bryophytes, Physcomitrella patens, Marchantia polymorpha, Arabidopsis thaliana, cytoskeleton, GFP fusion protein, root epidermis, apical polarity, exogenous auxin
MeSH terms
Indoleacetic Acids, Arabidopsis, Plant Roots, Membrane Transport Proteins, Arabidopsis Proteins

About these checks

Registry, retraction, Cites and statistics results are computed, not judged, with one exception: a printed reference that no index lists is read once by a model before it counts as a citation error. Claims are extracted by a model and kept only when their quote appears verbatim in the text; each cited source is then checked, with a model’s help, for whether it says what the claim relies on. Those verdicts can be wrong — read the claim’s quote and the cited source before relying on one.

Statistics and arithmetic are recomputed, not judged.

Confidence bands are shown only for fields calibrated on our annotated test set. None is calibrated yet, so no band is shown.

What counts as a claim ›How we measure confidence ›How we check this ›

Are you an author, or do you see a problem with this page? Request a review

Data sources

Bibliographic data: Semantic Scholar, OpenAlex, Crossref.

Contains information from the Semantic Scholar Academic Graph Datasets, made available under the ODC Attribution License (ODC-BY 1.0).

Semantic Scholar’s data is described in: Kinney, R., et al. (2023). The Semantic Scholar Open Data Platform. arXiv:2301.10140.