

The DOI matches its Crossref record; 1 of the 1 references it cites were found in a registry or an index.
ICAN: interpretable cross-attention network for identifying drug and target protein interactions
Open accessPreprint — published as 10.1371/journal.pone.0276609
Abstract
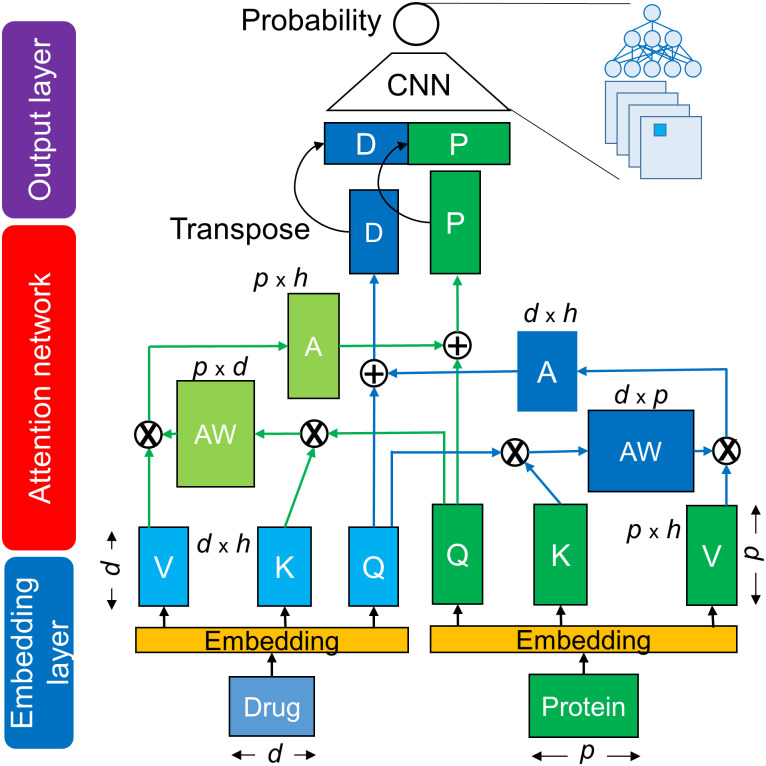
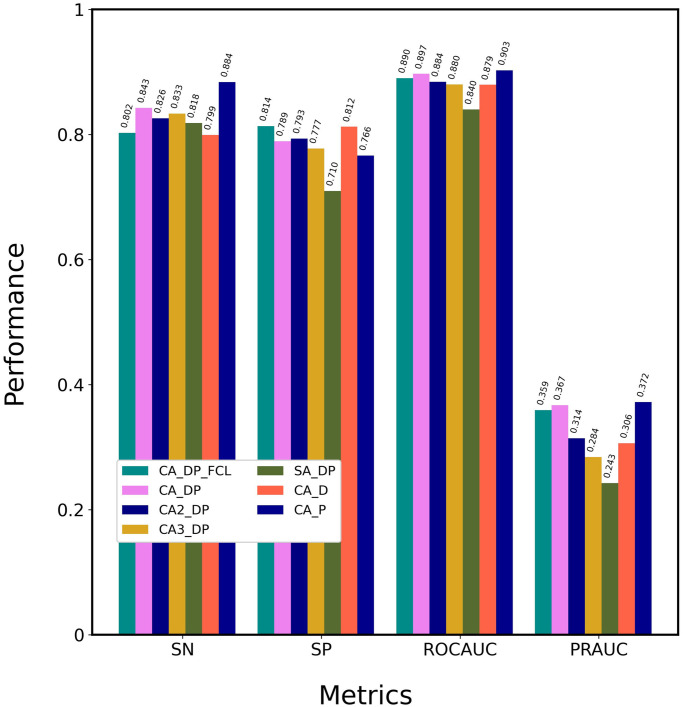
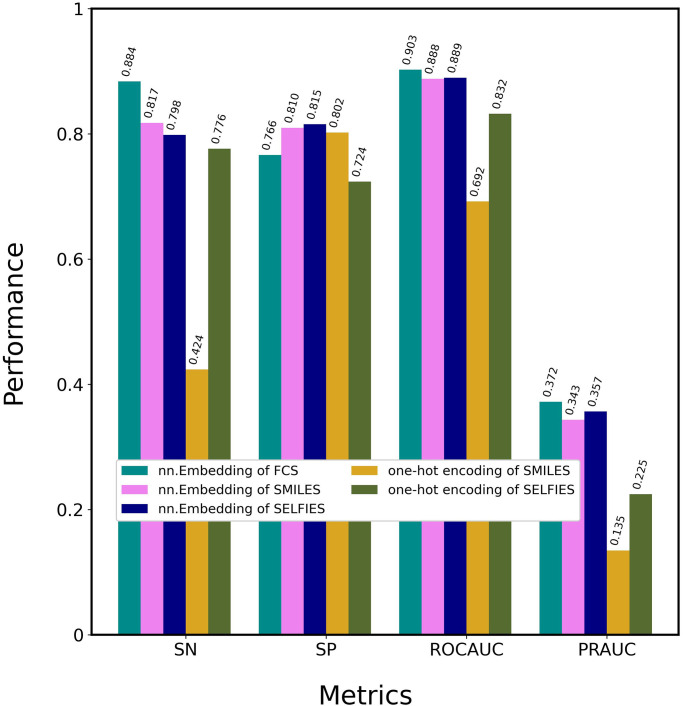
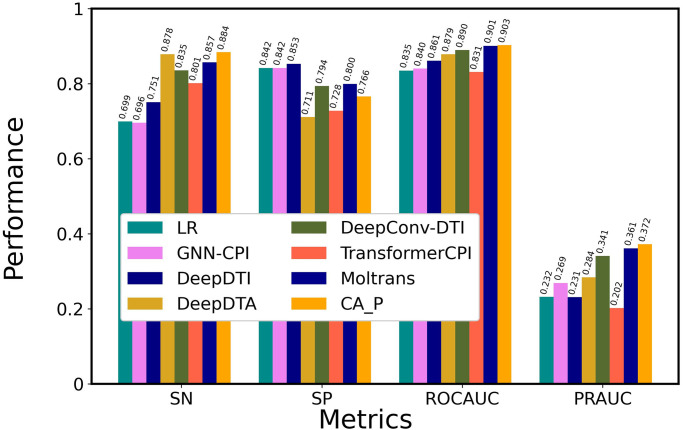
Drug–target protein interaction (DTI) identification is fundamental for drug discovery and drug repositioning, because therapeutic drugs act on disease-causing proteins. However, the DTI identification process often requires expensive and time-consuming tasks, including biological experiments involving large numbers of candidate compounds. Thus, a variety of computation approaches have been developed. Of the many approaches available, chemo-genomics feature-based methods have attracted considerable attention. These methods compute the feature descriptors of drugs and proteins as the input data to train machine and deep learning models to enable accurate prediction of unknown DTIs. In addition, attention-based learning methods have been proposed to identify and interpret DTI mechanisms. However, improvements are needed for enhancing prediction performance and DTI mechanism elucidation. To address these problems, we developed an attention-based method designated the interpretable cross-attention network (ICAN), which predicts DTIs using the Simplified Molecular Input Line Entry System of drugs and amino acid sequences of target proteins. We optimized the attention mechanism architecture by exploring the cross-attention or self-attention, attention layer depth, and selection of the context matrixes from the attention mechanism. We found that a plain attention mechanism that decodes drug-related protein context features without any protein-related drug context features effectively achieved high performance. The ICAN outperformed state-of-the-art methods in several respects and revealed with statistical significance that some weighted sites in the cross-attention weight represent experimental binding sites, thus demonstrating the high interpretability of the results. Key points: We created the interpretable cross-attention network (ICAN), which is composed of nn.Embedding of FCS label-encoding vectors of SMILES of drugs and AA sequences of target proteins, cross-attention mechanisms, and a CNN output layer. ICAN decoded drug-related protein context features without any protein-related drug context features, achieving high prediction performance despite the plain attention mechanism. In comparison with seven state-of-the-art methods, ICAN provided the highest PRAUC for the imbalanced datasets (DAVIS and BindingDB). Statistical analysis of attention-weight matrixes revealed that some weighted attention sites corresponded to experimental binding sites, demonstrating the high interpretability achievable with ICAN.
Overview
The claims and statistics of this paper haven’t been checked yet.
Run the check — free, no account needed. It reads the open-access text and checks the sources it cites.
Integrity signals
Registry
Cites
Statistics
Figures
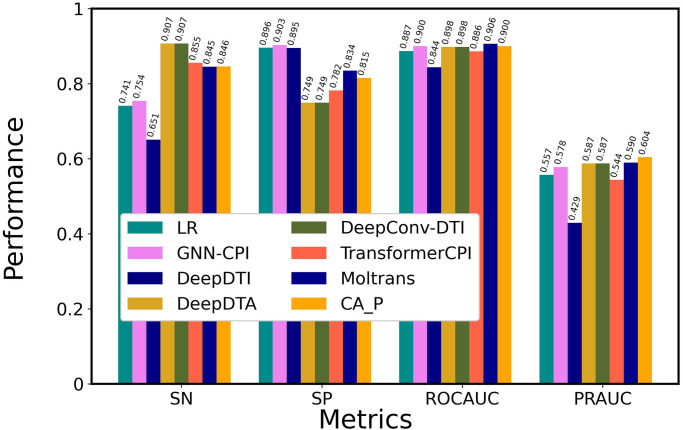
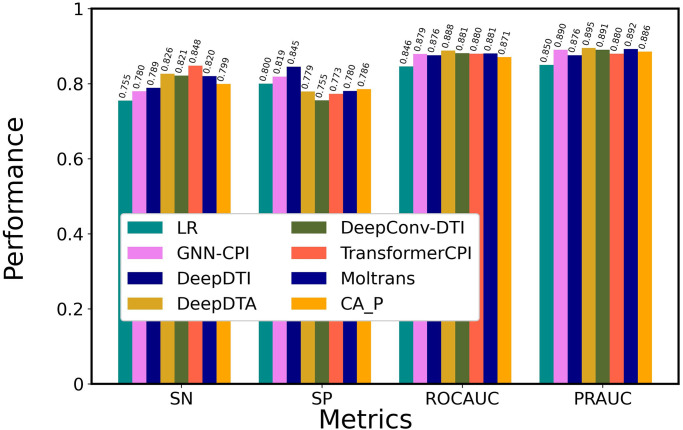
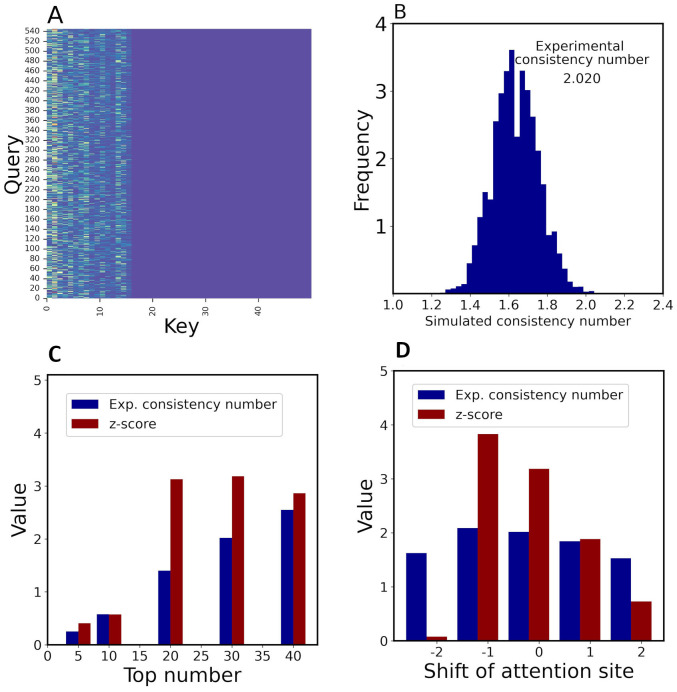
Verification
Claims the paper makes
The claims and statistics of this paper haven’t been checked yet.
Run the check — free, no account needed. It reads the open-access text and checks the sources it cites.
Self-check
Percentages, sums and reported differences re-computed from the paper’s own numbers.
The self-check needs the paper’s full text.
Citations
Cites
Highly accurate protein structure prediction with AlphaFold
Jumper, J., Evans, R., Pritzel, A., Green, T., Figurnov, M., Ronneberger, O., Tunyasuvunakool, K., Bates, R., Žídek, A., Potapenko, A., et al. (2021) · Nature · doi:10.1038/s41586-021-03819-2 · Cited by 43,764
Research works printed but not linked: 42
- 10.1038/384014a0 · DOI
- 2019, Computational prediction of drug-target interactions using chemogenomic approaches: an empirical survey, Brief Bioinform, 20, 1337, 10.1093/bib/bby002 · DOI
- 10.1093/bioinformatics/btn162 · DOI
- 10.1093/bib/bbt056 · DOI
- 10.1093/bib/bbu010 · DOI
- 10.1093/bioinformatics/bts360 · DOI
- Zheng X. Collaborative matrix factorization with multiple similarities for predicting drug-target interactions. In: KDD. Chicago, 2013. · DOI
- 2017, Drug-Target Interaction Prediction with Graph Regularized Matrix Factorization, IEEE/ACM Trans Comput Biol Bioinform, 14, 646, 10.1109/TCBB.2016.2530062 · DOI
- 10.1021/acs.jproteome.6b00618 · DOI
- 10.1021/ci100050t · DOI
- Bolton EE . Pubchem: integrated platform of small molecules and biological activities. Annual Reports in Computational Chemistry. Elsevier, 2008, 217–241. · DOI
- 10.1073/pnas.92.19.8700 · DOI
- 10.1093/bioinformatics/btaa524 · DOI · Paper page
- 10.1371/journal.pone.0037608 · DOI
- 2021, Machine learning approaches and databases for prediction of drug-target interaction: a survey paper, Brief Bioinform, 22, 247, 10.1093/bib/bbz157 · DOI
- 10.1186/s13321-017-0209-z · DOI
- 2016, Drug-target interaction prediction via class imbalance-aware ensemble learning, BMC Bioinformatics, 17, 509, 10.1186/s12859-016-1377-y · DOI
- 2021, DTI-SNNFRA: Drug-target interaction prediction by shared nearest neighbors and fuzzy-rough approximation, PLoS One, 16, e0246920, 10.1371/journal.pone.0246920 · DOI
- Hamanaka M , Taneishi K , Iwata H et al. CGBVS-DNN: Prediction of Compound-protein Interactions Based on Deep Learning, Mol Inform 2017;36. · DOI
- 2022, HGDTI: predicting drug-target interaction by using information aggregation based on heterogeneous graph neural network, BMC Bioinformatics, 23, 126, 10.1186/s12859-022-04655-5 · DOI
- 2020, DeepCDA: deep cross-domain compoundprotein affinity prediction through LSTM and convolutional neural networks, Bioinformatics, 36, 4633, 10.1093/bioinformatics/btaa544 · DOI
- 10.1093/bioinformatics/bty593 · DOI
- 10.1162/neco.2008.12-07-661 · DOI
- 10.1371/journal.pcbi.1007129 · DOI
- 10.1093/bioinformatics/btz111 · DOI
- 2019, Compound-protein interaction prediction with end-to-end learning of neural networks for graphs and sequences, Bioinformatics, 35, 309, 10.1093/bioinformatics/bty535 · DOI · Paper page
- 2021, GraphDTA: predicting drug-target binding affinity with graph neural networks, Bioinformatics, 37, 1140, 10.1093/bioinformatics/btaa921 · DOI
- 10.1109/TNN.2008.2005605 · DOI · Paper page
- 10.1021/acs.jcim.9b00387 · DOI
- Kipf T , Welling M. Semi-supervised classification with graph convolutional networks. 5th International Conference on Learning Representations. 2017, 1–14.
- 10.1021/acs.jcim.9b00628 · DOI · Paper page
- 10.1093/bioinformatics/btaa880 · DOI
- 10.1038/nbt.1990 · DOI · Paper page
- 10.1093/nar/gkl999 · DOI
- 10.1093/nar/gkm958 · DOI
- 10.1021/ci00057a005 · DOI · Paper page
- 2020, Self-Referencing Embedded Strings (SELFIES): A 100% robust molecular string representation, Machine Learning: Science and Technology, 1, 045024
- Sennrich R , Haddow B , Birch A. Neural Machine Translation of Rare Words with Subword Units. 2016, p. 1715–1725. Association for Computational Linguistics. · DOI · Paper page
- 1994, A new algorithm for data compression, C Users J, 12, 23
- 10.1093/bioinformatics/btr120 · DOI
- Paszke A , Gross S , Massa F et al. PyTorch: An Imperative Style, High-Performance Deep Learning Library, 33rd Conference on Neural Information Processing Systems (NeurIPS 2019), Vancouver, Canada 2019:1–12.
- 10.1093/bioinformatics/btt072 · DOI
Metadata
- Authors
- Kurata, H., & Tsukiyama, S.
- Affiliations
- Kyushu Institute of Technology (JP)
- Corresponding author
- Kurata, Hiroyuki
- Venue
- PLoS ONE
- Publisher
- openRxiv
- Published
- 2022-08-06
- Volume
- 17
- Issue
- 10
- Pages
- e0276609-e0276609
- ISSN
- 1932-6203 (ISSN-L)
- PMC
- PMC9591068
- OpenAlex
- W4307171284
- Cited by
- 19
- References
- 1
- Citations by year
- 2026: 3 · 2025: 7 · 2024: 4 · 2023: 4 · 2022: 1
- FWCI
- 2.16
- Type
- journal article
- Language
- en
- Open access
- gold
- doi.org
- Licence
- cc-by
- Locations
- PLoS ONE (publishedVersion, cc-by)
- bioRxiv (Cold Spring Harbor Laboratory) (acceptedVersion, cc-by-nc)
- PubMed Central (publishedVersion, cc-by)
- PubMed (publishedVersion)
- DOAJ (DOAJ: Directory of Open Access Journals) (submittedVersion, cc-by-sa)
- Funders
- Japan Society for the Promotion of Science (23K24943, 22J22706, 22H03688, 22KJ2495)
- Topics
- Life Sciences › Pharmacology, Toxicology and Pharmaceutics › Drug Discovery › Computational Drug Discovery Methods
- Life Sciences › Biochemistry, Genetics and Molecular Biology › Molecular Biology › Machine Learning in Bioinformatics
- Life Sciences › Biochemistry, Genetics and Molecular Biology › Molecular Biology › Bioinformatics and Genomic Networks
- Keywords
- cross-attention, model interpretability, binding site identification, drug repurposing, DAVIS dataset
- MeSH terms
- Amino Acid Sequence, Computer Simulation, Drug Interactions, Proteins, Drug Discovery, Drug Repositioning
About these checks
Registry, retraction, Cites and statistics results are computed, not judged, with one exception: a printed reference that no index lists is read once by a model before it counts as a citation error. Claims are extracted by a model and kept only when their quote appears verbatim in the text; each cited source is then checked, with a model’s help, for whether it says what the claim relies on. Those verdicts can be wrong — read the claim’s quote and the cited source before relying on one.
Statistics and arithmetic are recomputed, not judged.
Confidence bands are shown only for fields calibrated on our annotated test set. None is calibrated yet, so no band is shown.
What counts as a claim ›How we measure confidence ›How we check this ›
Are you an author, or do you see a problem with this page? Request a review
