

The DOI matches its Crossref record; 57 of the 57 references it cites were found in a registry or an index.
GenSLMs: Genome-scale language models reveal SARS-CoV-2 evolutionary dynamics
Open accessPreprint — published as 10.1177/10943420231201154 · Paper page
Abstract
We seek to transform how new and emergent variants of pandemiccausing viruses, specifically SARS-CoV-2, are identified and classified. By adapting large language models (LLMs) for genomic data, we build genome-scale language models (GenSLMs) which can learn the evolutionary landscape of SARS-CoV-2 genomes. By pretraining on over 110 million prokaryotic gene sequences and finetuning a SARS-CoV-2-specific model on 1.5 million genomes, we show that GenSLMs can accurately and rapidly identify variants of concern. Thus, to our knowledge, GenSLMs represents one of the first whole genome scale foundation models which can generalize to other prediction tasks. We demonstrate scaling of GenSLMs on GPU-based supercomputers and AI-hardware accelerators utilizing 1.63 Zettaflops in training runs with a sustained performance of 121 PFLOPS in mixed precision and peak of 850 PFLOPS. We present initial scientific insights from examining GenSLMs in tracking evolutionary dynamics of SARS-CoV-2, paving the path to realizing this on large biological data.
Overview
The claims and statistics of this paper haven’t been checked yet.
Run the check — free, no account needed. It reads the open-access text and checks the sources it cites.
Integrity signals
Registry
Cites
Statistics
Figures
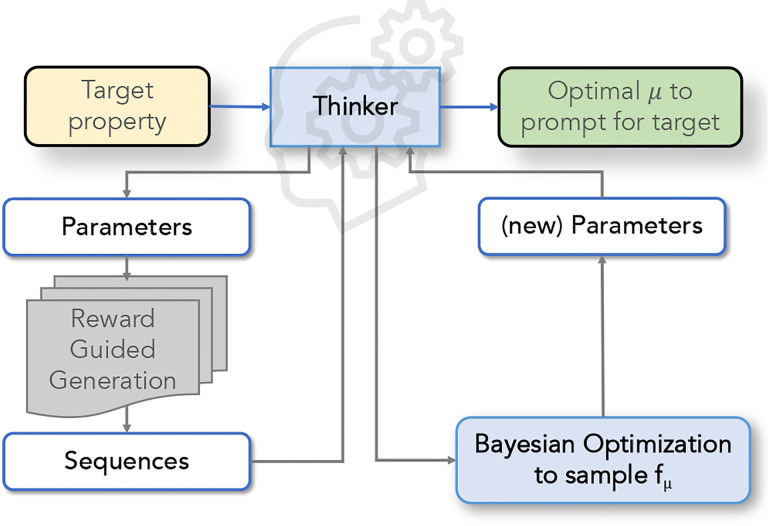
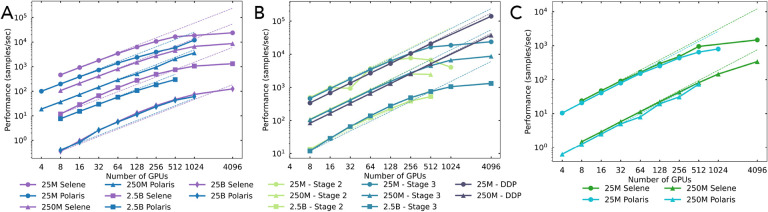
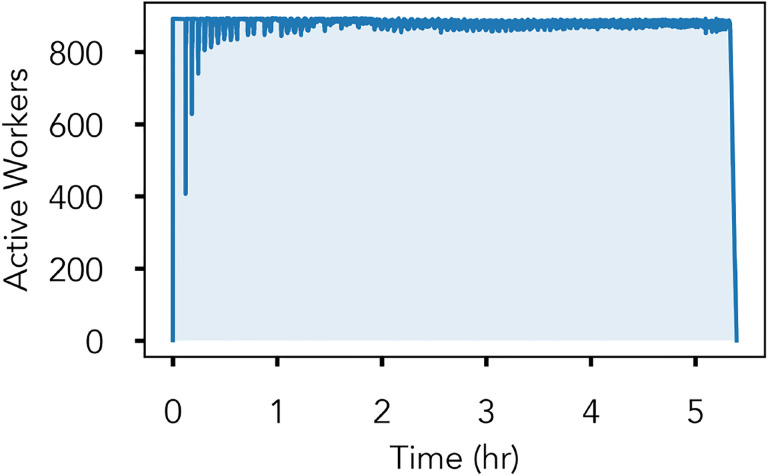
Verification
Claims the paper makes
The claims and statistics of this paper haven’t been checked yet.
Run the check — free, no account needed. It reads the open-access text and checks the sources it cites.
Self-check
Percentages, sums and reported differences re-computed from the paper’s own numbers.
The self-check needs the paper’s full text.
Citations
Cites
BERT: Pre-training of Deep Bidirectional Transformers for Language Understanding
Devlin, J., Chang, M.-W., Lee, K., & Toutanova, K. (2018) · arXiv · doi:10.48550/arxiv.1810.04805 · Cited by 73,173
Highly accurate protein structure prediction with AlphaFold
Jumper, J., Evans, R., Pritzel, A., Green, T., Figurnov, M., Ronneberger, O., Tunyasuvunakool, K., Bates, R., Žídek, A., Potapenko, A., et al. (2021) · Nature · doi:10.1038/s41586-021-03819-2 · Cited by 43,764
RAxML version 8: a tool for phylogenetic analysis and post-analysis of large phylogenies
Stamatakis, A. (2014) · Bioinformatics · doi:10.1093/bioinformatics/btu033 · Cited by 32,291
Advances in Neural Information Processing Systems 19
(2007) · The MIT Press eBooks · doi:10.52202/085713 · Cited by 16,043
Advances in Neural Information Processing Systems 29
Teymur, O., Zygalakis, K., & Calderhead, B. (2016) · Cited by 13,881
Needleman, S. B., & Wunsch, C. D. (1970) · Journal of Molecular Biology · doi:10.1016/0022-2836(70)90057-4 · Cited by 11,288
Scaling Laws for Neural Language Models
Kaplan, J., McCandlish, S., Henighan, T., Brown, T. B., Chess, B., Child, R., Gray, S., Radford, A., Wu, J., & Amodei, D. (2020) · arXiv · doi:10.48550/arxiv.2001.08361 · Cited by 9,550 · cited 2×
“3B requires fewer training samples than the smaller GenSLM-123M to achieve comparable validation metrics, following the sample efficiency observation in neural language model scaling laws (Kaplan et al., 2020).”
MethodDenoising Diffusion Probabilistic Models
Ho, J., Jain, A., & Abbeel, P. (2020) · arXiv · doi:10.48550/arxiv.2006.11239 · Cited by 8,712
Evolutionary-scale prediction of atomic level protein structure with a language model
Lin, Z., Akin, H., Rao, R., Hie, B., Zhu, Z., Lu, W., Smetanin, N., Verkuil, R., Kabeli, O., Shmueli, Y., et al. (2022) · doi:10.1101/2022.07.20.500902 · Cited by 5,990
Han (2023) · doi:10.1109/tpami.2022.3152247 · Cited by 4,682
Research works printed but not linked: 4
- Jacob Devlin , Ming-Wei Chang , Kenton Lee , and Kristina Toutanova . 2018. Bert: Pretraining of deep bidirectional transformers for language understanding. arXiv preprintarXiv:1810.04805 (2018).
- 10.1101/2020.03.21.990770 · DOI
- Philipp Moritz , Robert Nishihara , Stephanie Wang , Alexey Tumanov , Richard Liaw , Eric Liang , Melih Elibol , Zongheng Yang , William Paul , Michael I. Jordan , and Ion Stoica . 2018. Ray: A Distributed Framework for Emerging AI Applications. In 13th USENIX Symposium on Operating Systems Design and Implementation (OSDI 18). USENIX Association, Carlsbad, CA, 561–577. https://www.usenix.org/conference/osdi18/presentation/moritz
- Rose E Wang , Esin Durmus , Noah Goodman , and Tatsunori Hashimoto . 2022. Language modeling via stochastic processes. In International Conference on Learning Representations.
Cited by
Sorted by citations
Foundation models for generalist medical artificial intelligence
Moor, M., Banerjee, O., Abad, Z. S. H., Krumholz, H. M., Leskovec, J., Topol, E. J., & Rajpurkar, P. (2023) · Nature · doi:10.1038/s41586-023-05881-4 · Cited by 2,028
Nucleotide Transformer: building and evaluating robust foundation models for human genomics
Dalla-Torre, H., Gonzalez, L., Mendoza-Revilla, J., Lopez Carranza, N., Grzywaczewski, A. H., Oteri, F., Dallago, C., Trop, E., de Almeida, B. P., Sirelkhatim, H., et al. (2025) · Nature Methods · doi:10.1038/s41592-024-02523-z · Cited by 772
“Namely, sequences from chromosomes 20 and 21 were used for the test and the remainder were used for training the different models.”
Self-citationSequence modeling and design from molecular to genome scale with Evo
Nguyen, E., Poli, M., Durrant, M. G., Kang, B., Katrekar, D., Li, D. B., Bartie, L. J., Thomas, A. W., King, S. H., Brixi, G., et al. (2024) · Science · doi:10.1126/science.ado9336 · Cited by 580
Genome modelling and design across all domains of life with Evo 2
Brixi, G., Durrant, M. G., Ku, J., Naghipourfar, M., Poli, M., Sun, G., Brockman, G., Chang, D., Fanton, A., Gonzalez, G. A., et al. (2026) · Nature · doi:10.1038/s41586-026-10176-5 · Cited by 544
Opportunities and Challenges for Machine Learning-Assisted Enzyme Engineering
Yang, J., Li, F.-Z., & Arnold, F. H. (2024) · ACS Central Science · doi:10.1021/acscentsci.3c01275 · Cited by 268
Metadata
- Authors
- Zvyagin, M., Brace, A., Hippe, K., Deng, Y., Zhang, B., Bohorquez, C. O., Clyde, A., Kale, B., Perez-Rivera, D., Ma, H., Mann, C. M., Irvin, M., Gregory Pauloski, J., Ward, L., Hayot-Sasson, V., Emani, M., Foreman, S., Xie, Z., Lin, D., Shukla, M., Nie, W., Romero, J., Dallago, C., Vahdat, A., Xiao, C., Gibbs, T., Foster, I., Davis, J. J., Papka, M. E., Brettin, T., Stevens, R., Anandkumar, A., Vishwanath, V., & Ramanathan, A.
- Affiliations
- Argonne National Laboratory (US)
- Harvard University (US)
- Cerebras Systems (United States) (US)
- Northern Illinois University (US)
- Nvidia (United States) (US)
- University of Illinois Urbana-Champaign (US)
- Corresponding author
- Vishwanath, Venkatram
- Ramanathan, Arvind
- ORCID
- Brace, Alexander
- Hippe, Kyle
- Deng, Yuntian
- Zhang, Bin
- Clyde, Austin
- Kale, Bharat
- Ma, Heng
- Mann, Carla M.
- Ward, Logan
- Emani, Murali
- Foreman, Sam
- Lin, Diangen
- Shukla, Maulik
- Nie, Weili
- Dallago, Christian
- Vahdat, Arash
- Xiao, Chaowei
- Gibbs, Thomas
- Foster, Ian
- Davis, James J.
- Papka, Michael E.
- Brettin, Thomas
- Stevens, Rick
- Vishwanath, Venkatram
- Ramanathan, Arvind
- Venue
- The International Journal of High Performance Computing Applications
- Publisher
- openRxiv
- Published
- 2022-10-11
- Volume
- 37
- Issue
- 6
- Pages
- 683-705
- ISSN
- 0890-2720 (ISSN-L)
- PMC
- PMC9709791
- OpenAlex
- W4387994442
- Cited by
- 120
- References
- 57
- Citations by year
- 2026: 30 · 2025: 40 · 2024: 35 · 2023: 14 · 2022: 1
- FWCI
- 24.63
- Type
- journal article
- Language
- en
- Open access
- green
- doi.org
- Licence
- cc-by-nc-nd
- Locations
- The International Journal of High Performance Computing Applications (publishedVersion)
- bioRxiv (Cold Spring Harbor Laboratory) (acceptedVersion, cc-by-nc-nd)
- PubMed (publishedVersion)
- OSTI OAI (U.S. Department of Energy Office of Scientific and Technical Information) (submittedVersion)
- PubMed Central (submittedVersion, cc-by-nc-nd)
- Espace ÉTS (ETS) (submittedVersion)
- Funders
- National Science Foundation (DEAC02-05CH11231, DE-AC02–06CH11357, 2117896, 17-SC-20-SC)
- U.S. Department of Energy (DE‐ AC02‐06CH11357, COVID-19, 17‐SC‐20‐SC, -AC02-05CH11231, AC02‐06CH11357, 05CH11231, DE AC02 05CH11231, 06CH11357, DE-AC02-)
- National Energy Research Scientific Computing Center (DE–AC02–05CH11231, 05CH11231, DE-AC02-06CH11357, AC02-05CH11231)
- National Institutes of Health (DE-AC02–05CH11231, COVID-19, DE-AC02–06CH11357, 17-SC-20-SC)
- Office of Science (AC02‐06CH11357, 17-SC20-SC, DEAC02–05CH11231, AC02-05CH11231, DE-AC02, 05CH11231, 06CH11357, DE-AC02-06CH11357)
- National Nuclear Security Administration (AC02-05CH11231, 17- SC-20-SC, DE-AC02-05CH11231, DE-AC02-06CH11357)
- National Institute of Allergy and Infectious Diseases (COVID-19, P01AI165077, DE-AC02-06CH11357)
- Argonne National Laboratory (DE- AC02-06-CH11357, DE-AC02, AC02–06CH11357, DE-AC02-05CH11231, 06CH11357)
- Lawrence Berkeley National Laboratory (AC02‐05CH11231, DE-AC02-05CH11231, DE-AC02-06CH11357, 05CH11231)
- Topics
- Health Sciences › Medicine › Infectious Diseases › SARS-CoV-2 and COVID-19 Research
- Life Sciences › Biochemistry, Genetics and Molecular Biology › Molecular Biology › Genomics and Phylogenetic Studies
- Life Sciences › Biochemistry, Genetics and Molecular Biology › Molecular Biology › Machine Learning in Bioinformatics
- Keywords
- SARS-CoV-2, COVID-19 variants of concern, variant identification, viral evolution, foundation models, mixed-precision training
About these checks
Registry, retraction, Cites and statistics results are computed, not judged, with one exception: a printed reference that no index lists is read once by a model before it counts as a citation error. Claims are extracted by a model and kept only when their quote appears verbatim in the text; each cited source is then checked, with a model’s help, for whether it says what the claim relies on. Those verdicts can be wrong — read the claim’s quote and the cited source before relying on one.
Statistics and arithmetic are recomputed, not judged.
Confidence bands are shown only for fields calibrated on our annotated test set. None is calibrated yet, so no band is shown.
What counts as a claim ›How we measure confidence ›How we check this ›
Are you an author, or do you see a problem with this page? Request a review
