PreprintCited by 5Lipid Membrane Structure and BehaviorCellular transport and secretionCaveolin-1 and cellular processes

The DOI matches its Crossref record; 1 of the 1 references it cites were found in a registry or an index.

Tetraspanner-based nanodomains modulate BAR domain-induced membrane curvature

Open access

Preprint — published as 10.15252/embr.202357232 · Paper page

Abstract

Topography is a critical feature driving formation and dynamics of protein and lipid domains within biological membranes. The yeast plasma membrane (PM) has provided a powerful model system to study lateral domain formation, including characteristic BAR domain-induced PM furrows. Currently, it is not clear how the components involved in the establishment of these furrows cooperate to precisely regulate local PM topography. Here we report opposing functions for the Sur7 and Nce102 families of tetraspanner proteins in modulating membrane curvature and domain topography. Using STED nanoscopy and freeze-fracture EM we found that Sur7 tetraspanners form multimeric strands at the upper edges of PM furrows, which counteract the forces exerted by BAR domain proteins and prevent membrane tubulation. In contrast, Nce102 tetraspanners are located basal to the Sur7 proteins and promote BAR domain-induced curvature. The segregation of the two tetraspanner-based nanodomains is further supported by differential distribution of ergosterol to the upper edge of furrows and PIP2 lipids at the furrow base. These findings suggest a general role of tetraspanner proteins in sculpting local membrane domains.

Overview

The claims and statistics of this paper haven’t been checked yet.

Run the check — free, no account needed. It reads the open-access text and checks the sources it cites.

A few free checks a day · papers already verified open instantly · results are public

Integrity signals

Registry

Crossref · 10.1101/2022.11.21.517310

Cites

1 of 1 references verified0 citation errors · 0 not checkable

Statistics

Figures

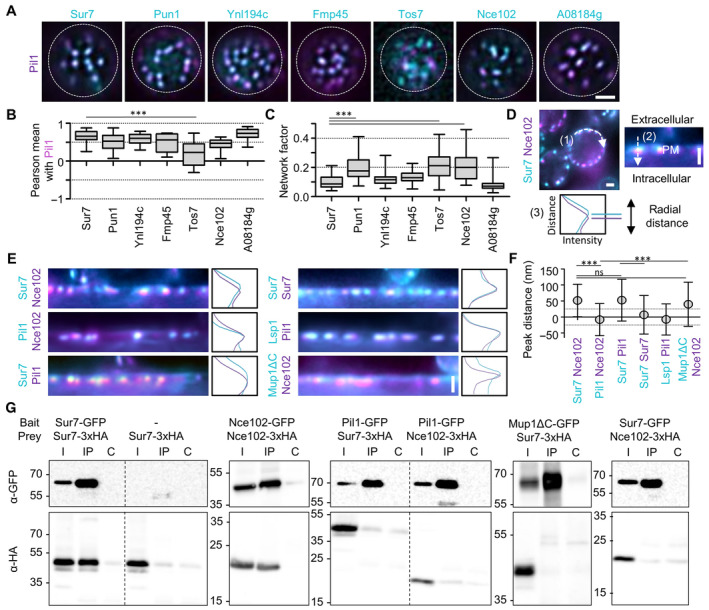
Figure 1 Yeast tetraspanners define subdomains in MCC/eisosomes TIRFM images showing colocalization of the indicated tetraspanners (C‐terminally fused to GFP (cyan) and expressed from the PMA1 promoter) together with the MCC/eisosomes marker Pil1‐RFP (magenta).Pearson correlation coefficients for colocalization pairs shown in (A).Lateral distribution of tetraspanners from (A) quantified using the network factor.Representative linearized profiles were generated along the cell periphery (1). An exemplary two‐color intensity profile (3) was taken perpendicularly through a single MCC/eisosome, indicated by a dashed arrow (2). Distances between intensity peaks correspond to radial distances between indicated proteins.Radial fluorescence intensity distributions of MCC/eisosomal protein pairs and representative intensity profiles perpendicular to MCC/eisosomes. Proteins were endogenously fused at their C‐termini to mNeGr (cyan) or mRFPruby (magenta). Note that the linearized profile for Sur7‐mNeGr/Nce102‐RFP is taken from the same cell as in (D).Radial distances for indicated protein pairs shown in (E). Dotted lines indicate the 25 nm bracket representing the estimated resolution of peak fitting.Co‐Immunoprecipitation of tetraspanners with various targets. Indicated GFP‐tagged proteins (bait) were pulled down with anti‐GFP. GFP‐tagged bait proteins and HA‐tagged prey proteins were detected by Western blot. I: Input, IP: Co‐IP with anti‐GFP, C: Control IP with unspecific IgG. Data information: (B, C) Boxplots (interquartile range (box), min to max spread (whiskers) and median values (line in boxes)), ANOVA with Dunnett's multiple comparison test, n = 15–32 cells from three experiments (B), n = 41–88 cells from three experiments (C). (F) Symbol graph, ANOVA with Tukey's multiple comparison test, n > 143 MCC/eisosomes from three experiments. P‐values: ***P < 0.01, ns: not significant. Scale bars: 1 μm. Source data are available online for this figure.
Figure 1 Yeast tetraspanners define subdomains in MCC/eisosomes TIRFM images showing colocalization of the indicated tetraspanners (C‐terminally fused to GFP (cyan) and expressed from the PMA1 promoter) together with the MCC/eisosomes marker Pil1‐RFP (magenta).Pearson correlation coefficients for colocalization pairs shown in (A).Lateral distribution of tetraspanners from (A) quantified using the network factor.Representative linearized profiles were generated along the cell periphery (1). An exemplary two‐color intensity profile (3) was taken perpendicularly through a single MCC/eisosome, indicated by a dashed arrow (2). Distances between intensity peaks correspond to radial distances between indicated proteins.Radial fluorescence intensity distributions of MCC/eisosomal protein pairs and representative intensity profiles perpendicular to MCC/eisosomes. Proteins were endogenously fused at their C‐termini to mNeGr (cyan) or mRFPruby (magenta). Note that the linearized profile for Sur7‐mNeGr/Nce102‐RFP is taken from the same cell as in (D).Radial distances for indicated protein pairs shown in (E). Dotted lines indicate the 25 nm bracket representing the estimated resolution of peak fitting.Co‐Immunoprecipitation of tetraspanners with various targets. Indicated GFP‐tagged proteins (bait) were pulled down with anti‐GFP. GFP‐tagged bait proteins and HA‐tagged prey proteins were detected by Western blot. I: Input, IP: Co‐IP with anti‐GFP, C: Control IP with unspecific IgG. Data information: (B, C) Boxplots (interquartile range (box), min to max spread (whiskers) and median values (line in boxes)), ANOVA with Dunnett's multiple comparison test, n = 15–32 cells from three experiments (B), n = 41–88 cells from three experiments (C). (F) Symbol graph, ANOVA with Tukey's multiple comparison test, n > 143 MCC/eisosomes from three experiments. P‐values: ***P < 0.01, ns: not significant. Scale bars: 1 μm. Source data are available online for this figure.CC BY · PubMed Central
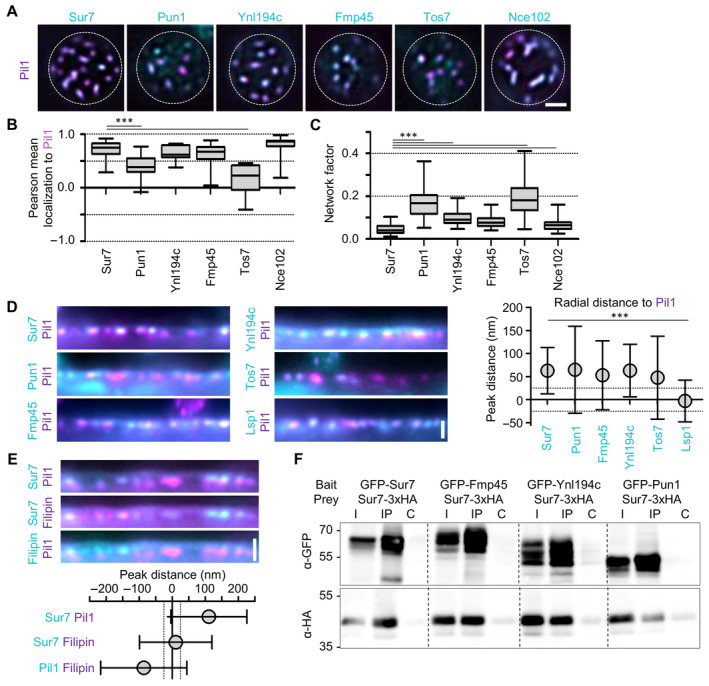
Figure EV1 Yeast tetraspanners define subdomains in MCC/eisosomes—Supplement TIRFM images showing colocalization of indicated tetraspanners (C‐terminally endogenously fused to GFP (cyan)) with the MCC/eisosome marker Pil1‐RFP (magenta).Pearson correlation coefficients for colocalization shown in (A).Lateral distribution of tetraspanners from (A) quantified using the network factor.Linearized profiles of WT cells expressing endogenous mNeGr fusions to indicated Sur7 tetraspanners and Lsp1 (cyan) together with Pil1‐RFP (magenta). Symbol graph represents quantification of radial distances between indicated protein pairs. Dotted lines indicate the 25 nm bracket representing the estimated resolution of peak fitting.Linearized profiles of WT cells expressing Sur7‐GFP from the PMA1 promoter (cyan) and Pil1‐RFP (magenta) stained with 5 μg/ml filipin (magenta/cyan). Symbol graph represents quantification of radial distances between indicated pairs. Dotted lines indicate the 25 nm bracket representing the estimated resolution of peak fitting.Co‐Immunoprecipitation of different Sur7 tetraspanner pairs. The indicated GFP‐tagged bait proteins were overexpressed from the GPD promoter and were pulled down with anti‐GFP antibody. The prey protein Sur7‐3xHA was expressed under the PMA1 promoter. Western blot probed with antibodies directed against HA and GFP. I: Input, IP: Co‐IP with anti‐GFP, C: Control IP with unspecific IgG. Data information: (B, C) Boxplots (interquartile range (box), min to max spread (whiskers) and median values (line in boxes)), ANOVA with Dunnett's multiple comparison test, n = 29–49 cells from three experiments (B), n = 59–150 cells from three experiments (C). (D, E) Symbol graph (error bars: SD), ANOVA with Tukey's multiple comparison test, n > 119 (D) and n > 152 (E) measurements from three experiments each. P‐values: ***P < 0.01. Scale bars: 1 μm. Source data are available online for this figure.
Figure EV1 Yeast tetraspanners define subdomains in MCC/eisosomes—Supplement TIRFM images showing colocalization of indicated tetraspanners (C‐terminally endogenously fused to GFP (cyan)) with the MCC/eisosome marker Pil1‐RFP (magenta).Pearson correlation coefficients for colocalization shown in (A).Lateral distribution of tetraspanners from (A) quantified using the network factor.Linearized profiles of WT cells expressing endogenous mNeGr fusions to indicated Sur7 tetraspanners and Lsp1 (cyan) together with Pil1‐RFP (magenta). Symbol graph represents quantification of radial distances between indicated protein pairs. Dotted lines indicate the 25 nm bracket representing the estimated resolution of peak fitting.Linearized profiles of WT cells expressing Sur7‐GFP from the PMA1 promoter (cyan) and Pil1‐RFP (magenta) stained with 5 μg/ml filipin (magenta/cyan). Symbol graph represents quantification of radial distances between indicated pairs. Dotted lines indicate the 25 nm bracket representing the estimated resolution of peak fitting.Co‐Immunoprecipitation of different Sur7 tetraspanner pairs. The indicated GFP‐tagged bait proteins were overexpressed from the GPD promoter and were pulled down with anti‐GFP antibody. The prey protein Sur7‐3xHA was expressed under the PMA1 promoter. Western blot probed with antibodies directed against HA and GFP. I: Input, IP: Co‐IP with anti‐GFP, C: Control IP with unspecific IgG. Data information: (B, C) Boxplots (interquartile range (box), min to max spread (whiskers) and median values (line in boxes)), ANOVA with Dunnett's multiple comparison test, n = 29–49 cells from three experiments (B), n = 59–150 cells from three experiments (C). (D, E) Symbol graph (error bars: SD), ANOVA with Tukey's multiple comparison test, n > 119 (D) and n > 152 (E) measurements from three experiments each. P‐values: ***P < 0.01. Scale bars: 1 μm. Source data are available online for this figure.CC BY · PubMed Central
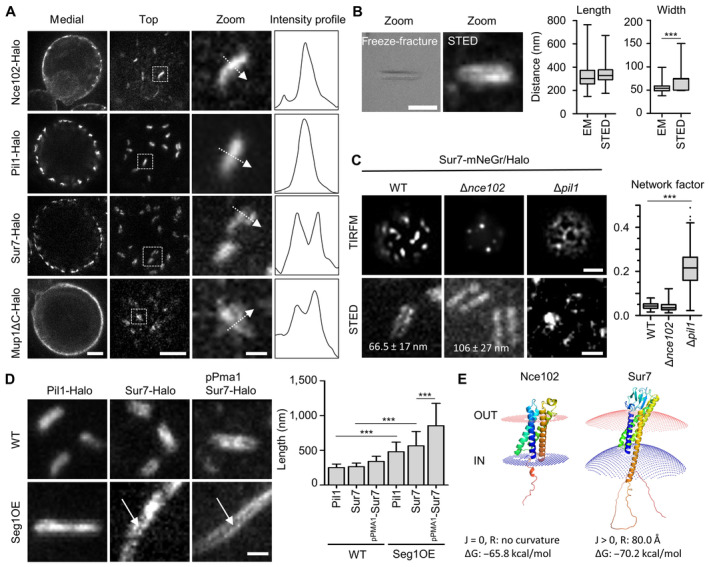
Figure 2 Super‐resolution imaging of MCC/eisosome subdomains STED images of indicated proteins fused to the Halo tag. Intensity profiles correspond to the dotted arrows in the zoomed images.Comparison of MCC/eisosome furrow dimensions obtained from freeze–fracture EM replicas and STED images of a yeast strain expressing Sur7‐Halo under the PMA1 promoter.Representative STED‐ and TIRFM‐images of yeast WT, Δnce102, and Δpil1 cells expressing Sur7‐mNeGr (TIRFM) or Sur7‐Halo (STED); the TIRFM images were used to obtain network factors in the box plot. Numbers in STED images indicate average ± SD gap width between Sur7‐Halo strands in WT and Δnce102 cells.Representative STED images of WT and Seg1 overexpressing (OE) yeast cells expressing either endogenous Pil1‐Halo or Sur7‐Halo or overexpressing Sur7‐Halo from the PMA1 promoter. Arrows highlight double‐strand appearance of Sur7‐tetraspanners. Quantification shows MCC/eisosomal length upon Seg1 overexpression.Positioning of Nce102 and Sur7 in fungal plasma membranes using PPM 3.0. Sign of curvature (J), radius of intrinsic curvature (R) and binding energy to membrane (ΔG) are indicated. Data information: (B, C) Box plots (interquartile range (box), min to max spread (whiskers) and median values (line in boxes)), unpaired t‐tests, n > 150 MCC/eisosomes from three experiments. (D): Bar graph (error bars: SD), ANOVA with Tukey's multiple comparison test, n > 90 MCC/eisosomes from three experiments. P‐values: ***P < 0.01. Scale bars: 1 μm, 200 nm (zoom). Source data are available online for this figure.
Figure 2 Super‐resolution imaging of MCC/eisosome subdomains STED images of indicated proteins fused to the Halo tag. Intensity profiles correspond to the dotted arrows in the zoomed images.Comparison of MCC/eisosome furrow dimensions obtained from freeze–fracture EM replicas and STED images of a yeast strain expressing Sur7‐Halo under the PMA1 promoter.Representative STED‐ and TIRFM‐images of yeast WT, Δnce102, and Δpil1 cells expressing Sur7‐mNeGr (TIRFM) or Sur7‐Halo (STED); the TIRFM images were used to obtain network factors in the box plot. Numbers in STED images indicate average ± SD gap width between Sur7‐Halo strands in WT and Δnce102 cells.Representative STED images of WT and Seg1 overexpressing (OE) yeast cells expressing either endogenous Pil1‐Halo or Sur7‐Halo or overexpressing Sur7‐Halo from the PMA1 promoter. Arrows highlight double‐strand appearance of Sur7‐tetraspanners. Quantification shows MCC/eisosomal length upon Seg1 overexpression.Positioning of Nce102 and Sur7 in fungal plasma membranes using PPM 3.0. Sign of curvature (J), radius of intrinsic curvature (R) and binding energy to membrane (ΔG) are indicated. Data information: (B, C) Box plots (interquartile range (box), min to max spread (whiskers) and median values (line in boxes)), unpaired t‐tests, n > 150 MCC/eisosomes from three experiments. (D): Bar graph (error bars: SD), ANOVA with Tukey's multiple comparison test, n > 90 MCC/eisosomes from three experiments. P‐values: ***P < 0.01. Scale bars: 1 μm, 200 nm (zoom). Source data are available online for this figure.CC BY · PubMed Central
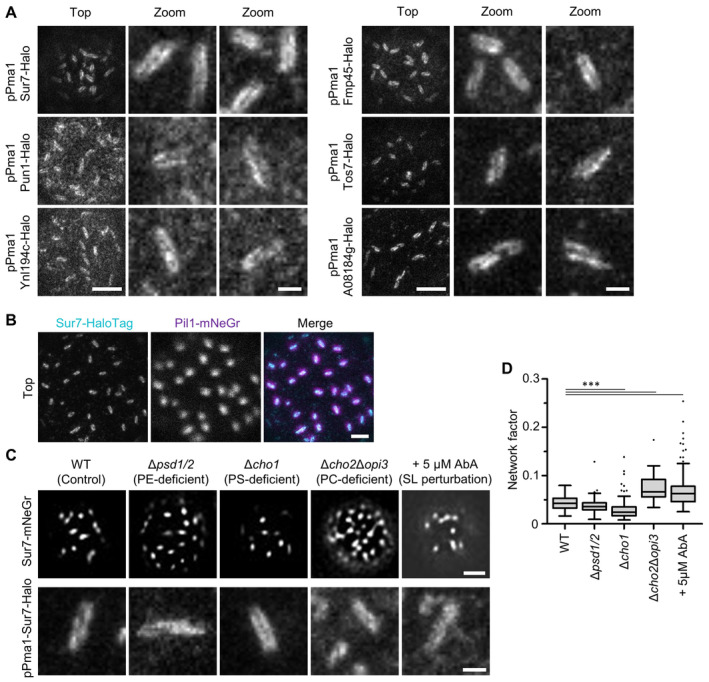
Figure EV2 Super‐resolution imaging of Sur7 tetraspanners—Supplement STED images of indicated tetraspanners expressed from the PMA1 promoter and fused to the Halo tag.Two‐color STED and confocal images of WT cells expressing endogenously tagged Sur7‐Halo (STED, magenta) and Pil1‐mNeGr (confocal, cyan).Effect of indicated lipid perturbations on lateral distribution of Sur7‐mNeGr.Lateral distribution of Sur7‐mNeGr quantified by the network factor in strains shown in (C). Data information: (D) Boxplot (interquartile range (box), min to max spread (whiskers) and median values (line in boxes)), ANOVA with Dunnett's multiple comparison test, n = 30–227 cells from three experiments. P‐values: ***P < 0.01. Scale bars: 1 μm, 200 nm (zoom). Source data are available online for this figure.
Figure EV2 Super‐resolution imaging of Sur7 tetraspanners—Supplement STED images of indicated tetraspanners expressed from the PMA1 promoter and fused to the Halo tag.Two‐color STED and confocal images of WT cells expressing endogenously tagged Sur7‐Halo (STED, magenta) and Pil1‐mNeGr (confocal, cyan).Effect of indicated lipid perturbations on lateral distribution of Sur7‐mNeGr.Lateral distribution of Sur7‐mNeGr quantified by the network factor in strains shown in (C). Data information: (D) Boxplot (interquartile range (box), min to max spread (whiskers) and median values (line in boxes)), ANOVA with Dunnett's multiple comparison test, n = 30–227 cells from three experiments. P‐values: ***P < 0.01. Scale bars: 1 μm, 200 nm (zoom). Source data are available online for this figure.CC BY · PubMed Central
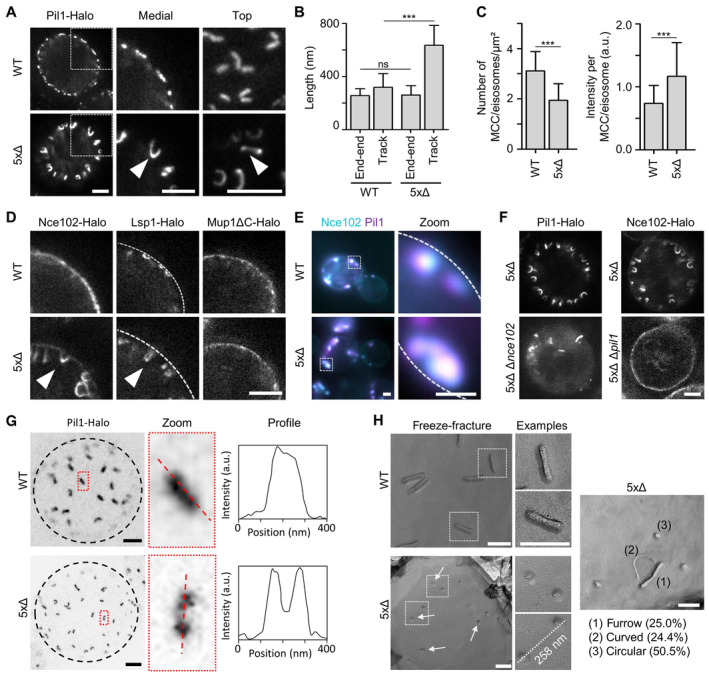
Figure 3 Sur7 tetraspanners prevent closure of MCC/eisosome furrows STED images of yeast cells expressing Pil1‐Halo in control (WT) and in mutant cells depleted of all five Sur7 tetraspanners (5xΔ). Arrowheads indicate tubular invagination.Quantification of end‐to‐end distance (from top views) and track‐length (from medial views) of Pil1‐Halo marked structures in yeast WT or 5xΔ cells.Density (number per area) and intensity of MCC/eisosomes marked by Pil1‐Halo.STED images of yeast WT and 5xΔ cells expressing indicated Halo fusions. Arrowheads highlight tubular structures in 5xΔ cells. Dashed line indicates location of the PM.Colocalization of Pil1‐mRFPruby and Nce102‐mNeGr in tubular structures of 5xΔ cells. Dotted lines indicate the cell edge.STED images of 5xΔ and 6xΔ (5xΔ + Δpil1 or Δnce102) cells expressing indicated Halo fusions.Top view STED images of WT or 5xΔ cells expressing Pil1‐Halo. Dotted black line indicates the cell edge. Intensity profiles of linear structures taken along dotted lines in zoomed areas.Freeze–fracture images of the PM in WT and 5xΔ cells. Arrows indicate likely ends of tubular invaginations. The distance between two exemplary circular structures and percentage of identified structural categories (1–3) in 5xΔ cells are shown. Data information: (B, C) Bar graphs (error bars: SD), unpaired t‐test, n > 44 cells from three experiments. ***P < 0.01, ns: not significant. Scale bars: 1 μm (A, D–F) and 200 nm (G, H). Source data are available online for this figure.
Figure 3 Sur7 tetraspanners prevent closure of MCC/eisosome furrows STED images of yeast cells expressing Pil1‐Halo in control (WT) and in mutant cells depleted of all five Sur7 tetraspanners (5xΔ). Arrowheads indicate tubular invagination.Quantification of end‐to‐end distance (from top views) and track‐length (from medial views) of Pil1‐Halo marked structures in yeast WT or 5xΔ cells.Density (number per area) and intensity of MCC/eisosomes marked by Pil1‐Halo.STED images of yeast WT and 5xΔ cells expressing indicated Halo fusions. Arrowheads highlight tubular structures in 5xΔ cells. Dashed line indicates location of the PM.Colocalization of Pil1‐mRFPruby and Nce102‐mNeGr in tubular structures of 5xΔ cells. Dotted lines indicate the cell edge.STED images of 5xΔ and 6xΔ (5xΔ + Δpil1 or Δnce102) cells expressing indicated Halo fusions.Top view STED images of WT or 5xΔ cells expressing Pil1‐Halo. Dotted black line indicates the cell edge. Intensity profiles of linear structures taken along dotted lines in zoomed areas.Freeze–fracture images of the PM in WT and 5xΔ cells. Arrows indicate likely ends of tubular invaginations. The distance between two exemplary circular structures and percentage of identified structural categories (1–3) in 5xΔ cells are shown. Data information: (B, C) Bar graphs (error bars: SD), unpaired t‐test, n > 44 cells from three experiments. ***P < 0.01, ns: not significant. Scale bars: 1 μm (A, D–F) and 200 nm (G, H). Source data are available online for this figure.CC BY · PubMed Central
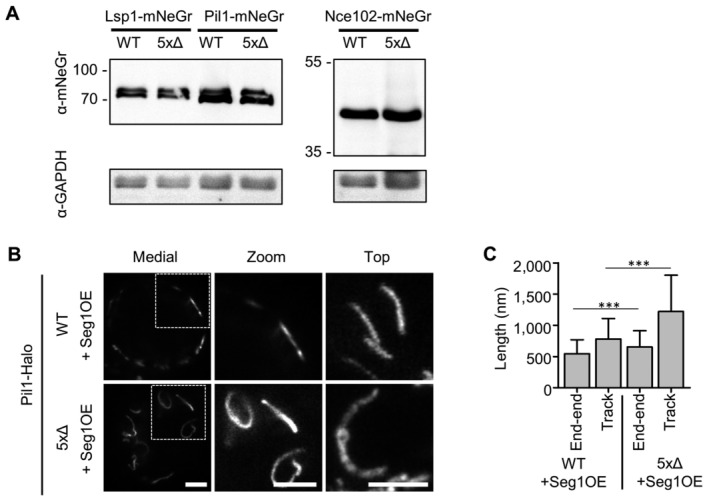
Figure EV3 Sur7 tetraspanners prevent closure of MCC/eisosome furrows—Supplement Western blot analysis depicting the expression of endogenous mNeGr fusions to Lsp1, Pil1 and Nce102 in WT and 5xΔ cells.STED microscopy of endogenously tagged Pil1‐Halo in WT and 5xΔ cells that overexpress Seg1 from the GPD promoter (OE).Quantification of track length for Pil1‐Halo positive structures in (B). Data information: (C) Bar graph (error bars: SD), unpaired t‐test, n = 53–175 tracks from three experiments. P‐values: ***P < 0.01. Scale bars: 1 μm. Source data are available online for this figure.
Figure EV3 Sur7 tetraspanners prevent closure of MCC/eisosome furrows—Supplement Western blot analysis depicting the expression of endogenous mNeGr fusions to Lsp1, Pil1 and Nce102 in WT and 5xΔ cells.STED microscopy of endogenously tagged Pil1‐Halo in WT and 5xΔ cells that overexpress Seg1 from the GPD promoter (OE).Quantification of track length for Pil1‐Halo positive structures in (B). Data information: (C) Bar graph (error bars: SD), unpaired t‐test, n = 53–175 tracks from three experiments. P‐values: ***P < 0.01. Scale bars: 1 μm. Source data are available online for this figure.CC BY · PubMed Central
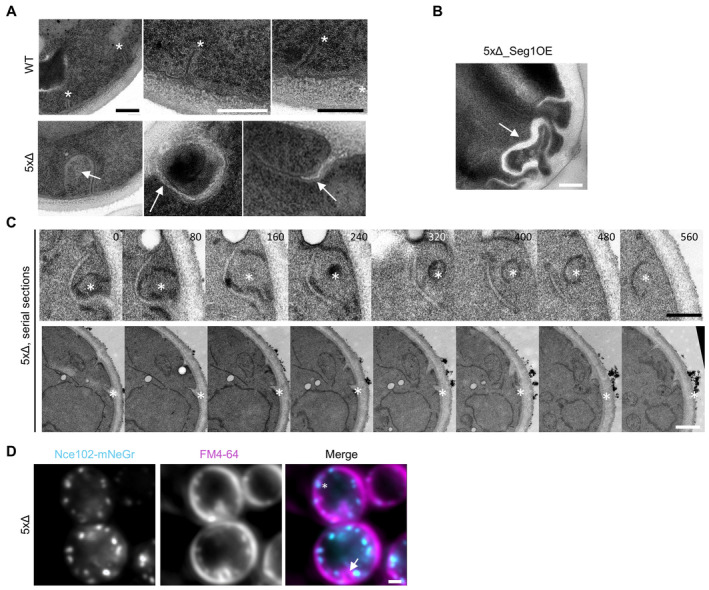
Figure EV4 Sur7 tetraspanners prevent closure of MCC/eisosome furrows – Supplement TEM micrographs of ultrathin sections of WT and 5xΔ. Asterisks indicate perpendicular sections through MCC/eisosome furrows. Arrows indicate abnormal PM invaginations.TEM micrograph of ultrathin sections of a 5xΔ cell overexpressing Seg1 from the GPD promoter (OE). The arrow indicates an abnormal PM invagination.Exemplary serial TEM sections of 5xΔ cells illustrating the sheet‐like invaginations filled with electron translucent cell wall material. Asterisks indicate positions of invaginations. Sample depth is indicated in nm.5xΔ cells expressing Nce102‐mNeGr (cyan) and labeled with the membrane dye FM4‐64 (magenta). Asterisk indicates a Nce102‐positive tube that is labeled by FM4‐64. Arrow indicates a large FM4‐64 positive invagination that does not contain Nce102. Data information: Scale bars: 200 nm (A–C), 1 μm (D). Source data are available online for this figure.
Figure EV4 Sur7 tetraspanners prevent closure of MCC/eisosome furrows – Supplement TEM micrographs of ultrathin sections of WT and 5xΔ. Asterisks indicate perpendicular sections through MCC/eisosome furrows. Arrows indicate abnormal PM invaginations.TEM micrograph of ultrathin sections of a 5xΔ cell overexpressing Seg1 from the GPD promoter (OE). The arrow indicates an abnormal PM invagination.Exemplary serial TEM sections of 5xΔ cells illustrating the sheet‐like invaginations filled with electron translucent cell wall material. Asterisks indicate positions of invaginations. Sample depth is indicated in nm.5xΔ cells expressing Nce102‐mNeGr (cyan) and labeled with the membrane dye FM4‐64 (magenta). Asterisk indicates a Nce102‐positive tube that is labeled by FM4‐64. Arrow indicates a large FM4‐64 positive invagination that does not contain Nce102. Data information: Scale bars: 200 nm (A–C), 1 μm (D). Source data are available online for this figure.CC BY · PubMed Central
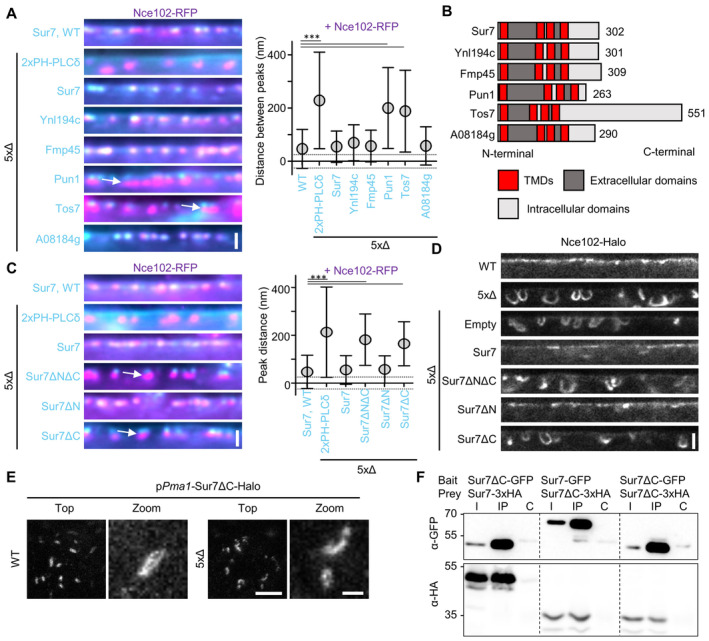
Figure 4 The C‐terminus of Sur7 is required for regulating PM domain topography Radial fluorescence intensity distribution of indicated protein pairs in linearized profiles of WT and 5xΔ cells expressing Nce102‐RFP (magenta) and GFP‐fused Sur7‐tetraspanners (cyan) from the PMA1 promoter. 2xPH‐PLCδ was used as an empty control and marks the PM. Symbol graph indicates distances between radial profile peaks. Arrows indicate separation of tetraspanners. Dotted lines indicate the 25‐nm bracket representing the estimated resolution of peak fitting.Topology of different Sur7‐tetraspanner family members with transmembrane (TMDs, red), extracellular (dark gray), and intracellular (light gray) segments indicated.Radial fluorescence intensity distributions of protein pairs in WT and 5xΔ cells expressing Nce102‐RFP (magenta) and GFP‐fused Sur7‐truncations (cyan) from the PMA1 promoter. 2xPH‐PLCδ was used as control. Symbol graph indicates distances between radial profile peaks. Sur7 = 1–302 aa; Sur7ΔC = 1–210 aa; Sur7ΔN = 7–302 aa; Sur7ΔNΔC = 7–210 aa. Arrows indicate separation of tetraspanners. Dotted lines indicate the 25 nm bracket representing the estimated resolution of peak fitting.Linearized STED profiles from 5xΔ cells expressing Nce102‐Halo and Sur7 truncations.STED images of WT and 5xΔ cells expressing Sur7ΔC‐Halo from the PMA1 promoter.Co‐Immunoprecipitation of Sur7 truncations. Indicated GFP‐tagged proteins (bait) were pulled down with anti‐GFP. GFP‐tagged prey proteins and HA‐tagged prey proteins were detected by Western blot. I: Input, IP: Co‐IP with anti‐GFP, C: Control IP with unspecific IgG. Data information: (A, C) Symbol graphs (error bars: SD), ANOVA with Dunnett's multiple comparison test, n > 67 MCC/eisosomes from three experiments (A), n > 139 MCC/eisosomes from three experiments (C). P‐values: ***P < 0.01. Scale bars: 1 μm (A, C, E‐top), 500 nm (D), 200 nm (E‐zoom). Source data are available online for this figure.
Figure 4 The C‐terminus of Sur7 is required for regulating PM domain topography Radial fluorescence intensity distribution of indicated protein pairs in linearized profiles of WT and 5xΔ cells expressing Nce102‐RFP (magenta) and GFP‐fused Sur7‐tetraspanners (cyan) from the PMA1 promoter. 2xPH‐PLCδ was used as an empty control and marks the PM. Symbol graph indicates distances between radial profile peaks. Arrows indicate separation of tetraspanners. Dotted lines indicate the 25‐nm bracket representing the estimated resolution of peak fitting.Topology of different Sur7‐tetraspanner family members with transmembrane (TMDs, red), extracellular (dark gray), and intracellular (light gray) segments indicated.Radial fluorescence intensity distributions of protein pairs in WT and 5xΔ cells expressing Nce102‐RFP (magenta) and GFP‐fused Sur7‐truncations (cyan) from the PMA1 promoter. 2xPH‐PLCδ was used as control. Symbol graph indicates distances between radial profile peaks. Sur7 = 1–302 aa; Sur7ΔC = 1–210 aa; Sur7ΔN = 7–302 aa; Sur7ΔNΔC = 7–210 aa. Arrows indicate separation of tetraspanners. Dotted lines indicate the 25 nm bracket representing the estimated resolution of peak fitting.Linearized STED profiles from 5xΔ cells expressing Nce102‐Halo and Sur7 truncations.STED images of WT and 5xΔ cells expressing Sur7ΔC‐Halo from the PMA1 promoter.Co‐Immunoprecipitation of Sur7 truncations. Indicated GFP‐tagged proteins (bait) were pulled down with anti‐GFP. GFP‐tagged prey proteins and HA‐tagged prey proteins were detected by Western blot. I: Input, IP: Co‐IP with anti‐GFP, C: Control IP with unspecific IgG. Data information: (A, C) Symbol graphs (error bars: SD), ANOVA with Dunnett's multiple comparison test, n > 67 MCC/eisosomes from three experiments (A), n > 139 MCC/eisosomes from three experiments (C). P‐values: ***P < 0.01. Scale bars: 1 μm (A, C, E‐top), 500 nm (D), 200 nm (E‐zoom). Source data are available online for this figure.CC BY · PubMed Central
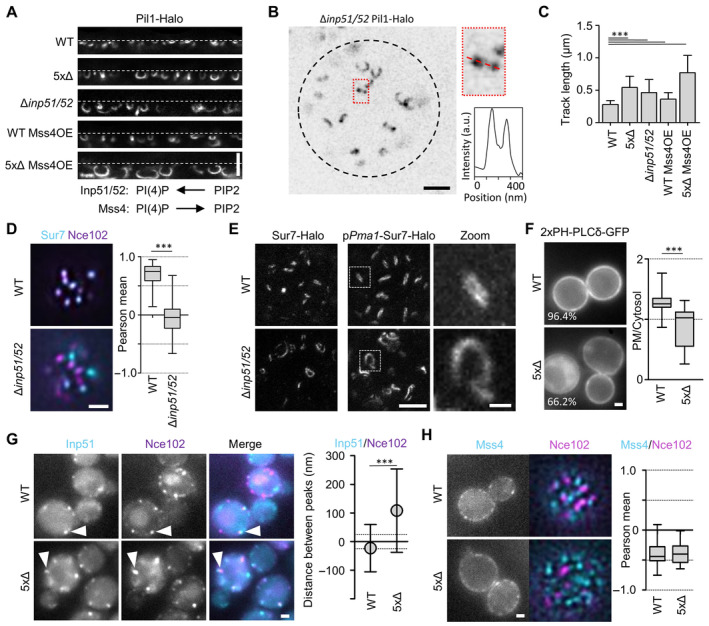
Figure 5 The role of PIP2 in the regulation of MCC/eisosome topography Linearized STED profiles of indicated mutants expressing Pil1‐Halo. Mss4 was constitutively overexpressed from the GPD promoter. Dotted lines indicate PM. Function of indicated enzymes in PI(4)P‐ and PIP2‐biosythesis is displayed schematically.Top view STED image of a Δinp51/52 cell expressing Pil1‐Halo. Dotted black line indicates the cell edge. Intensity profile of linear structure taken along dotted line in zoomed area.Bar graphs indicate track lengths of tubular invaginations formed under the conditions shown in (A).Colocalization of Sur7‐mNeGr (cyan) and Nce102‐RFP (magenta) in MCC/eisosomes from WT and Δinp51/52 cells. Box plots indicate the respective Pearson mean coefficients.STED images of Sur7‐Halo expressed endogenously or from the PMA1 promoter in WT and Δinp51/52 cells. Zoomed images show details of Sur7 strand organization.Distribution of the PIP2 reporter 2xPH‐PLCδ‐GFP in WT and 5xΔ cells. Percentage of cells that showed PM staining is indicated. Box plots show PM to cytosol ratios of GFP signal.Colocalization of Inp51‐mNeGr (cyan) and Nce102‐RFP (magenta) in MCC/eisosomes (arrowheads) of WT and 5xΔ cells. Symbol graph indicates distances between radial profile peaks.Localization of endogenously tagged GFP‐Mss4 (cyan) in WT and 5xΔ cells expressing Nce102‐RFP (magenta). Box plots indicate the respective Pearson mean coefficients. Data information: (C) Bar graph (error bars: SD), ANOVA with Dunnett's multiple comparison test, n = 139–292 tracks from three experiments. (D) Boxplot (interquartile range (box), min to max spread (whiskers) and median values (line in boxes)), unpaired t‐test, n = 82–93 cells from three experiments. (F) Boxplot, unpaired t‐test, n > 62 cells from three experiments. (G) Symbol graph (error bars: SD), unpaired t‐test, n > 104 measurements from three experiments. (H) Boxplot, unpaired t‐test, n > 26 cells from three experiments. P‐values: ***P < 0.01. Scale bars: 1 μm and 200 nm (zoom). Source data are available online for this figure.
Figure 5 The role of PIP2 in the regulation of MCC/eisosome topography Linearized STED profiles of indicated mutants expressing Pil1‐Halo. Mss4 was constitutively overexpressed from the GPD promoter. Dotted lines indicate PM. Function of indicated enzymes in PI(4)P‐ and PIP2‐biosythesis is displayed schematically.Top view STED image of a Δinp51/52 cell expressing Pil1‐Halo. Dotted black line indicates the cell edge. Intensity profile of linear structure taken along dotted line in zoomed area.Bar graphs indicate track lengths of tubular invaginations formed under the conditions shown in (A).Colocalization of Sur7‐mNeGr (cyan) and Nce102‐RFP (magenta) in MCC/eisosomes from WT and Δinp51/52 cells. Box plots indicate the respective Pearson mean coefficients.STED images of Sur7‐Halo expressed endogenously or from the PMA1 promoter in WT and Δinp51/52 cells. Zoomed images show details of Sur7 strand organization.Distribution of the PIP2 reporter 2xPH‐PLCδ‐GFP in WT and 5xΔ cells. Percentage of cells that showed PM staining is indicated. Box plots show PM to cytosol ratios of GFP signal.Colocalization of Inp51‐mNeGr (cyan) and Nce102‐RFP (magenta) in MCC/eisosomes (arrowheads) of WT and 5xΔ cells. Symbol graph indicates distances between radial profile peaks.Localization of endogenously tagged GFP‐Mss4 (cyan) in WT and 5xΔ cells expressing Nce102‐RFP (magenta). Box plots indicate the respective Pearson mean coefficients. Data information: (C) Bar graph (error bars: SD), ANOVA with Dunnett's multiple comparison test, n = 139–292 tracks from three experiments. (D) Boxplot (interquartile range (box), min to max spread (whiskers) and median values (line in boxes)), unpaired t‐test, n = 82–93 cells from three experiments. (F) Boxplot, unpaired t‐test, n > 62 cells from three experiments. (G) Symbol graph (error bars: SD), unpaired t‐test, n > 104 measurements from three experiments. (H) Boxplot, unpaired t‐test, n > 26 cells from three experiments. P‐values: ***P < 0.01. Scale bars: 1 μm and 200 nm (zoom). Source data are available online for this figure.CC BY · PubMed Central
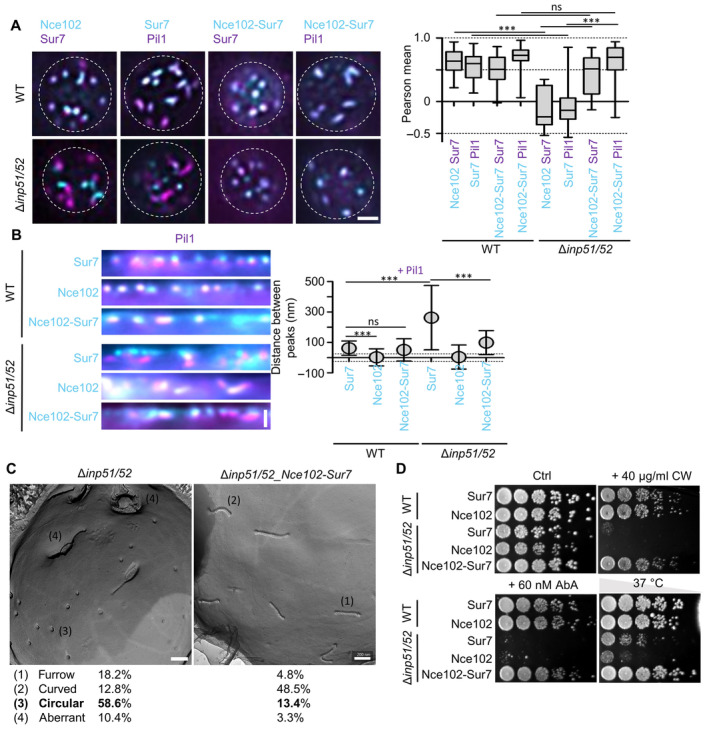
Figure 6 Synthetic recruitment of Sur7 controls the topography and function of MCC/eisosomes Colocalization of mNeGr fusions to Sur7, Nce102 or the Nce102‐Sur7‐chimera (cyan) with Sur7‐RFP or Pil1‐RFP (magenta) in WT and Δinp51/52 cells. Box plot shows Pearson correlation coefficients for the respective protein pairs.Linearized profiles of WT and Δinp51/52 expressing mNeGr fused to Sur7, Nce102 or the Nce102‐Sur7‐chimera (cyan). MCC/eisosomes are marked with Pil1‐RFP (magenta). Symbol graph of distances between radial profile peaks of Pil1‐RFP and shown proteins. Dotted lines indicate the 25 nm bracket representing the estimated resolution of peak fitting.Freeze–fracture EM micrographs of the PM in a Δinp51/52 cell and a Δinp51/52 cell expressing the Nce102‐Sur7‐mNeGr‐chimera. Percentages for identified structural categories (1–4) are shown.Growth assay for WT or Δinp51/52 cells expressing mNeGr fusions to Sur7, Nce102 or the Nce102‐Sur7‐chimera. Dots represent a five‐fold serial dilution series on YPD plates containing 40 μg/ml Calcofluor White (CW), 60 nM AureobasidinA (AbA) or grown at 37°C for 48 h. Data information: (A) Boxplot (interquartile range (box), min to max spread (whiskers) and median values (line in boxes)), ANOVA with Dunnett's multiple comparison test, n = 14–55 cells from three experiments. (B) Symbol graph (error bars: SD), ANOVA with Dunnett's multiple comparison test, n > 123 MCC/eisosomes from three experiments. (C) n = 26–45 cells. P‐values: ***P < 0.01, ns: not significant. Scale bars: 1 μm (A, B), 200 nm (C). Source data are available online for this figure.
Figure 6 Synthetic recruitment of Sur7 controls the topography and function of MCC/eisosomes Colocalization of mNeGr fusions to Sur7, Nce102 or the Nce102‐Sur7‐chimera (cyan) with Sur7‐RFP or Pil1‐RFP (magenta) in WT and Δinp51/52 cells. Box plot shows Pearson correlation coefficients for the respective protein pairs.Linearized profiles of WT and Δinp51/52 expressing mNeGr fused to Sur7, Nce102 or the Nce102‐Sur7‐chimera (cyan). MCC/eisosomes are marked with Pil1‐RFP (magenta). Symbol graph of distances between radial profile peaks of Pil1‐RFP and shown proteins. Dotted lines indicate the 25 nm bracket representing the estimated resolution of peak fitting.Freeze–fracture EM micrographs of the PM in a Δinp51/52 cell and a Δinp51/52 cell expressing the Nce102‐Sur7‐mNeGr‐chimera. Percentages for identified structural categories (1–4) are shown.Growth assay for WT or Δinp51/52 cells expressing mNeGr fusions to Sur7, Nce102 or the Nce102‐Sur7‐chimera. Dots represent a five‐fold serial dilution series on YPD plates containing 40 μg/ml Calcofluor White (CW), 60 nM AureobasidinA (AbA) or grown at 37°C for 48 h. Data information: (A) Boxplot (interquartile range (box), min to max spread (whiskers) and median values (line in boxes)), ANOVA with Dunnett's multiple comparison test, n = 14–55 cells from three experiments. (B) Symbol graph (error bars: SD), ANOVA with Dunnett's multiple comparison test, n > 123 MCC/eisosomes from three experiments. (C) n = 26–45 cells. P‐values: ***P < 0.01, ns: not significant. Scale bars: 1 μm (A, B), 200 nm (C). Source data are available online for this figure.CC BY · PubMed Central
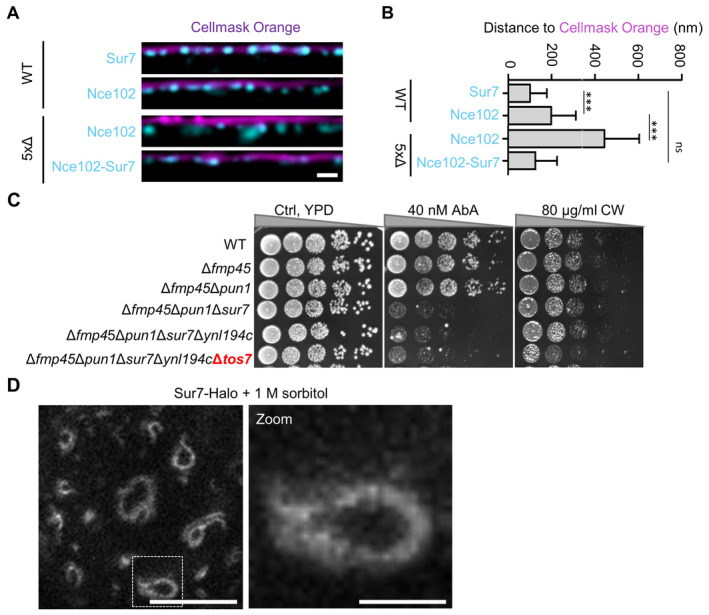
Figure EV5 Mechanistic basis of Sur7 function in subdomain organization—Supplement Linearized profiles of WT cells expressing indicated GFP fusions (cyan) stained with the PM dye Cellmask Orange (magenta).Bar graph representing quantification of the radial distances between indicated protein and Cellmask Orange in (A).Growth assays with successive deletions of Sur7 tetraspanners. Cells were grown on YPD plates containing 40 nM AbA or 40 μg/ml calcofluor white (CW) at 30°C for 48 h.STED image of WT cells expressing Sur7‐Halo from the PMA1 promoter after addition of 1 M sorbitol for 5 min. Data information: (B) Bar graph (error bars: SD), ANOVA with Tukey's multiple comparison test, n > 133 measurements from three experiments. P‐values: ***P < 0.01, ns: not significant. Scale bars: 1 μm, 200 nm (zoom). Source data are available online for this figure.
Figure EV5 Mechanistic basis of Sur7 function in subdomain organization—Supplement Linearized profiles of WT cells expressing indicated GFP fusions (cyan) stained with the PM dye Cellmask Orange (magenta).Bar graph representing quantification of the radial distances between indicated protein and Cellmask Orange in (A).Growth assays with successive deletions of Sur7 tetraspanners. Cells were grown on YPD plates containing 40 nM AbA or 40 μg/ml calcofluor white (CW) at 30°C for 48 h.STED image of WT cells expressing Sur7‐Halo from the PMA1 promoter after addition of 1 M sorbitol for 5 min. Data information: (B) Bar graph (error bars: SD), ANOVA with Tukey's multiple comparison test, n > 133 measurements from three experiments. P‐values: ***P < 0.01, ns: not significant. Scale bars: 1 μm, 200 nm (zoom). Source data are available online for this figure.CC BY · PubMed Central
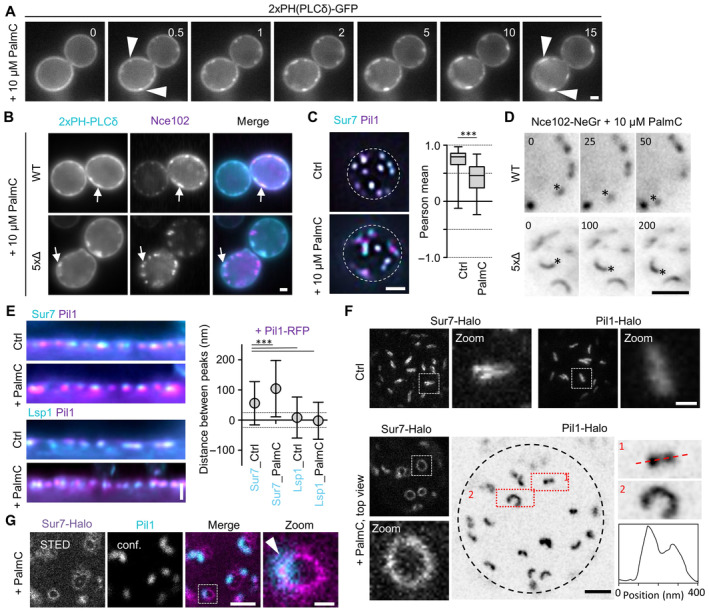
Figure 7 Effects of acute perturbation of MCC/eisosome topography Effect of addition of 10 μM palmitoylcarnitine (PalmC) on PM distribution of PIP2, marked by 2xPH(PLCδ)‐GFP. Time in min after PalmC treatment. Arrowheads indicate PIP2 clusters.Colocalization of Nce102‐RFP (magenta) with PIP2 marked by 2xPH(PLCδ)‐GFP (cyan) in WT and 5xΔ cells, 10 min after addition of 10 μM PalmC. Arrows indicate colocalization in clusters.Colocalization of Sur7‐mNeGr (cyan) and Pil1‐RFP (magenta) in WT cells before and after treatment with PalmC. Box plots indicate Pearson correlation coefficients in respective conditions.Exemplary time series of WT or 5xΔ cells expressing Nce102‐mNeGr after treatment with 10 μM PalmC. Asterisks indicate laterally translating structures. Time in seconds. See Movie EV1 for more examples.Linearized profiles and distances of radial profile peaks between Pil1‐RFP (magenta) and Sur7‐mNeGr (cyan) before and after PalmC treatment. The distance between Lsp1‐mNeGr and Pil1‐RFP was used as a control. Dotted lines indicate the 25 nm bracket representing the estimated resolution of peak fitting.STED images of WT cells expressing Sur7‐Halo from the PMA1 promoter or endogenous Pil1‐Halo before and after PalmC treatment. Zoom shows curved structures observed under PalmC treatment. Black dotted line indicates the cell edge. Intensity profile was taken along the red dotted line along structure (1).Colocalization of WT cell expressing Sur7‐Halo from the PMA1 promoter (magenta, STED) and Pil1‐mNeGr (cyan, confocal) after 10 μM PalmC treatment. Arrow head indicates the area of overlap. Data information: (C) Box plot (interquartile range (box), min to max spread (whiskers) and median values (line in boxes)), unpaired t‐test, n = 37–53 cells from three experiments. (E) Symbol graph (error bars: SD), ANOVA with Dunnett's multiple comparison test, n > 128 MCC/eisosomes from three experiments. P‐values: ***P < 0.01. Scale bars: 1 μm, 200 nm (zoom). Source data are available online for this figure.
Figure 7 Effects of acute perturbation of MCC/eisosome topography Effect of addition of 10 μM palmitoylcarnitine (PalmC) on PM distribution of PIP2, marked by 2xPH(PLCδ)‐GFP. Time in min after PalmC treatment. Arrowheads indicate PIP2 clusters.Colocalization of Nce102‐RFP (magenta) with PIP2 marked by 2xPH(PLCδ)‐GFP (cyan) in WT and 5xΔ cells, 10 min after addition of 10 μM PalmC. Arrows indicate colocalization in clusters.Colocalization of Sur7‐mNeGr (cyan) and Pil1‐RFP (magenta) in WT cells before and after treatment with PalmC. Box plots indicate Pearson correlation coefficients in respective conditions.Exemplary time series of WT or 5xΔ cells expressing Nce102‐mNeGr after treatment with 10 μM PalmC. Asterisks indicate laterally translating structures. Time in seconds. See Movie EV1 for more examples.Linearized profiles and distances of radial profile peaks between Pil1‐RFP (magenta) and Sur7‐mNeGr (cyan) before and after PalmC treatment. The distance between Lsp1‐mNeGr and Pil1‐RFP was used as a control. Dotted lines indicate the 25 nm bracket representing the estimated resolution of peak fitting.STED images of WT cells expressing Sur7‐Halo from the PMA1 promoter or endogenous Pil1‐Halo before and after PalmC treatment. Zoom shows curved structures observed under PalmC treatment. Black dotted line indicates the cell edge. Intensity profile was taken along the red dotted line along structure (1).Colocalization of WT cell expressing Sur7‐Halo from the PMA1 promoter (magenta, STED) and Pil1‐mNeGr (cyan, confocal) after 10 μM PalmC treatment. Arrow head indicates the area of overlap. Data information: (C) Box plot (interquartile range (box), min to max spread (whiskers) and median values (line in boxes)), unpaired t‐test, n = 37–53 cells from three experiments. (E) Symbol graph (error bars: SD), ANOVA with Dunnett's multiple comparison test, n > 128 MCC/eisosomes from three experiments. P‐values: ***P < 0.01. Scale bars: 1 μm, 200 nm (zoom). Source data are available online for this figure.CC BY · PubMed Central
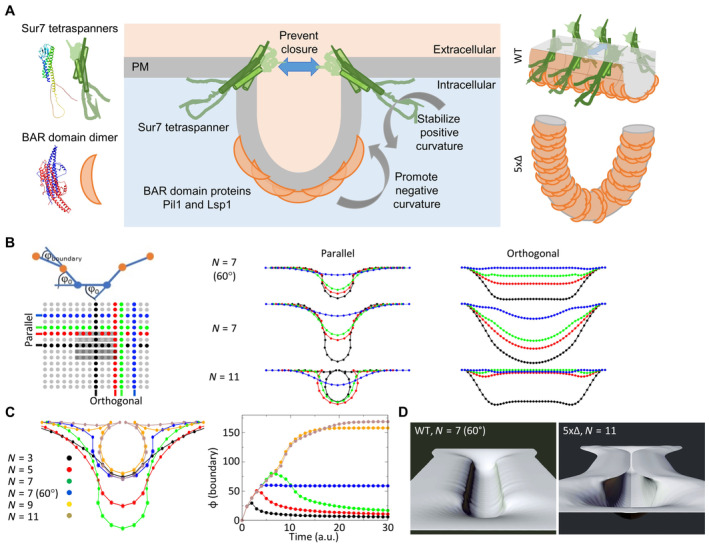
Figure 8 Conceptual model for tetraspanner functions in MCC/eisosome organization Mechanistic model depicting the balance of curvature generation between different MCC/eisosome subdomains. Negative curvature is induced by the binding of Pil1 and Lsp1 to PIP2‐enriched PM domains. Positive curvature at the upper edge of the formed furrows is stabilized by Sur7 parallel strands. Gray arrows indicate direction of curvature. Blue arrow illustrates the inhibition of furrow closure. Schematic protein structures are based on AlphaFold predictions and are not to scale. Right: 3D illustration of Sur7 and BAR domain distribution within MCC/eisosome furrows of WT cells and half‐toroidal tubes of 5xΔ cells.Schematic representation of the boundary angle and the central part of the simulated 25 × 49 array with indicated BAR domains (gray bars, 29 in actual simulation) and positions of line profiles parallel and orthogonal to the BAR domains (color‐coded). Profiles show bending of the membrane for different number of BAR domains (N) and in the presence of tetraspanners that stabilize the positive curvature at the boundary (φ here fixed at 60°).Cross sections parallel through the curved membrane area (equivalent to black parallel profile) with different numbers of BAR domains (N) and in the presence of tetraspanners that stabilize the positive curvature at the boundary N = 7 (60°). Note the development of omega‐shaped profiles for N ≥ 9 that mimic conformations where opposing parts of the membranes could fuse. In addition, the time evolution of boundary angles (see B) for different N and with/without stabilization of curvature at 60° is shown (right, color code is indicated).Rendered 3D views of the 2D array at equilibrium for simulations N = 7 (60°) that corresponds to WT MCC/eisosome furrows (left) and N = 11 corresponding to the 5xΔ strain (right). Also see corresponding tracking shots in Movies EV2 and EV3.
Figure 8 Conceptual model for tetraspanner functions in MCC/eisosome organization Mechanistic model depicting the balance of curvature generation between different MCC/eisosome subdomains. Negative curvature is induced by the binding of Pil1 and Lsp1 to PIP2‐enriched PM domains. Positive curvature at the upper edge of the formed furrows is stabilized by Sur7 parallel strands. Gray arrows indicate direction of curvature. Blue arrow illustrates the inhibition of furrow closure. Schematic protein structures are based on AlphaFold predictions and are not to scale. Right: 3D illustration of Sur7 and BAR domain distribution within MCC/eisosome furrows of WT cells and half‐toroidal tubes of 5xΔ cells.Schematic representation of the boundary angle and the central part of the simulated 25 × 49 array with indicated BAR domains (gray bars, 29 in actual simulation) and positions of line profiles parallel and orthogonal to the BAR domains (color‐coded). Profiles show bending of the membrane for different number of BAR domains (N) and in the presence of tetraspanners that stabilize the positive curvature at the boundary (φ here fixed at 60°).Cross sections parallel through the curved membrane area (equivalent to black parallel profile) with different numbers of BAR domains (N) and in the presence of tetraspanners that stabilize the positive curvature at the boundary N = 7 (60°). Note the development of omega‐shaped profiles for N ≥ 9 that mimic conformations where opposing parts of the membranes could fuse. In addition, the time evolution of boundary angles (see B) for different N and with/without stabilization of curvature at 60° is shown (right, color code is indicated).Rendered 3D views of the 2D array at equilibrium for simulations N = 7 (60°) that corresponds to WT MCC/eisosome furrows (left) and N = 11 corresponding to the 5xΔ strain (right). Also see corresponding tracking shots in Movies EV2 and EV3.CC BY · PubMed Central

Verification

Claims the paper makes

The claims and statistics of this paper haven’t been checked yet.

Run the check — free, no account needed. It reads the open-access text and checks the sources it cites.

A few free checks a day · papers already verified open instantly · results are public

Self-check

Percentages, sums and reported differences re-computed from the paper’s own numbers.

The self-check needs the paper’s full text.

Citations

Cites

Research works printed but not linked: 51

  1. 10.1038/nsmb.1829 · DOI
  2. 10.1091/mbc.E08-05-0479 · DOI
  3. 10.1091/mbc.E19-04-0218 · DOI
  4. 10.1016/j.bbrc.2011.10.121 · DOI
  5. 10.1038/ncb2480 · DOI
  6. 2001, Immunoprecipitation, Curr Protoc Immunol, 41, 1
  7. 10.1007/PL00000933 · DOI
  8. Bradley PH , Brauer MJ , Rabinowitz JD & Troyanskaya OG (2009) Coordinated Concentration Changes of Transcripts and Metabolites in Saccharomyces cerevisiae. PLoS Comput Biol 5: e1000270 · DOI
  9. 2019, Integration Through Separation – The Role of Lateral Membrane Segregation in Nutrient Uptake, Front Cell Dev Biol, 7, 1
  10. 2018, Lateral plasma membrane compartmentalization links protein function and turnover, EMBO J, 37, 285510
  11. Charrin S , Jouannet S , Boucheix C & Rubinstein E (2014) Tetraspanins at a glance. J Cell Sci: 3641–3648 · DOI
  12. 10.1073/pnas.2110877119 · DOI
  13. 10.1146/annurev-micro-091313-103507 · DOI
  14. 10.1091/mbc.E13-11-0639 · DOI
  15. 10.1083/jcb.200811081 · DOI
  16. 10.1016/j.cell.2009.04.010 · DOI · Paper page
  17. 10.1038/sj.emboj.7601466 · DOI
  18. 10.1364/OL.19.000780 · DOI
  19. 10.1002/yea.1142 · DOI
  20. 10.1083/jcb.201104040 · DOI
  21. 1998, Hydrophobic mismatch between proteins and lipids in membranes, Biochim Biophys Acta - Rev Biomembr, 1376, 401, 10.1016/S0304-4157(98)00017-3 · DOI
  22. 10.1006/jmbi.2000.4315 · DOI · Paper page
  23. 10.1016/j.tibs.2011.08.001 · DOI
  24. 10.1186/gb-2009-10-8-235 · DOI
  25. 2020, Plasma Membrane MCC/Eisosome Domains Promote Stress Resistance in Fungi, Microbiol Mol Biol Rev, 84, 1
  26. 2021, The Sur7 cytoplasmic C terminus regulates morphogenesis and stress responses in Candida albicans, Mol Microbiol, 116, 1201, 10.1111/mmi.14806 · DOI
  27. 10.1128/EC.00106-15 · DOI
  28. 10.1038/nri1548 · DOI
  29. 10.1038/emboj.2012.127 · DOI
  30. 10.1128/EC.00006-10 · DOI
  31. 10.1074/jbc.M709972200 · DOI
  32. 10.1091/mbc.E03-04-0221 · DOI
  33. 2012, Seg1 controls eisosome assembly and shape, 198, 405
  34. 10.1091/mbc.E08-03-0313 · DOI
  35. 10.3109/09687688.2012.687461 · DOI
  36. 10.1038/s41556-018-0150-z · DOI
  37. 2015, Building a patchwork — The yeast plasma membrane as model to study lateral domain formation, Biochim Biophys Acta - Mol Cell Res, 1853, 767, 10.1016/j.bbamcr.2014.12.019 · DOI
  38. 10.1038/42408 · DOI · Paper page
  39. 10.1038/ncb2487 · DOI
  40. Staehelin LA (1974) Structure and Function of Intercellular Junctions. In International Review of Cytology pp 191–283. · DOI
  41. 10.1091/mbc.01-10-0476 · DOI
  42. 10.1242/jcs.051227 · DOI
  43. Stuckey S & Storici F (2013) Gene Knockouts, in vivo Site-Directed Mutagenesis and Other Modifications Using the Delitto Perfetto System in Saccharomyces cerevisiae. In Methods in Enzymology pp 103–131. Elsevier Inc. · DOI
  44. 10.1093/NAR/GKAB1061 · DOI · Paper page
  45. 10.1038/sj.emboj.7601933 · DOI
  46. 10.1038/nature04472 · DOI
  47. 10.1091/mbc.E16-01-0065 · DOI
  48. 10.1128/MCB.22.3.927-934.2002 · DOI
  49. Zahumenský J , Mota Fernandes C , Veselá P , Del Poeta M , Konopka JB & Malínský J (2022) Microdomain Protein Nce102 Is a Local Sensor of Plasma Membrane Sphingolipid Balance. Microbiol Spectr 10 · DOI
  50. 10.1016/j.celrep.2013.08.024 · DOI
  51. 10.1038/srep12201 · DOI

Metadata

Authors
Haase, D., Rasch, C., Keller, U., Elting, A., Wittmar, J., Janning, A., Kahms, M., Schuberth, C., Klingauf, J., & Wedlich-Söldner, R.
Affiliations
University of Münster (DE)
Venue
EMBO Reports
Publisher
openRxiv
Published
2022-11-21
Volume
24
Issue
12
Pages
e57232-e57232
ISSN
1469-221X (ISSN-L)
OpenAlex
W4388014044
Cited by
5
References
1
Citations by year
2025: 1 · 2024: 2 · 2023: 2
FWCI
0.44
Type
journal article
Language
en
Open access
Licence
cc-by
Locations
  • EMBO Reports (publishedVersion, cc-by)
  • bioRxiv (Cold Spring Harbor Laboratory) (acceptedVersion, cc-by-nc-nd)
  • PubMed Central (publishedVersion, cc-by)
  • PubMed (publishedVersion)
Funders
Deutsche Forschungsgemeinschaft (SFB 944, SFB1557, SFB1348)
Topics
  • Life Sciences › Biochemistry, Genetics and Molecular Biology › Molecular Biology › Lipid Membrane Structure and Behavior
  • Life Sciences › Biochemistry, Genetics and Molecular Biology › Cell Biology › Cellular transport and secretion
  • Life Sciences › Biochemistry, Genetics and Molecular Biology › Cell Biology › Caveolin-1 and cellular processes
Keywords
BAR domain proteins, membrane curvature, membrane tubulation, lipid rafts, protein oligomerization, membrane invagination, yeast plasma membrane
MeSH terms
Cell Membrane, Proteins

About these checks

Registry, retraction, Cites and statistics results are computed, not judged, with one exception: a printed reference that no index lists is read once by a model before it counts as a citation error. Claims are extracted by a model and kept only when their quote appears verbatim in the text; each cited source is then checked, with a model’s help, for whether it says what the claim relies on. Those verdicts can be wrong — read the claim’s quote and the cited source before relying on one.

Statistics and arithmetic are recomputed, not judged.

Confidence bands are shown only for fields calibrated on our annotated test set. None is calibrated yet, so no band is shown.

What counts as a claim ›How we measure confidence ›How we check this ›

Are you an author, or do you see a problem with this page? Request a review