PreprintCited by 21Lipid Membrane Structure and BehaviorIon Transport and Channel RegulationProtein Structure and Dynamics

The DOI matches its Crossref record; 2 of the 2 references it cites were found in a registry or an index.

Functional Regulation of Aquaporin Dynamics by Lipid Bilayer Composition

Open access
Nguyen, Anh T. P., Weigle, Austin T., Shukla, Diwakar·2023·Nature Communications

Preprint — published as 10.1038/s41467-024-46027-y · Paper page

Abstract

With the diversity of lipid-protein interactions, any observed membrane protein dynamics or functions directly depend on the lipid bilayer selection. However, the implications of lipid bilayer choice are seldom considered unless characteristic lipid-protein interactions have been previously reported. Using molecular dynamics simulation, we characterize the effects of membrane embedding on plant aquaporin SoPIP2;1, which has no reported high-affinity lipid interactions. The regulatory impacts of a realistic lipid bilayer, and nine different homogeneous bilayers, on varying SoPIP2;1 dynamics were examined. We demonstrate that SoPIP2;1s structure, thermodynamics, kinetics, and water transport are altered as a function of each membrane construct’s ensemble properties. Notably, the realistic bilayer provides stabilization of non-functional SoPIP2;1 metastable states. Hydrophobic mismatch and lipid order parameter calculations further explain how lipid ensemble properties manipulate SoPIP2;1 behavior. Our results illustrate the importance of careful bilayer selection when studying membrane proteins. To this end, we advise cautionary measures when performing membrane protein molecular dynamics simulations.

Overview

The claims and statistics of this paper haven’t been checked yet.

Run the check — free, no account needed. It reads the open-access text and checks the sources it cites.

A few free checks a day · papers already verified open instantly · results are public

Integrity signals

Registry

Crossref · 10.1101/2023.07.20.549977

Cites

2 of 2 references verified0 citation errors · 0 not checkable

Statistics

Figures

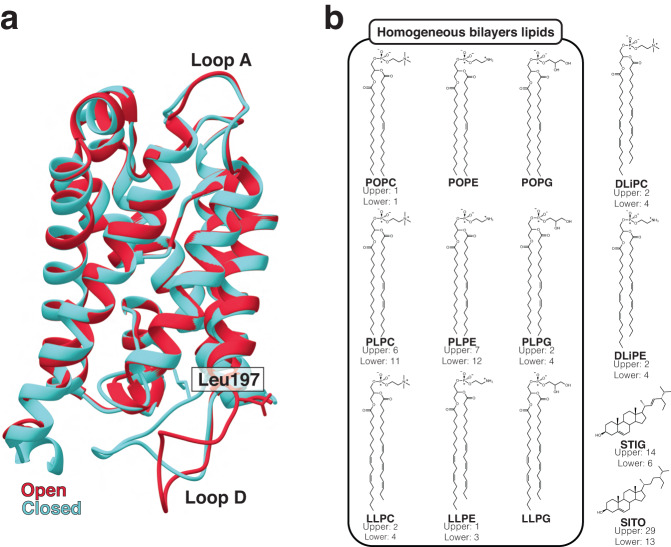
Fig. 1 System compositions of SoPIP2;1 molecular dynamics simulations. a Crystal structures of the open (PDB ID: 2B5F, red) and closed (PDB ID: 1Z98, blue) states of spinach aquaporin in the ribbon representation. Key differences between the structures are indicated, including the “plug residue” Leu197 (shown in the stick representation) and loop D. b Chemical structures of the lipids used and their composition in the complex lipid bilayer (if present). Enclosed in the box are the lipids used in the homogeneous bilayer systems, covering all three headgroups and varying levels of acyl chain unsaturation. POPC (1-palmitoyl-2-oleoyl-sn-glycero-3-phosphocholine; 16:0/18:1), POPE (1-palmitoyl-2-oleoyl-sn-glycero-3-phosphoethanolamine; 16:0/18:1), POPG (-palmitoyl-2-oleoyl-sn-glycero-3-phosphatidylglycerol; 16:0/18:1), PLPC (1-palmitoyl-2-linoleoyl-sn-glycero-3-phosphocholine; 16:0/18:2), PLPE (1-palmitoyl-2-linoleoyl-sn-glycero-3-phosphoethanolamine; 16:0/18:2), PLPG (1-palmitoyl-2-linoleoyl-sn-glycero-3-phosphatidylglycerol; 16:0/18:2), LLPC (1-linoleoyl-2-linolenoyl-sn-glycero-3-phosphocholine; 18:2/18:3), LLPE (1-linoleoyl-2-linolenoyl-sn-glycero-3-phosphoethanolamine; 18:2/18:3), LLPG (1-linoleoyl-2-linolenoyl-sn-glycero-3-phosphatidylglycerol; 18:2/18:3), DLiPC (1,2-dilinoleoyl-sn-glycero-3-phosphocholine; 18:2/18:2), DLiPE (1,2-dilinoleoyl-sn-glycero-3-phosphoethanolamine; 18:2/18:2), STIG (stigmasterol), and SITO (ß-sitosterol). For more information on lipid bilayer assembly and lipid names, please refer to our “Methods—System assembly” section.
Fig. 1 System compositions of SoPIP2;1 molecular dynamics simulations. a Crystal structures of the open (PDB ID: 2B5F, red) and closed (PDB ID: 1Z98, blue) states of spinach aquaporin in the ribbon representation. Key differences between the structures are indicated, including the “plug residue” Leu197 (shown in the stick representation) and loop D. b Chemical structures of the lipids used and their composition in the complex lipid bilayer (if present). Enclosed in the box are the lipids used in the homogeneous bilayer systems, covering all three headgroups and varying levels of acyl chain unsaturation. POPC (1-palmitoyl-2-oleoyl-sn-glycero-3-phosphocholine; 16:0/18:1), POPE (1-palmitoyl-2-oleoyl-sn-glycero-3-phosphoethanolamine; 16:0/18:1), POPG (-palmitoyl-2-oleoyl-sn-glycero-3-phosphatidylglycerol; 16:0/18:1), PLPC (1-palmitoyl-2-linoleoyl-sn-glycero-3-phosphocholine; 16:0/18:2), PLPE (1-palmitoyl-2-linoleoyl-sn-glycero-3-phosphoethanolamine; 16:0/18:2), PLPG (1-palmitoyl-2-linoleoyl-sn-glycero-3-phosphatidylglycerol; 16:0/18:2), LLPC (1-linoleoyl-2-linolenoyl-sn-glycero-3-phosphocholine; 18:2/18:3), LLPE (1-linoleoyl-2-linolenoyl-sn-glycero-3-phosphoethanolamine; 18:2/18:3), LLPG (1-linoleoyl-2-linolenoyl-sn-glycero-3-phosphatidylglycerol; 18:2/18:3), DLiPC (1,2-dilinoleoyl-sn-glycero-3-phosphocholine; 18:2/18:2), DLiPE (1,2-dilinoleoyl-sn-glycero-3-phosphoethanolamine; 18:2/18:2), STIG (stigmasterol), and SITO (ß-sitosterol). For more information on lipid bilayer assembly and lipid names, please refer to our “Methods—System assembly” section.CC BY · PubMed Central
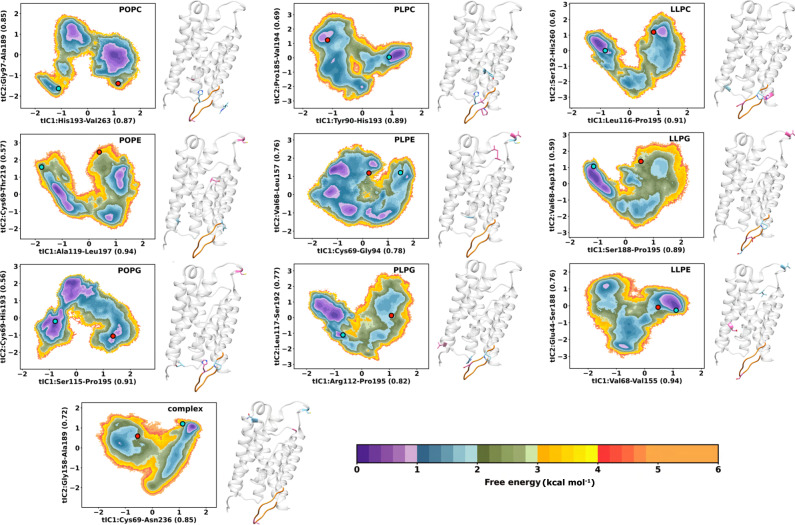
Fig. 2 Free energy of the SoPIP2;1 opening/closing transition from simulations. MSM-weighted (stationary distribution applied) energy landscapes of SoPIP2;1 conformational changes in lipid bilayer systems (nine homogeneous and one complex membrane) projected onto the first two components of the time-lagged independent component analysis (tICA). The clusters most similar to the open and closed crystal structures are located on the landscapes as a red and blue dot, respectively. The distance feature most correlated to each component is indicated on the axes labels and located on the crystal structure to the right of each landscape. The residues involved in the first and second time-lagged independent components (tIC1 and tIC2) are shown in the blue and pink stick representations, respectively. Loop D is highlighted in orange as a reference. The colorbars represent free energy expressed as kcal mol−1.
Fig. 2 Free energy of the SoPIP2;1 opening/closing transition from simulations. MSM-weighted (stationary distribution applied) energy landscapes of SoPIP2;1 conformational changes in lipid bilayer systems (nine homogeneous and one complex membrane) projected onto the first two components of the time-lagged independent component analysis (tICA). The clusters most similar to the open and closed crystal structures are located on the landscapes as a red and blue dot, respectively. The distance feature most correlated to each component is indicated on the axes labels and located on the crystal structure to the right of each landscape. The residues involved in the first and second time-lagged independent components (tIC1 and tIC2) are shown in the blue and pink stick representations, respectively. Loop D is highlighted in orange as a reference. The colorbars represent free energy expressed as kcal mol−1.CC BY · PubMed Central
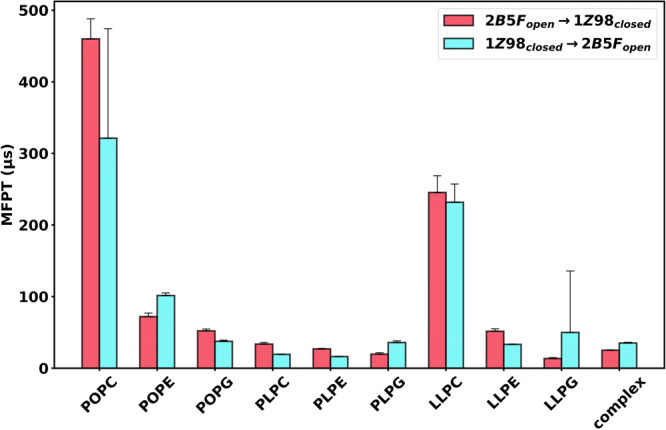
Fig. 3 Mean first passage time (MFPT) of SoPIP2;1 opening/closing transitions. MFPT of the transition between the crystal structure clusters in the landscapes of Fig. 2. Data are presented as mean values ± SEM of 200 bootstrapped samples. Individual data distributions for each MFPT calculation are provided in Supplementary Fig. 16.
Fig. 3 Mean first passage time (MFPT) of SoPIP2;1 opening/closing transitions. MFPT of the transition between the crystal structure clusters in the landscapes of Fig. 2. Data are presented as mean values ± SEM of 200 bootstrapped samples. Individual data distributions for each MFPT calculation are provided in Supplementary Fig. 16.CC BY · PubMed Central
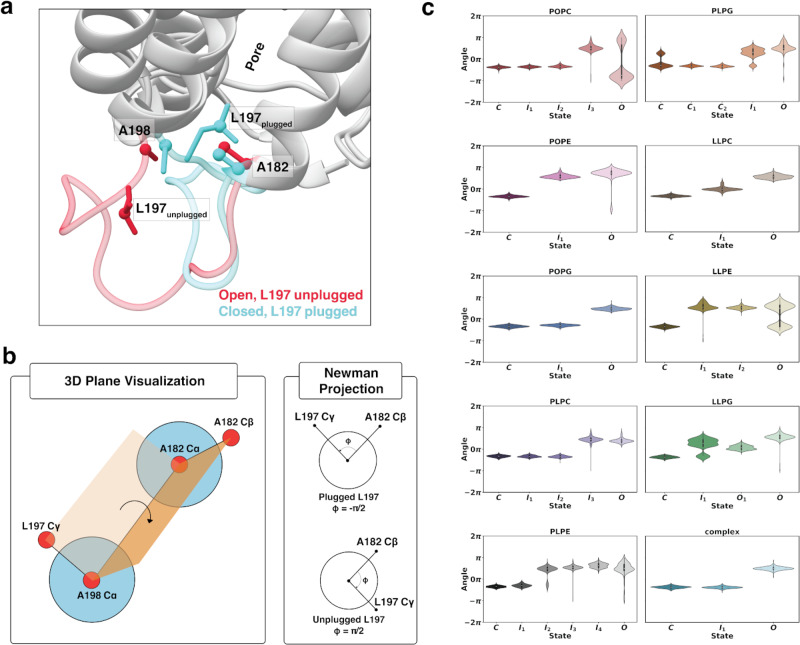
Fig. 4 Characterization of pore plug Leu197 in each of the respective SoPIP2:bilayer macrostates. a Atoms used in the dihedral angle calculation shown on the crystal structures of the open (PDB ID: 2B5F, pink) and closed (PDB ID: 1Z98, blue) states. Residues are shown in the stick representation, and atoms involved in the calculations are shown in the ball representation. b Simplified schematics of the dihedral angle between the Cγ of Leu197 and Cß of Ala182. c Violin plots of the dihedral angle in each macrostate of each lipid bilayer system. Distributions in (c) are calculated using 1000 randomly selected samples (frames) from each respective metastable state energy minima. Data in (c) are presented as mean values ± SEM.
Fig. 4 Characterization of pore plug Leu197 in each of the respective SoPIP2:bilayer macrostates. a Atoms used in the dihedral angle calculation shown on the crystal structures of the open (PDB ID: 2B5F, pink) and closed (PDB ID: 1Z98, blue) states. Residues are shown in the stick representation, and atoms involved in the calculations are shown in the ball representation. b Simplified schematics of the dihedral angle between the Cγ of Leu197 and Cß of Ala182. c Violin plots of the dihedral angle in each macrostate of each lipid bilayer system. Distributions in (c) are calculated using 1000 randomly selected samples (frames) from each respective metastable state energy minima. Data in (c) are presented as mean values ± SEM.CC BY · PubMed Central
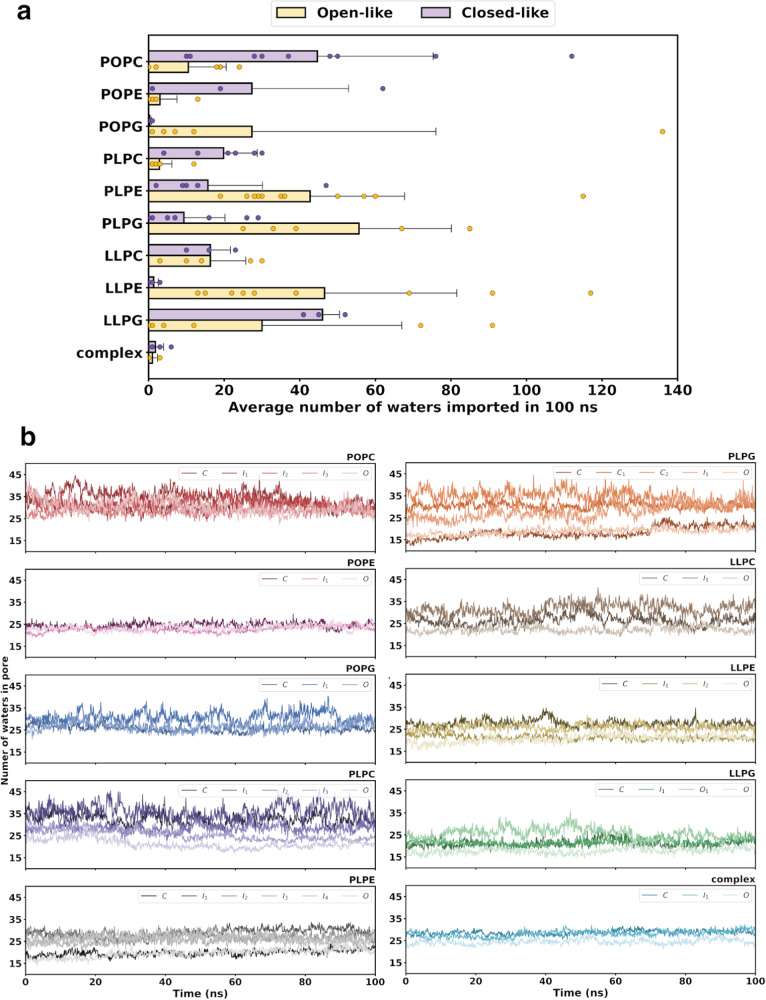
Fig. 5 Water transport activity of SoPIP2;1. a Average number of waters transported per 100-ns trajectory for the open-like (yellow) and closed-like (purple) SoPIP2;1 macrostates. Errors are calculated as standard deviations among the closed-like or open-like trajectories. b Time evolution of the average number of waters occupying the protein pore of each macrostate in each bilayer system. Water transport data shown here was calculated using n = 3, where three independent continuous 100-ns trajectories (10,000 frames) were selected from each metastable free energy state per SoPIP2:lipid system. For reported water transport values in (a), data were grouped based off the relative open-like or closed-like character of the metastable state trajectories. Data in (a) are presented as mean values ± SEM.
Fig. 5 Water transport activity of SoPIP2;1. a Average number of waters transported per 100-ns trajectory for the open-like (yellow) and closed-like (purple) SoPIP2;1 macrostates. Errors are calculated as standard deviations among the closed-like or open-like trajectories. b Time evolution of the average number of waters occupying the protein pore of each macrostate in each bilayer system. Water transport data shown here was calculated using n = 3, where three independent continuous 100-ns trajectories (10,000 frames) were selected from each metastable free energy state per SoPIP2:lipid system. For reported water transport values in (a), data were grouped based off the relative open-like or closed-like character of the metastable state trajectories. Data in (a) are presented as mean values ± SEM.CC BY · PubMed Central
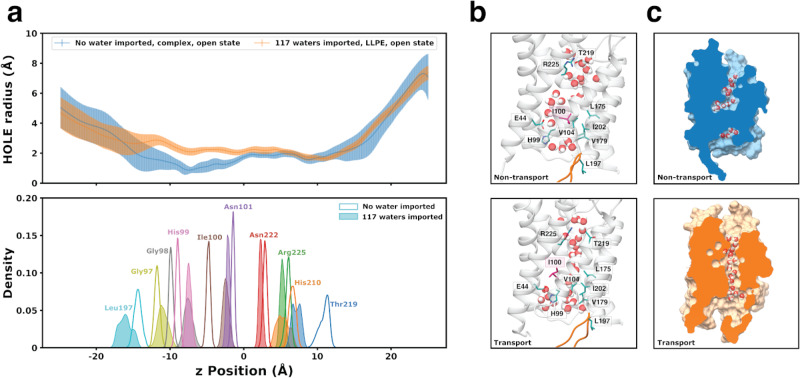
Fig. 6 Structural comparison of two extreme transport cases for the SoPIP2;1 open state embedded in two different lipid bilayers system (LLPE and complex). a Pore HOLE radius along the z-position of the SoPIP2;1 protein pore aligned with the distribution of the Cß z-positions in key residues inside the protein pore (the ar/R selectivity filter, NPA motif, and coil occluding the pore). The error bar for the radius at each z position is calculated as the standard deviation of the 10,000 frames of the trajectory. b Hydrogen bonding and hydrophobic interaction of key residues most different between the non-transport (top) and transport (bottom) cases. Highlighted residues are shown in stick representations. Leu197 and loop D are also shown as a reference point. c Cross section of the SoPIP2;1 pore surface indicating water blockage of the non-transporting open SoPIP2;1 (top, blue) and transporting open SoPIP2;1 (bottom, orange). Data in (a) are presented as mean values across the trajectory for each given point in the pore ± SD.
Fig. 6 Structural comparison of two extreme transport cases for the SoPIP2;1 open state embedded in two different lipid bilayers system (LLPE and complex). a Pore HOLE radius along the z-position of the SoPIP2;1 protein pore aligned with the distribution of the Cß z-positions in key residues inside the protein pore (the ar/R selectivity filter, NPA motif, and coil occluding the pore). The error bar for the radius at each z position is calculated as the standard deviation of the 10,000 frames of the trajectory. b Hydrogen bonding and hydrophobic interaction of key residues most different between the non-transport (top) and transport (bottom) cases. Highlighted residues are shown in stick representations. Leu197 and loop D are also shown as a reference point. c Cross section of the SoPIP2;1 pore surface indicating water blockage of the non-transporting open SoPIP2;1 (top, blue) and transporting open SoPIP2;1 (bottom, orange). Data in (a) are presented as mean values across the trajectory for each given point in the pore ± SD.CC BY · PubMed Central
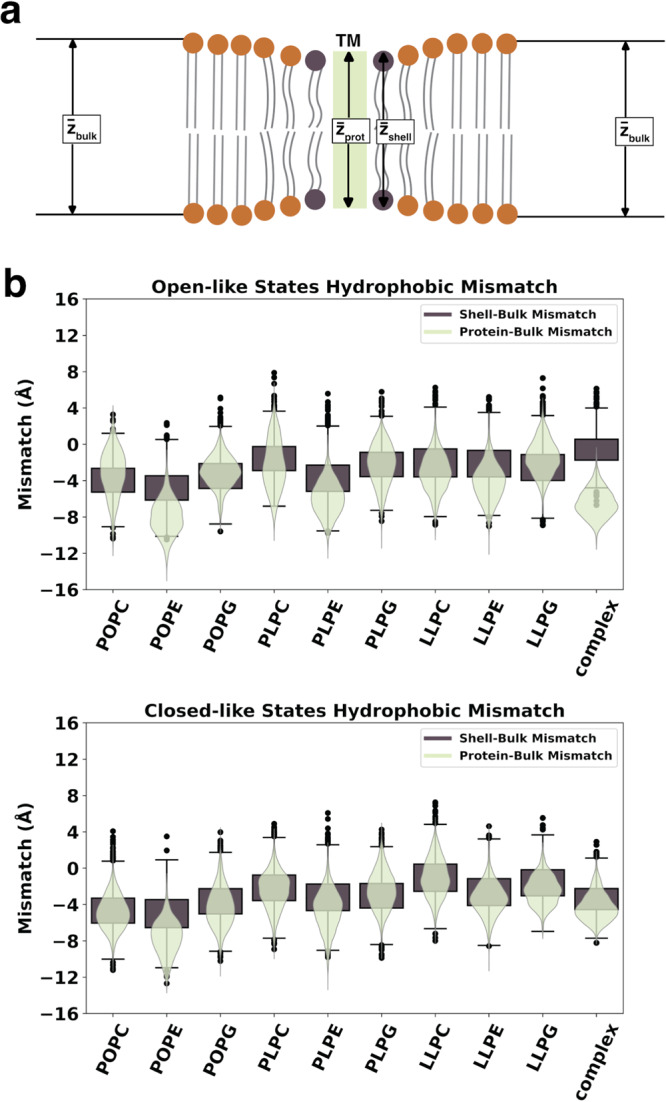
Fig. 7 Mismatch in thickness of SoPIP2;1 and the bilayer. a Schematics of protein thickness, annular shell thickness, and bulk membrane thickness. Mismatch is calculated as the difference between the protein thickness and the bulk membrane thickness, along with the difference between the annular shell thickness and the bulk membrane thickness. b Violin plots of the protein-bulk mismatch (light green) and box plots of the shell-bulk mismatch (dark brown) for the open- and closed-like macrostates of each bilayer system. Distributions in (b) are calculated using 1000 randomly selected samples (frames) from each respective metastable state energy minima. Data in (b) are presented as mean values ± SEM.
Fig. 7 Mismatch in thickness of SoPIP2;1 and the bilayer. a Schematics of protein thickness, annular shell thickness, and bulk membrane thickness. Mismatch is calculated as the difference between the protein thickness and the bulk membrane thickness, along with the difference between the annular shell thickness and the bulk membrane thickness. b Violin plots of the protein-bulk mismatch (light green) and box plots of the shell-bulk mismatch (dark brown) for the open- and closed-like macrostates of each bilayer system. Distributions in (b) are calculated using 1000 randomly selected samples (frames) from each respective metastable state energy minima. Data in (b) are presented as mean values ± SEM.CC BY · PubMed Central
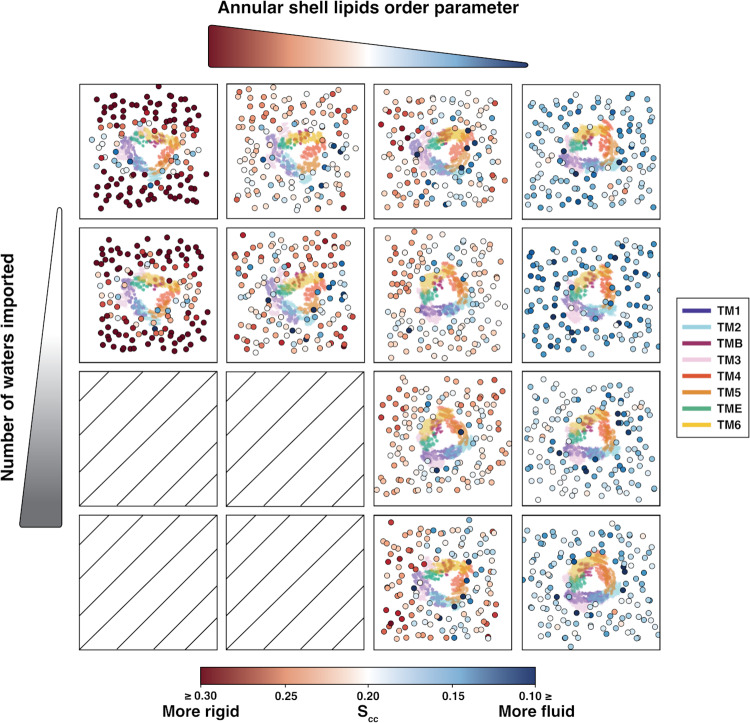
Fig. 8 Water transport activity and lipid order parameter in the open states of the homogeneous bilayer systems. Each square shows the projection on the xy plane of the lipids (scatter dots colored by average lipid order parameter, Scc, bottom legend) and protein (heatmap colored by transmembrane helices, right legend) for one 100-ns representative trajectory of a given water conductivity and average annular shell order parameter. Empty squares indicate no trajectory found for high water transport activity and high lipid order parameters. The red-to-blue colorbar represents the Scc order parameter.
Fig. 8 Water transport activity and lipid order parameter in the open states of the homogeneous bilayer systems. Each square shows the projection on the xy plane of the lipids (scatter dots colored by average lipid order parameter, Scc, bottom legend) and protein (heatmap colored by transmembrane helices, right legend) for one 100-ns representative trajectory of a given water conductivity and average annular shell order parameter. Empty squares indicate no trajectory found for high water transport activity and high lipid order parameters. The red-to-blue colorbar represents the Scc order parameter.CC BY · PubMed Central

Verification

Claims the paper makes

The claims and statistics of this paper haven’t been checked yet.

Run the check — free, no account needed. It reads the open-access text and checks the sources it cites.

A few free checks a day · papers already verified open instantly · results are public

Self-check

Percentages, sums and reported differences re-computed from the paper’s own numbers.

The self-check needs the paper’s full text.

Citations

Cites

Show all 2 references

Research works printed but not linked: 92

  1. 10.1006/jmbi.2000.4315 · DOI · Paper page
  2. 10.1038/nrd.2016.230 · DOI · Paper page
  3. 2021, Membrane protein production and formulation for drug discovery, Trends Pharmacol. Sci, 42, 657, 10.1016/j.tips.2021.05.006 · DOI
  4. 2023, Membrane proteins in plant salinity stress perception, sensing, and response, J. Membrane Biol, 256, 109, 10.1007/s00232-023-00279-9 · DOI
  5. wwPDB consortium, 2019, Protein Data Bank: the single global archive for 3D macromolecular structure data, Nucleic Acids Res, 47, D520, 10.1093/nar/gky949 · DOI · Paper page
  6. 2019, Emerging diversity in lipidprotein interactions, Chem. Rev, 119, 5775, 10.1021/acs.chemrev.8b00451 · DOI
  7. 2019, Computational modeling of realistic cell membranes, Chem. Rev, 119, 6184, 10.1021/acs.chemrev.8b00460 · DOI
  8. 2023, Regulation of membrane protein structure and function by their lipid nano-environment, Nat. Rev. Mol. Cell Biol, 24, 107, 10.1038/s41580-022-00524-4 · DOI
  9. 10.1007/s00232-015-9802-0 · DOI · Paper page
  10. 2018, Lipidprotein interactions are unique fingerprints for membrane proteins, ACS Cent. Sci, 4, 709, 10.1021/acscentsci.8b00143 · DOI
  11. 2020, Lipid-protein interactions modulate the conformational equilibrium of a potassium channel, Nat. Commun, 11, 2162, 10.1038/s41467-020-15741-8 · DOI
  12. 2021, Impact of increased membrane realism on conformational sampling of proteins, J. Chem. Theory Comput, 17, 5342, 10.1021/acs.jctc.1c00276 · DOI
  13. 10.1021/acs.jctc.8b01066 · DOI
  14. Azad, A. K. ; Raihan, T. ; Ahmed, J. ; Hakim, A. ; Emon, T. H. ; Chowdhury, P. A . Human aquaporins: functional diversity and potential roles in infectious and non-infectious diseases. Front. Genet. 2021, 12 . · DOI
  15. 10.1152/physrev.00008.2015 · DOI
  16. 10.1073/pnas.1210373109 · DOI
  17. 10.1016/j.cell.2016.08.003 · DOI
  18. 10.1021/acs.chemrev.6b00344 · DOI · Paper page
  19. 2017, Towards understanding the molecular basis of ion channel modulation by lipids: Mechanistic models and current paradigms, Biochim. Biophys. Acta Biomembr, 1859, 1507, 10.1016/j.bbamem.2017.04.003 · DOI
  20. 2015, Lipid agonism: The PIP2 paradigm of ligand-gated ion channels, Biochim. Biophys. Acta Mol. Cell Biol. Lipids, 1851, 620
  21. 10.1038/nature04316 · DOI
  22. 2019, Molecular basis of the glucose transport mechanism in plants, ACS Cent. Sci, 5, 1085, 10.1021/acscentsci.9b00252 · DOI
  23. 2019, Distinct Substrate Transport Mechanism Identified in Homologous Sugar Transporters, The Journal of Physical Chemistry B, 123, 8411, 10.1021/acs.jpcb.9b08257 · DOI
  24. 10.1101/2022.10.12.511964 · DOI
  25. 10.1093/nar/gkm276 · DOI
  26. 10.1021/ct200133y · DOI
  27. 10.1002/jcc.20945 · DOI · Paper page
  28. 10.1105/tpc.10.3.451 · DOI
  29. 10.1105/tpc.8.7.1181 · DOI
  30. 10.1002/jcc.23702 · DOI
  31. 10.1021/acs.jctc.5b00935 · DOI
  32. 10.1021/jp973084f · DOI
  33. 10.1002/jcc.23354 · DOI
  34. 10.1021/ct5010406 · DOI
  35. 10.1002/jcc.20290 · DOI · Paper page
  36. 2019, Best practices for foundations in molecular simulations, Living J. Comp. Mol. Sci, 1, 5957
  37. 1978, Molecular-dynamics study of a three-dimensional one component model for distortive phase transitions, Phys. Rev. B, 17, 1302, 10.1103/PhysRevB.17.1302 · DOI · Paper page
  38. 10.1016/0021-9991(77)90098-5 · DOI
  39. 10.1063/1.470117 · DOI
  40. 10.1529/biophysj.107.125187 · DOI
  41. 10.1021/ct900620b · DOI
  42. 2011, Characterization and rapid sampling of protein folding Markov state model topologies, Journal of chemical theory and computation, 7, 3405, 10.1021/ct2004484 · DOI
  43. 2015, FAST Conformational Searches by Balancing Exploration/Exploitation Trade-Offs, Journal of Chemical Theory and Computation, 11, 5747, 10.1021/acs.jctc.5b00737 · DOI
  44. Shamsi, Z. ; Moffett, A. S. ; Shukla, D . Enhanced unbiased sampling of protein dynamics using evolutionary coupling information. Scientific Reports 2017, 7 . · DOI
  45. Kleiman, D. E. ; Shukla, D . Active Learning of the Conformational Ensemble of Proteins Using Maximum Entropy VAMPNets. Journal of Chemical Theory and Computation 2023, Article ASAP, DOI: https://doi.org/10.1021/acs.jctc.3c00040 (accessed 2023-04-07). · DOI
  46. 2022, Multiagent reinforcement learning-based adaptive sampling for conformational dynamics of proteins, Journal of Chemical Theory and Computation, 18, 5422, 10.1021/acs.jctc.2c00683 · DOI
  47. 10.1016/j.bpj.2015.08.015 · DOI
  48. 10.1021/acs.jctc.5b00743 · DOI
  49. 10.1021/jacs.7b12191 · DOI
  50. 10.1021/ar5002999 · DOI
  51. 2013, Cloud-based simulations on Google Exacycle reveal ligand modulation of GPCR activation pathways, Nature Chemistry, 6, 15
  52. Shukla, D. ; Meng, Y. ; Roux, B. ; Pande, V. S . Activation pathway of Src kinase reveals intermediate states as targets for drug design. Nature Communications 2014, 5 . · DOI · Paper page
  53. 2019, Common activation mechanism of class A GPCRs, eLife, 8, e50279, 10.7554/eLife.50279 · DOI
  54. 2018, Rapid calculation of molecular kinetics using compressed sensing, J. Chem. Theory Comput, 14, 2771, 10.1021/acs.jctc.8b00089 · DOI
  55. 10.1016/S0263-7855(97)00009-X · DOI
  56. 10.1038/s42003-021-02156-4 · DOI
  57. 10.1002/jcc.21787 · DOI
  58. Carr, M. ; MacPhee, C. E . Membrainy: a smart, unified membrane analysis tool. Source Code Biol. Med. 2015, 10, 3. · DOI
  59. 10.1016/j.exer.2013.04.022 · DOI
  60. 10.1016/j.bpj.2012.09.025 · DOI
  61. 2021, LiPyphilic: A Python toolkit for the analysis of lipid membrane simulations, J. Chem. Theory Comput, 17, 5907, 10.1021/acs.jctc.1c00447 · DOI
  62. 10.1021/ct400341p · DOI
  63. 10.1002/jcc.20084 · DOI
  64. 2020, Membrane chemistry tunes the structure of a peptide transporter, Angew. Chem., Int. Ed, 59, 19121, 10.1002/anie.202008226 · DOI
  65. 10.1016/j.addr.2011.11.011 · DOI
  66. Kirscht, A. ; Survery, S. ; Kjellbom, P. ; Johanson, U . Increased permeability of the aquaporin SoPIP2;1 by mercury and mutations in loop A. Front. Plant Sci. 2016, 7 . · DOI
  67. 2015, Molecular dynamics insights into human aquaporin 2 water channel, Biophys. Chem, 207, 107, 10.1016/j.bpc.2015.10.002 · DOI
  68. 1998, A set of van der Waals and coulombic radii of protein atoms for molecular and solvent-accessible surface calculation, packing evaluation, and docking, Proteins: Struct. Funct. Bioinf, 32, 111, 10.1002/(SICI)1097-0134(19980701)32:1<111::AID-PROT12>3.0.CO;2-H · DOI
  69. 10.1016/j.bpj.2012.03.014 · DOI
  70. 10.1529/biophysj.105.073395 · DOI
  71. 10.1016/j.chemphyslip.2013.01.006 · DOI
  72. Peruzzi, J. A. ; Steinkhler, J. ; Vu, T. Q. ; Gunnels, T. F. ; Lu, P. ; Baker, D. ; Kamat, N. P. Hydrophobic mismatch drives self-organization of designer proteins into synthetic membranes. 2022; https://www.biorxiv.org/content/10.1101/2022.06.01.494374v1. · DOI
  73. 10.1016/S0304-4157(98)00017-3 · DOI
  74. 10.1126/science.1174621 · DOI · Paper page
  75. 10.1016/0009-3084(94)02411-W · DOI
  76. 10.1021/ja103975g · DOI
  77. 1977, Deuterium magnetic resonance: theory and application to lipid membranes, Quaterly Review of Biophysics, 10, 353418
  78. 10.1021/bi00609a021 · DOI
  79. 1995, NMR measurement of signs and magnitudes of C-H dipolar couplings in Lecithin, J. Am. Chem. Soc, 117, 3310, 10.1021/ja00116a051 · DOI
  80. 10.1021/ja962951b · DOI
  81. 2017, On the calculation of acyl chain order parameters from lipid simulations, J. Chem. Theory Comput, 13, 5683, 10.1021/acs.jctc.7b00643 · DOI
  82. 10.1073/pnas.0809959106 · DOI
  83. 2023, The plasma membrane as an adaptable fluid mosaic, Biochim. Biophys. Acta Biomembr, 1865, 184114, 10.1016/j.bbamem.2022.184114 · DOI
  84. 10.1042/BST0330938 · DOI
  85. 10.1016/j.bbamem.2004.06.012 · DOI
  86. 2019, PACKMOL-Memgen: A simple-to-use, generalized workflow for membrane-proteinlipid-bilayer system building, J. Chem. Inf. Model, 59, 2522, 10.1021/acs.jcim.9b00269 · DOI
  87. 10.1021/acs.jcim.1c01388 · DOI
  88. 10.1038/nature12395 · DOI
  89. Gu, R.-X. ; de Groot, B. L . Central cavity dehydration as a gating mechanism of potassium channels. Nat. Commun. 2023, 14 . · DOI
  90. 2019, Dewetting Controls Plant Hormone Perception and Initiation of Drought Resistance Signaling, Structure, 27, 692, 10.1016/j.str.2018.12.005 · DOI
  91. 2021, Role of substrate recognition in modulating strigolactone receptor selectivity in witchweed, Journal of Biological Chemistry, 297, 101092, 10.1016/j.jbc.2021.101092 · DOI
  92. 10.48550/arXiv.2302.12145 · DOI

Metadata

Authors
Nguyen, A. T. P., Weigle, A. T., & Shukla, D.
Affiliations
University of Illinois Urbana-Champaign (US)
Corresponding author
Shukla, Diwakar
Venue
Nature Communications
Publisher
openRxiv
Published
2023-07-22
Volume
15
Issue
1
Pages
1848-1848
ISSN
2041-1723 (ISSN-L)
OpenAlex
W4392230070
Cited by
21
References
2
Citations by year
2026: 10 · 2025: 7 · 2024: 4
FWCI
2.85
Type
journal article
Language
en
Open access
Licence
cc-by
Locations
  • Nature Communications (publishedVersion, cc-by)
  • bioRxiv (Cold Spring Harbor Laboratory) (acceptedVersion, cc-by-nc-nd)
  • PubMed Central (publishedVersion, cc-by)
  • PubMed (publishedVersion)
  • PubMed Central (submittedVersion, cc-by-nc-nd)
  • RePEc: Research Papers in Economics (submittedVersion)
  • DOAJ (DOAJ: Directory of Open Access Journals) (submittedVersion, cc-by-sa)
Funders
  • U.S. Department of Health and Human Services (R35GM142745)
  • National Institutes of Health
  • University of Illinois at Urbana-Champaign
  • National Institute of General Medical Sciences (R35GM142745)
Topics
  • Life Sciences › Biochemistry, Genetics and Molecular Biology › Molecular Biology › Lipid Membrane Structure and Behavior
  • Life Sciences › Biochemistry, Genetics and Molecular Biology › Molecular Biology › Ion Transport and Channel Regulation
  • Life Sciences › Biochemistry, Genetics and Molecular Biology › Molecular Biology › Protein Structure and Dynamics
Keywords
lipid bilayer composition, membrane protein dynamics, protein-lipid interactions, water transport, hydrophobic mismatch, lipid order parameter, metastable states, plant plasma membrane

About these checks

Registry, retraction, Cites and statistics results are computed, not judged, with one exception: a printed reference that no index lists is read once by a model before it counts as a citation error. Claims are extracted by a model and kept only when their quote appears verbatim in the text; each cited source is then checked, with a model’s help, for whether it says what the claim relies on. Those verdicts can be wrong — read the claim’s quote and the cited source before relying on one.

Statistics and arithmetic are recomputed, not judged.

Confidence bands are shown only for fields calibrated on our annotated test set. None is calibrated yet, so no band is shown.

What counts as a claim ›How we measure confidence ›How we check this ›

Are you an author, or do you see a problem with this page? Request a review

How to cite

Cite CoChat for the checks on this page, and the paper for its own findings.

This page
CoChat. (2026). Citation check: Functional Regulation of Aquaporin Dynamics by Lipid Bilayer Composition. https://app.cochat.ai/papers/10.1101/2023.07.20.549977
The paper
Nguyen, A. T. P., Weigle, A. T., & Shukla, D. (2023). Functional Regulation of Aquaporin Dynamics by Lipid Bilayer Composition. Nature Communications. https://doi.org/10.1101/2023.07.20.549977