

The DOI matches its Crossref record; 1 of the 1 references it cites were found in a registry or an index.
T and Z , Partial Seed Coat Patterning Genes in Common Bean, Provide Insight into the Structure and Protein Interactions of a Plant MBW Complex
Open accessPreprint — published as 10.1093/g3journal/jkae184 · Paper page
Abstract
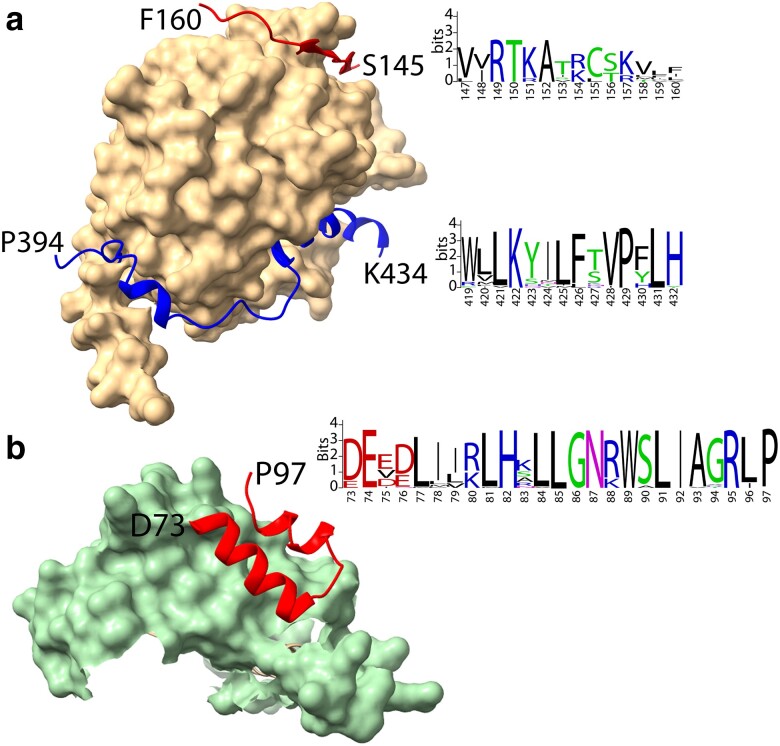
Flavonoids are secondary metabolites associated with seed and flower color. A ternary MBW protein complex consisting of interfacing M YB, b eta-helix-loop-helix (bHLH), and W D40 repeat (WDR) proteins controls the expression of late biosynthetic genes in the flavonoid pathway. P , the master regulator gene of flavonoid expression in common bean ( Phaseolus vulgaris L.) was recently determined to encode a bHLH protein. Two other genes, T and Z , are also historically considered regulators since they determine the distribution of color in seeds and flowers. These two genes were cloned using reverse genetics based on genetic mapping, candidate gene selection, phylogenetic analysis, and mutant analysis. Domain and AlphaFold2 structure analyses determined T encoded a seven-bladed β-propeller WDR protein, while Z encoded a R2R3 MYB protein. Modeling of the Z MYB/P bHLH/T WDR MBW complex identified interfacing sequence domains and motif in all three genes that are conserved in dicots. One Z MYB motif is a possible β-MoRF that only appears in a structured state when Z MYB is modeled in a MBW complex. Complexes containing mutant T and Z proteins changed the interaction of members of the complex in ways that would alter their role in regulating expression of genes in the flavonoid pathway. Highlight: The MBW complex of bean comprised of the classic Z , P , and T genes associated with seed coat patterning defines critical proteins interactions for flavonoid gene expression.
Overview
The claims and statistics of this paper haven’t been checked yet.
Run the check — free, no account needed. It reads the open-access text and checks the sources it cites.
Integrity signals
Registry
Cites
Statistics
Figures
Verification
Claims the paper makes
The claims and statistics of this paper haven’t been checked yet.
Run the check — free, no account needed. It reads the open-access text and checks the sources it cites.
Self-check
Percentages, sums and reported differences re-computed from the paper’s own numbers.
The self-check needs the paper’s full text.
Citations
Cites
Highly accurate protein structure prediction with AlphaFold
Jumper, J., Evans, R., Pritzel, A., Green, T., Figurnov, M., Ronneberger, O., Tunyasuvunakool, K., Bates, R., Žídek, A., Potapenko, A., et al. (2021) · Nature · doi:10.1038/s41586-021-03819-2 · Cited by 43,764
Research works printed but not linked: 64
- 10.1111/boj.12385 · DOI · Paper page
- 2001, Inheritance of the Fib gene (from 5-593) for fibula arcs pattern of partly colored seed coat in the background genotype t P [C r] Z J G B V Rk, Annual Report of the Bean Improvement Cooperative, 44, 171
- 2007, Genetics of seed coat color and pattern in common bean, Plant Breeding Reviews, 2, 239
- 2011, The genetics of the color pattern of seed coats in G19833, a Liborino class common bean, Annual Report of the Bean Improvement Cooperative, 54, 50
- 1999, Allelism found between two common bean genes, hilum ring color ( D) and partly colored seedcoat pattern (Z), formerly assumed to be independent, Journal of the American Society for Horticultural Science, 124, 649, 10.21273/JASHS.124.6.649 · DOI
- 1998, Molecular markers associated with T and Z, two genes controlling partly colored seed coat patterns in common bean, Crop Science, 38, 1073, 10.2135/cropsci1998.0011183X003800040031x · DOI
- 10.2135/cropsci2014.09.0653 · DOI
- 2021, The interaction of MYB, bHLH and WD40 transcription factors in red pear (Pyrus pyrifolia) peel, Plant Molecular Biology, 106, 407, 10.1007/s11103-021-01160-w · DOI
- 10.1016/j.tplants.2010.06.005 · DOI · Paper page
- 2004, MUSCLE, multiple sequence alignment with high accuracy and high throughput, Nucleic Acids Research, 3, 1792
- 1909, Factors for mottling in beans, Journal of Heredity, 1, 368
- 10.1093/nar/gkab408 · DOI · Paper page
- 10.1101/2021.10.04.4630342021-10 · DOI
- 10.1074/jbc.M603262200 · DOI
- 2011, Evolutionary and comparative analysis of MYB and bHLH plant transcription factors, The Plant Journal, 661, 94
- 2018, Tomato SlAN11 regulates flavonoid biosynthesis and seed dormancy by interaction with bHLH proteins but not with MYB proteins, Horticulture Research, 5, 27, 10.1038/s41438-018-0032-3 · DOI
- 10.1101/gad.6.5.864 · DOI · Paper page
- 1990, Transactivation of anthocyanin biosynthetic genes following transfer of B regulatory genes into maize tissues, The EMBO Journal, 9, 2517, 10.1002/j.1460-2075.1990.tb07431.x · DOI · Paper page
- 10.1111/j.1365-313X.2007.03373.x · DOI · Paper page
- 2019, Characterization and diagnostic marker for TTG1 regulating tannin and anthocyanin biosynthesis in faba bean, Scientific Reports, 91, 1
- 10.1371/journal.pone.0013230 · DOI
- 10.1007/s10930-018-9785-7 · DOI · Paper page
- 10.1093/bioinformatics/btu744 · DOI
- 10.1111/nph.16290 · DOI
- 10.1073/pnas.1205513109 · DOI
- 10.1016/j.jmb.2007.05.022 · DOI · Paper page
- 10.1093/molbev/msw054 · DOI · Paper page
- 1932, Zur Genetik von Phaseolus vulgaris. IV. Studien über genenkoppelung, mit inem Fall von erblich bedingtem wechselnden Crossoverprozent, Hereditas, 17, 21
- 10.1016/j.tplants.2012.05.004 · DOI · Paper page
- 2021, A hydrophobic residue stabilizes dimers of regulatory ACT-like domains in plant basic helix–loop–helix transcription factors, Journal of Biological Chemistry, 296, 100708, 10.1016/j.jbc.2021.100708 · DOI
- 10.1016/S0092-8674(00)81536-6 · DOI · Paper page
- 2018, A WD40 repeat protein from Camellia sinensis regulates anthocyanin and proanthocyanidin accumulation through the formation of MYB– bHLH–WD40 ternary complexes, International Journal of Molecular Sciences, 19, 1686, 10.3390/ijms19061686 · DOI
- 10.1104/pp.114.241877 · DOI
- 10.1021/bi0602718 · DOI · Paper page
- 2021, Dissecting the transcriptional regulation of proanthocyanidin and anthocyanin biosynthesis in soybean (Glycine max), Plant Biotechnology Journal, 19, 1429, 10.1111/pbi.13562 · DOI
- 10.1111/nph.15259 · DOI
- 10.3389/fpls.2022.869582 · DOI
- 2002, Molecular and phenotypic mapping of genes controlling seed coat pattern and color in common bean (Phaseolus vulgaris L.), Journal of Heredit, 932, 148
- 10.1105/tpc.19.00480 · DOI
- 10.1016/j.tplants.2019.07.003 · DOI
- 2022, ColabFold: making protein folding accessible to all, Nature Methods, 19, 679, 10.1038/s41592-022-01488-1 · DOI · Paper page
- 10.3835/plantgenome2016.02.0012 · DOI
- 10.1016/j.jmb.2006.07.087 · DOI · Paper page
- 10.1016/0092-8674(89)90682-X · DOI · Paper page
- 10.1105/tpc.12.10.1863 · DOI · Paper page
- 10.1105/tpc.13.9.2099 · DOI
- 10.1104/pp.109.144022 · DOI
- 10.1093/genetics/156.3.1349 · DOI · Paper page
- 10.1002/PRO.3943 · DOI · Paper page
- 10.1038/ng.3008 · DOI
- 10.1038/nsb0195-69 · DOI
- 10.1016/S0968-0004(99)01384-5 · DOI · Paper page
- 10.1007/BF02900361 · DOI
- 10.1038/nbt.3988 · DOI · Paper page
- 10.1111/j.1365-313X.2007.03078.x · DOI · Paper page
- 10.1111/j.1469-8137.2010.03421.x · DOI
- 10.1021/bi047944b · DOI
- 1912, Bastardierungsversuche an levkojen, erbsen und nohnen mitrücksicht auf die faktorenlehre, Zeitscjroft fur Induktive Abstrammungs und Vererbungslehre, 7, 81
- 10.1105/tpc.11.7.1337 · DOI · Paper page
- 2022, Structural insights into partner selection for MYB and bHLH transcription factor complexes, Nature Plants, 8, 1108, 10.1038/s41477-022-01223-w · DOI
- 2020, Structural insights into target DNA recognition by R2R3-MYB transcription factors, Nucleic Acids Research, 48, 460
- 10.1016/j.molp.2017.08.012 · DOI
- 10.3390/plants6040065 · DOI
- 10.1242/dev.00681 · DOI · Paper page
Metadata
- Authors
- McClean, P. E., Roy, J., Colbert, C. L., Osborne, C., Lee, R., Miklas, P. N., & Osorno, J. M.
- Affiliations
- North Dakota State University (US)
- Agricultural Research Service (US)
- Corresponding author
- McClean, Phillip E.
- Venue
- G3 Genes Genomes Genetics
- Publisher
- openRxiv
- Published
- 2023-10-01
- Volume
- 14
- Issue
- 10
- ISSN
- 2160-1836 (ISSN-L)
- PMC
- PMC11457125
- OpenAlex
- W4401782765
- Cited by
- 13
- References
- 1
- Citations by year
- 2026: 7 · 2025: 6
- FWCI
- 1.77
- Type
- journal article
- Language
- en
- Open access
- gold
- doi.org
- Licence
- cc-by
- Locations
- G3 Genes Genomes Genetics (publishedVersion, cc-by)
- bioRxiv (Cold Spring Harbor Laboratory) (acceptedVersion)
- PubMed Central (publishedVersion, cc-by)
- PubMed (publishedVersion)
- Funders
- U.S. Department of Agriculture
- National Institutes of Health
- Agricultural Research Service
- National Institute of General Medical Sciences (R15GM146232, R01GM126207)
- Topics
- Life Sciences › Biochemistry, Genetics and Molecular Biology › Molecular Biology › Plant Gene Expression Analysis
- Life Sciences › Agricultural and Biological Sciences › Plant Science › Plant Molecular Biology Research
- Life Sciences › Biochemistry, Genetics and Molecular Biology › Genetics › Genetic Mapping and Diversity in Plants and Animals
- Keywords
- T gene, flavonoid biosynthesis, MBW complex, MYB, bHLH, WD40 repeats, Phaseolus vulgaris, protein-protein interaction, protein structure, flower color, seed color
- MeSH terms
- Flavonoids, Models, Molecular, Mutation, Phylogeny, Plant Proteins, Protein Binding, Seeds, Genes, Plant, Gene Expression Regulation, Plant, Phaseolus, Basic Helix-Loop-Helix Transcription Factors, Basic Helix-Loop-Helix Proteins
About these checks
Registry, retraction, Cites and statistics results are computed, not judged, with one exception: a printed reference that no index lists is read once by a model before it counts as a citation error. Claims are extracted by a model and kept only when their quote appears verbatim in the text; each cited source is then checked, with a model’s help, for whether it says what the claim relies on. Those verdicts can be wrong — read the claim’s quote and the cited source before relying on one.
Statistics and arithmetic are recomputed, not judged.
Confidence bands are shown only for fields calibrated on our annotated test set. None is calibrated yet, so no band is shown.
What counts as a claim ›How we measure confidence ›How we check this ›
Are you an author, or do you see a problem with this page? Request a review
How to cite
Cite CoChat for the checks on this page, and the paper for its own findings.
- This page
- CoChat. (2026). Citation check: T and Z , Partial Seed Coat Patterning Genes in Common Bean, Provide Insight into the Structure and Protein Interactions of a Plant MBW Complex. https://app.cochat.ai/papers/10.1101/2023.09.28.560026
- The paper
- McClean, P. E., Roy, J., Colbert, C. L., Osborne, C., Lee, R., Miklas, P. N., & Osorno, J. M. (2023). T and Z , Partial Seed Coat Patterning Genes in Common Bean, Provide Insight into the Structure and Protein Interactions of a Plant MBW Complex. G3 Genes Genomes Genetics. https://doi.org/10.1101/2023.09.28.560026
Data sources
Bibliographic data: Semantic Scholar, OpenAlex, Crossref.
Contains information from the Semantic Scholar Academic Graph Datasets, made available under the ODC Attribution License (ODC-BY 1.0).
Semantic Scholar’s data is described in: Kinney, R., et al. (2023). The Semantic Scholar Open Data Platform. arXiv:2301.10140.
