

The DOI matches its Crossref record; 1 of the 1 references it cites were found in a registry or an index.
Structure-Aware Annotation of Leucine-rich Repeat Domains
Open accessPreprint — published as 10.1371/journal.pcbi.1012526
Abstract
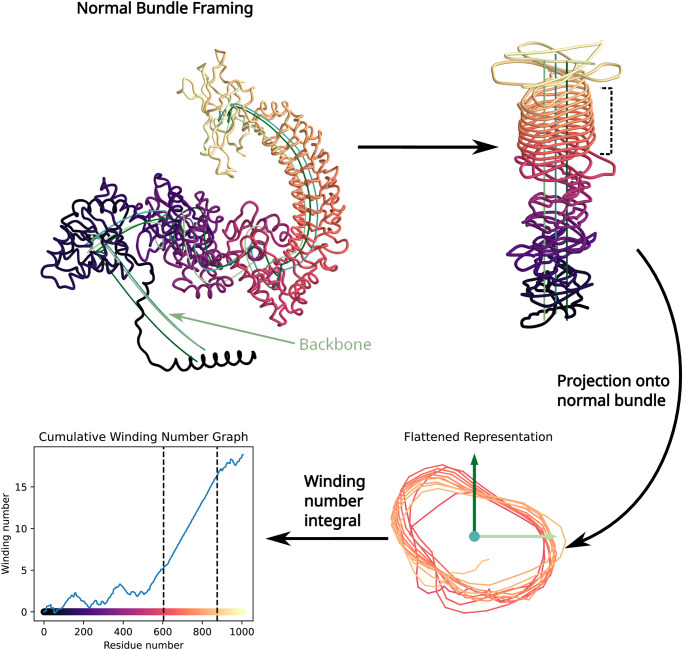
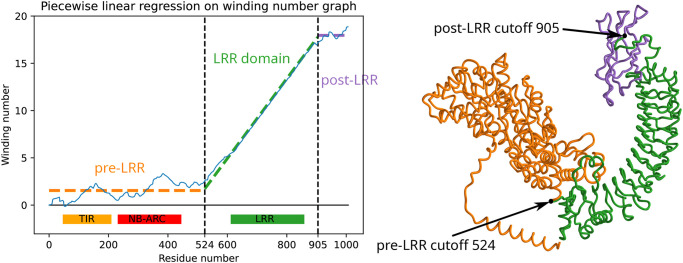
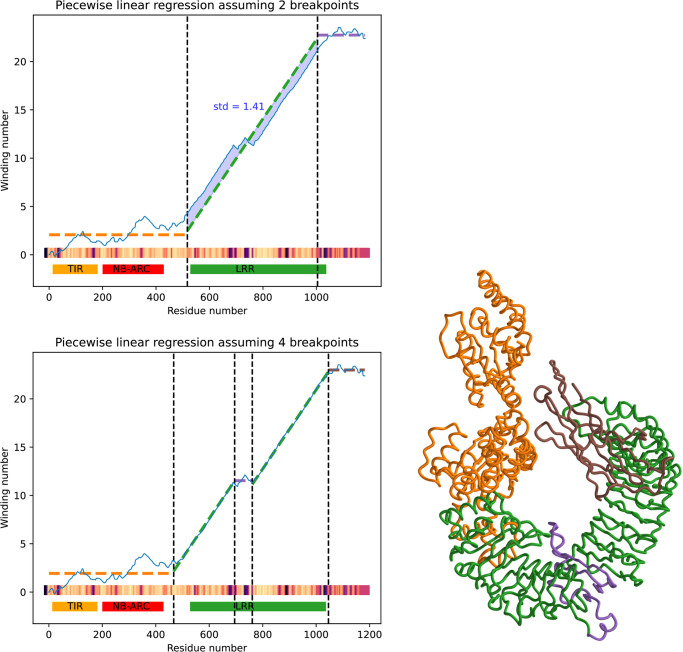
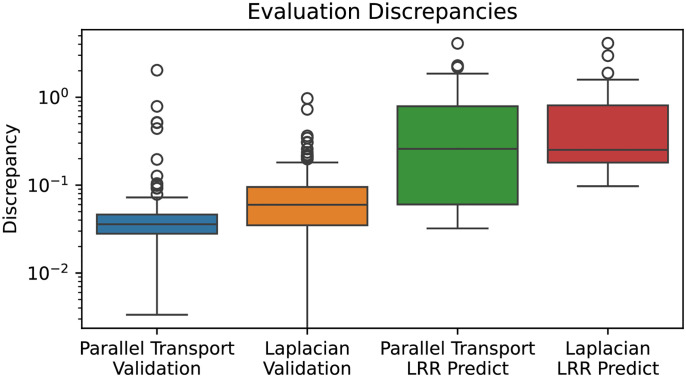
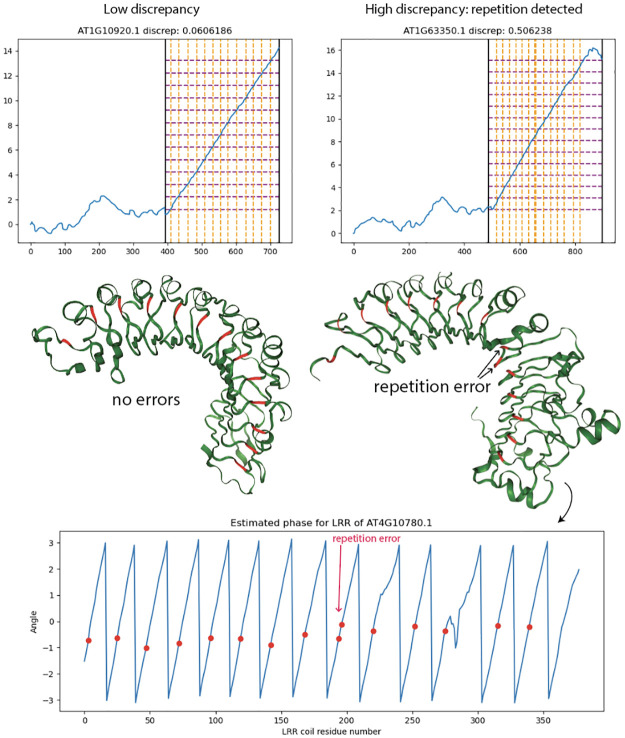
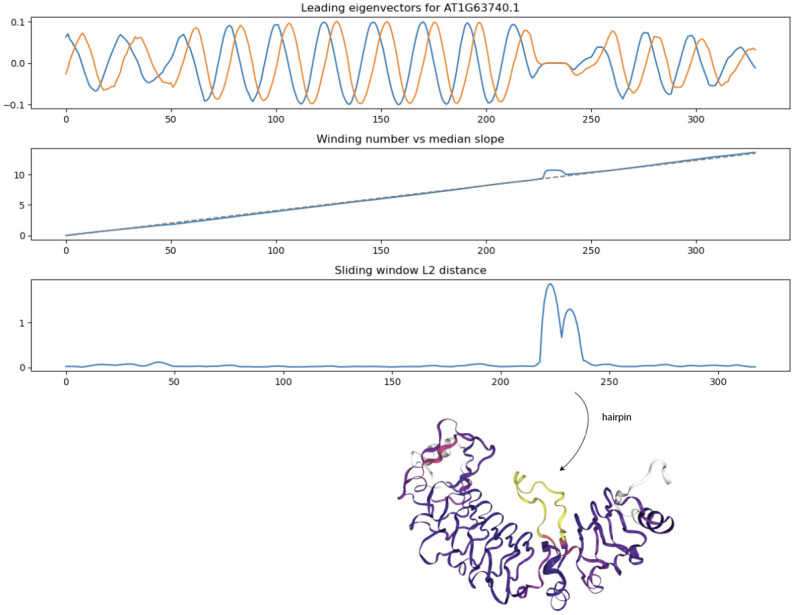
Protein domain annotation is typically done by predictive models such as HMMs trained on sequence motifs. However, sequence-based annotation methods are prone to error, particularly in calling domain boundaries and motifs within them. These methods are limited by a lack of structural information accessible to the model. With the advent of deep learning-based protein structure prediction, existing sequenced-based domain annotation methods can be improved by taking into account the geometry of protein structures. We develop dimensionality reduction methods to annotate repeat units of the Leucine Rich Repeat solenoid domain. The methods are able to correct mistakes made by existing machine learning-based annotation tools and enable the automated detection of hairpin loops and structural anomalies in the solenoid. The methods are applied to 127 predicted structures of LRR-containing intracellular innate immune proteins in the model plant Arabidopsis thaliana and validated against a benchmark dataset of 172 manually-annotated LRR domains. Author summary: In immune receptors across various organisms, repeating protein structures play a crucial role in recognizing and responding to pathogen threats. These structures resemble the coils of a slinky toy, allowing these receptors to adapt and change over time. One particularly vital but challenging structure to study is the Leucine Rich Repeat (LRR). Traditional methods that rely just on analyzing the sequence of these proteins can miss subtle changes due to rapid evolution. With the introduction of protein structure prediction tools like AlphaFold 2, annotation methods can study the coarser geometric properties of the structure. In this study, we visualize LRR proteins in three dimensions and use a mathematical approach to ‘flatten’ them into two dimensions, so that the coils form circles. We then used a mathematical concept called winding number to determine the number of repeats and where they are in a protein sequence. This process helps reveal their repeating patterns with enhanced clarity. When we applied this method to immune receptors from a model plant organism, we found that our approach could accurately identify coiling patterns. Furthermore, we detected errors made by previous methods and highlighted unique structural variations. Our research offers a fresh perspective on understanding immune receptors, potentially influencing studies on their evolution and function.
Overview
The claims and statistics of this paper haven’t been checked yet.
Run the check — free, no account needed. It reads the open-access text and checks the sources it cites.
Integrity signals
Registry
Cites
Statistics
Figures

Verification
Claims the paper makes
The claims and statistics of this paper haven’t been checked yet.
Run the check — free, no account needed. It reads the open-access text and checks the sources it cites.
Self-check
Percentages, sums and reported differences re-computed from the paper’s own numbers.
The self-check needs the paper’s full text.
Citations
Cites
Highly accurate protein structure prediction with AlphaFold
Jumper, J., Evans, R., Pritzel, A., Green, T., Figurnov, M., Ronneberger, O., Tunyasuvunakool, K., Bates, R., Žídek, A., Potapenko, A., et al. (2021) · Nature · doi:10.1038/s41586-021-03819-2 · Cited by 43,764
Research works printed but not linked: 20
- 2021, The leucine-rich repeat signaling scaffolds Shoc2 and Erbin: cellular mechanism and role in disease, The FEBS journal, 288, 721, 10.1111/febs.15450 · DOI
- 2015, Control of repeat-protein curvature by computational protein design, Nature structural & molecular biology, 22, 167, 10.1038/nsmb.2938 · DOI
- 10.1126/science.abe3069 · DOI
- 10.4161/auto.7.9.16464 · DOI
- 10.1126/science.aaf6395 · DOI
- 10.1146/annurev-arplant-081519-035901 · DOI
- 10.1111/j.1462-5822.2008.01260.x · DOI
- 10.1093/plcell/koab013 · DOI
- 10.1093/plcell/koaa002 · DOI
- 2021, Integrity of the post-LRR domain is required for TIR-NB-LRR function, Molecular Plant-Microbe Interactions, 34, 286, 10.1094/MPMI-06-20-0156-R · DOI
- 10.1093/nar/gkr367 · DOI · Paper page
- 10.1107/S1744309110001685 · DOI
- 2020, LRRpredictor—a new LRR motif detection method for irregular motifs of plant NLR proteins using an ensemble of classifiers, Genes, 11, 286, 10.3390/genes11030286 · DOI
- 10.1093/nar/28.1.235 · DOI · Paper page
- 1965, A least squares estimate of satellite attitude, SIAM review, 7, 409, 10.1137/1007077 · DOI
- 10.1107/S0567739476001873 · DOI
- 10.1002/dvg.22877 · DOI
- 10.1093/nar/gkaa977 · DOI · Paper page
- Tralie CJ , Berger M. Topological eulerian synthesis of slow motion periodic videos. In: 2018 25th IEEE international conference on image processing (ICIP).IEEE; 2018. p. 3573–7. · DOI
- 10.1104/pp.19.01273 · DOI
Metadata
- Authors
- Xu, B., Cerbu, A., Lim, D., Tralie, C. J., & Krasileva, K.
- Affiliations
- University of California, Berkeley (US)
- Ursinus College (US)
- Corresponding author
- Krasileva, Ksenia
- Venue
- PLoS Computational Biology
- Publisher
- openRxiv
- Published
- 2023-11-01
- Volume
- 20
- Issue
- 11
- Pages
- e1012526-e1012526
- ISSN
- 1553-734X (ISSN-L)
- PMC
- PMC11567593
- OpenAlex
- W4404056798
- Cited by
- 6
- References
- 1
- Citations by year
- 2026: 2 · 2025: 4
- FWCI
- 0.82
- Type
- journal article
- Language
- en
- Open access
- gold
- doi.org
- Licence
- cc-by
- Locations
- PLoS Computational Biology (publishedVersion, cc-by)
- bioRxiv (Cold Spring Harbor Laboratory) (acceptedVersion, cc-by)
- PubMed Central (publishedVersion, cc-by)
- PubMed (publishedVersion)
- eScholarship (California Digital Library) (submittedVersion, cc-by)
- PubMed Central (submittedVersion, cc-by)
- DOAJ (DOAJ: Directory of Open Access Journals) (submittedVersion, cc-by-sa)
- OSTI OAI (U.S. Department of Energy Office of Scientific and Technical Information) (submittedVersion)
- Funders
- Foundation for the National Institutes of Health (DP2AT011967)
- U.S. Department of Energy (DESC0020347)
- Gordon and Betty Moore Foundation
- Innovative Genomics Institute
- National Institutes of Health (4dp2at011967-02)
- National Center for Complementary and Integrative Health (DP2 AT011967)
- Krell Institute (DE-SC0020347)
- Topics
- Life Sciences › Biochemistry, Genetics and Molecular Biology › Molecular Biology › Protein Structure and Dynamics
- Life Sciences › Biochemistry, Genetics and Molecular Biology › Molecular Biology › Machine Learning in Bioinformatics
- Life Sciences › Biochemistry, Genetics and Molecular Biology › Structural Biology › Enzyme Structure and Function
- Keywords
- leucine-rich repeat domain, protein domain annotation, dimensionality reduction, structural anomalies, Arabidopsis thaliana, protein structure prediction
About these checks
Registry, retraction, Cites and statistics results are computed, not judged, with one exception: a printed reference that no index lists is read once by a model before it counts as a citation error. Claims are extracted by a model and kept only when their quote appears verbatim in the text; each cited source is then checked, with a model’s help, for whether it says what the claim relies on. Those verdicts can be wrong — read the claim’s quote and the cited source before relying on one.
Statistics and arithmetic are recomputed, not judged.
Confidence bands are shown only for fields calibrated on our annotated test set. None is calibrated yet, so no band is shown.
What counts as a claim ›How we measure confidence ›How we check this ›
Are you an author, or do you see a problem with this page? Request a review
