

The DOI matches its Crossref record.
Prediction of neural activity in connectome-constrained recurrent networks
Open accessPreprint — published as 10.1038/s41593-025-02080-4
Abstract
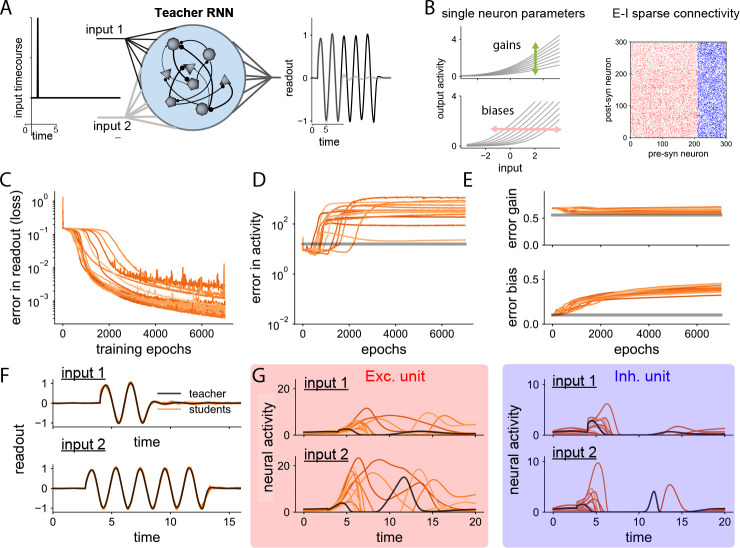
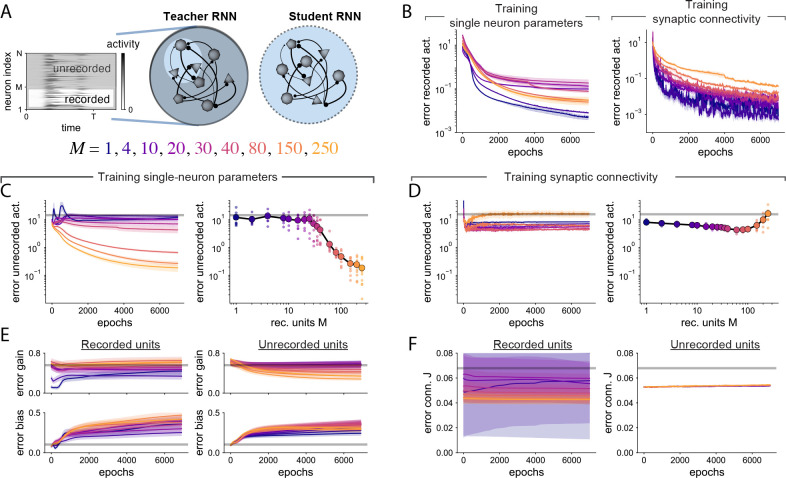
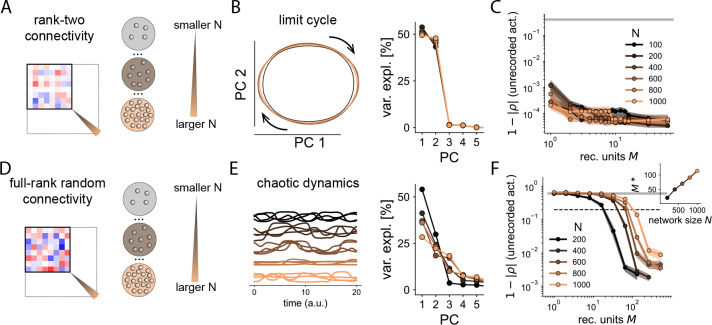
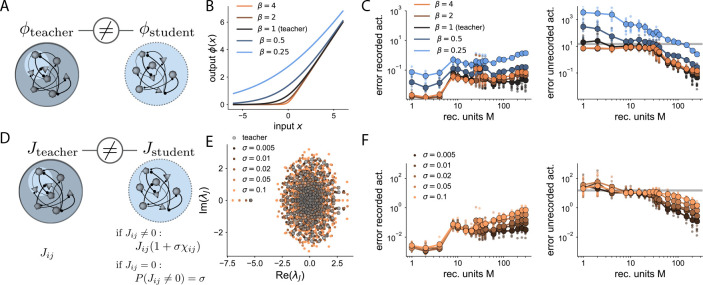
We develop a theory of connectome-constrained neural networks in which a student network is trained to reproduce the activity of a ground-truth teacher, representing a neural system for which a connectome is available. Unlike standard paradigms with unconstrained connectivity, here the two networks have the same connectivity but different biophysical parameters, reflecting uncertainty in neuronal and synaptic properties. We find that a connectome is often insufficient to constrain the dynamics of networks that perform a specific task, illustrating the difficulty of inferring function from connectivity alone. However, recordings from a small subset of neurons can remove this degeneracy, producing dynamics in the student that agree with the teacher. Our theory can also prioritize which neurons to record from to most efficiently predict unmeasured network activity. Our analysis shows that the solution spaces of connectome-constrained and unconstrained models are qualitatively different and provides a framework to determine when such models yield consistent dynamics.
Overview
The claims and statistics of this paper haven’t been checked yet.
Run the check — free, no account needed. It reads the open-access text and checks the sources it cites.
Integrity signals
Registry
Cites
Statistics
Figures
Verification
Claims the paper makes
The claims and statistics of this paper haven’t been checked yet.
Run the check — free, no account needed. It reads the open-access text and checks the sources it cites.
Claims other papers make about this one
Each is checked against this paper’s own text: does it say what the citing paper says it does?
The source backs part of the claim, not all of it — or backs it for a different population, condition or comparison.
In the citing paper
“By contrast, every neuron and synapse in our connectome-constrained model49–53 has a direct correspondence to neurons and synapses in the brain.”
From Connectome-constrained networks predict neural activity across the fly visual system (2024) · cites this paper as [53]
Experimental — accuracy not yet measured
Self-check
Percentages, sums and reported differences re-computed from the paper’s own numbers.
The self-check needs the paper’s full text.
Citations
Cites
No references could be resolved yet.
Research works printed but not linked: 51
- [1]Das A., Fiete I. R., Systematic errors in connectivity inferred from activity in strongly recurrent networks, Nature Neuroscience 2020 23:10 23 (10) (2020) 1286– 1296. 32895567
- [4]Liang T., Brinkman B. A. W., Statistically inferred neuronal connections in subsampled neural networks strongly correlate with spike train covariance, bioRxiv (2023) 2023.02.01.526673. 38755896
- [5]Dinc F., Shai A., Schnitzer M., Tanaka H., CORNN: Convex optimization of recurrent neural networks for rapid inference of neural dynamics (nov 2023). arXiv:2311.10200. · arXiv
- [6]White J. G., Southgate E., Thomson J. N., Brenner S., The Structure of the Nervous System of the Nematode Caenorhabditis elegans, Philosophical Transactions of the Royal Society of London. Series B, Biological Sciences 314 (1165) (1986) 1– 340. 22462104
- [7]Ohyama T., Schneider-Mizell C. M., Fetter R. D., Aleman J. V., Franconville R., Rivera-Alba M., Mensh B. D., Branson K. M., Simpson J. H., Truman J. W., Cardona A., Zlatic M., A multilevel multimodal circuit enhances action selection in Drosophila, Nature 520 (7549) (2015) 633– 639. 25896325
- [8]Zheng Z., Lauritzen J. S., Perlman E., Saalfeld S., Fetter R. D., Bock Correspondence D. D., A Complete Electron Microscopy Volume of the Brain of Adult Drosophila melanogaster, Cell 174 (2018) 730– 743.e22. 30033368 PMC6063995
- [9]Scheffer L. K., Xu C. S., Januszewski M., Lu Z., Takemura S. Y., Hayworth K. J., Huang G. B., Shinomiya K., Maitin-Shepard J., Berg S., Clements J., Hubbard P. M., Katz W. T., Umayam L., Zhao T., Ackerman D., Blakely T., Bogovic J., Dolafi T., Kainmueller D., Kawase T., Khairy K. A., Leavitt L., Li P. H., Lindsey L., Neubarth N., Olbris D. J., Otsuna H., Trautman E. T., Ito M., Bates A. S., Goldammer J., Wolff T., Svirskas R., Schlegel P., Neace E. R., Knecht C. J., Alvarado C. X., Bailey D. A., Ballinger S., Borycz J. A., Canino B. S., Cheatham N., Cook M., Dreher M., Duclos O., Eubanks B., Fairbanks K., Finley S., Forknall N., Francis A., Hopkins G. P., Joyce E. M., Kim S., Kirk N. A., Kovalyak J., Lauchie S. A., Lohff A., Maldonado C., Manley E. A., McLin S., Mooney C., Ndama M., Ogundeyi O., Okeoma N., Ordish C., Padilla N., Patrick C., Paterson T., Phillips E. E., Phillips E. M., Rampally N., Ribeiro C., Robertson M. K., Rymer J. T., Ryan S. M., Sammons M., Scott A. K., Scott A. L., Shinomiya A., Smith C., Smith K., Smith N. L., Sobeski M. A., Suleiman A., Swift J., Takemura S., Talebi I., Tarnogorska D., Tenshaw E., Tokhi T., Walsh J. J., Yang T., Horne J. A., Li F., Parekh R., Rivlin P. K., Jayaraman V., Costa M., Jefferis G. S., Ito K., Saalfeld S., George R., Meinertzhagen I. A., Rubin G. M., Hess H. F., Jain V., Plaza S. M., A connectome and analysis of the adult drosophila central brain, eLife 9 (2020) 1– 74. PMC7546738 32880371
- [10]Dorkenwald S., Matsliah A., Sterling A. R., Schlegel P., Yu S.-c., McKellar C. E., Lin A., Costa M., Eichler K., Yin Y., Silversmith W., Schneider-Mizell C., Jordan C. S., Brittain D., Halageri A., Kuehner K., Ogedengbe O., Morey R., Gager J., Kruk K., Perlman E., Yang R., Deutsch D., Bland D., Sorek M., Lu R., Macrina T., Lee K., Bae J. A., Mu S., Nehoran B., Mitchell E., Popovych S., Wu J., Jia Z., Castro M., Kemnitz N., Ih D., Bates A. S., Eckstein N., Funke J., Collman F., Bock D. D., Jefferis G. S., Seung H. S., Murthy M., Consortium F., Neuronal wiring diagram of an adult brain, bioRxiv (jul 2023). PMC11446842 39358518
- [11]Hildebrand D. G. C., Cicconet M., Torres R. M., Choi W., Quan T. M., Moon J., Wetzel A. W., Scott Champion A., Graham B. J., Randlett O., Plummer G. S., Portugues R., Bianco I. H., Saalfeld, Baden A. D., Lillaney K., Burns R., Vogelstein J. T., Schier A. F., Lee W. C. A., Jeong W. K., Lichtman J. W., Engert F., Whole-brain serial-section electron microscopy in larval zebrafish, Nature 545 (7654) (2017) 345– 349. 28489821 PMC5594570
- [12]Turner M. H., Mann K., Clandinin T. R., The connectome predicts resting-state functional connectivity across the Drosophila brain, Current biology 31 (11) (2021) 2386– 2394.e3. 33770490 PMC8519013
- [13]Randi F., Sharma A. K., Dvali S., Leifer A. M., Neural signal propagation atlas of Caenorhabditis elegans, Nature 2023 623:7986 623 (7986) (2023) 406– 414. PMC10632145 37914938
- [15]Pospisil D. A., Aragon M. J., Dorkenwald S., Matsliah A., Sterling A. R., Schlegel P., chieh Yu S., McKellar C. E., Costa M., Eichler K., Jefferis G. S., Murthy M., Pillow J. W., From connectome to effectome: learning the causal interaction map of the fly brain, bioRxiv (2024). arXiv: https://www.biorxiv.org/content/early/2024/02/09/2023.10.31.564922.full.pdf, doi: 10.1101/2023.10.31.564922. URL https://www.biorxiv.org/content/early/2024/02/09/2023.10.31.564922 PMC11446844 39358526 · DOI
- [16]Zarin A. A., Mark B., Cardona A., Litwin-Kumar A., Doe C. Q., A multilayer circuit architecture for the generation of distinct locomotor behaviors in Drosophila, eLife 8 (dec 2019). PMC6994239 31868582
- [17]Keller A. J., Dipoppa M., Roth M. M., Caudill M. S., Ingrosso A., Miller K. D., Scanziani M., A Disinhibitory Circuit for Contextual Modulation in Primary Visual Cortex, Neuron 108 (6) (2020) 1181– 1193.e8. 33301712 PMC7850578
- [18]Kohn J. R., Portes J. P., Christenson M. P., Abbott L. F., Behnia R., Flexible filtering by neural inputs supports motion computation across states and stimuli, Current biology 31 (23) (2021) 5249– 5260.e5. 34670114 PMC8725177
- [19]Lappalainen J. K., Tschopp F. D., Prakhya S., McGill M., Nern A., Shinomiya K., Takemura S.-y., Gruntman E., Macke J. H., Turaga S. C., Connectome-constrained deep mechanistic networks predict neural responses across the fly visual system at single-neuron resolution, bioRxiv (2023) 2023.03.11.532232.
- [20]Eckstein N., Bates A. S., Champion A., Du M., Yin Y., Schlegel P., Lu A. K.-Y., Rymer T., Finley-May S., Paterson T., Parekh R., Dorkenwald S., Matsliah A., Yu S.-C., McKellar C., Sterling A., Eichler K., Costa M., Seung S., Murthy M., Hartenstein V., Jefferis G. S., Funke J., Neurotransmitter Classification from Electron Microscopy Images at Synaptic Sites in Drosophila Melanogaster, bioRxiv (2023) 2020.06.12.148775. PMC11106717 38729112
- [21]Barnes C. L., Bonnéry D., Cardona A., Synaptic counts approximate synaptic contact area in Drosophila, PLOS ONE 17 (4) (2022) e0266064. 35377898 PMC8979427
- [22]Kasai H., Fukuda M., Watanabe S., Hayashi-Takagi A., Noguchi J., Structural dynamics of dendritic spines in memory and cognition, Trends in neurosciences 33 (3) (2010) 121– 129. 20138375
- [23]Bargmann C. I., Marder E., From the connectome to brain function, Nature methods 10 (6) (2013) 483– 490. 23866325
- [24]Marder E., Neuromodulation of neuronal circuits: back to the future, Neuron 76 (1) (2012) 1– 11. 23040802 PMC3482119
- [25]Gutierrez G. J., O’Leary T., Marder E., Multiple mechanisms switch an electrically coupled, synaptically inhibited neuron between competing rhythmic oscillators, Neuron 77 (5) (2013) 845– 858. 23473315 PMC3664401
- [26]Stroud J. P., Porter M. A., Hennequin G., Vogels T. P., Motor primitives in space and time via targeted gain modulation in cortical networks, Nature Neuroscience 2018 21:12 21 (12) (2018) 1774– 1783. PMC6276991 30482949
- [27]Ferguson K. A., Cardin J. A., Mechanisms underlying gain modulation in the cortex, Nature Reviews Neuroscience 2020 21:2 21 (2) (2020) 80– 92. PMC7408409 31911627
- [28]Connors B. W., Gutnick M. J., Intrinsic firing patterns of diverse neocortical neurons, Trends in neurosciences 13 (3) (1990) 99– 104. 1691879
- [29]Kubota Y., Hatada S., Kondo S., Karube F., Kawaguchi Y., Neocortical inhibitory terminals innervate dendritic spines targeted by thalamocortical afferents, The Journal of neuroscience: the official journal of the Society for Neuroscience 27 (5) (2007) 1139– 1150. 17267569 PMC6673192
- [30]Perich M. G., Arlt C., Soares S., Young M. E., Mosher C. P., Minxha J., Carter E., Rutishauser U., Rudebeck P. H., Harvey C. D., Rajan K., Inferring brain-wide interactions using data-constrained recurrent neural network models, bioRxiv (2021) 2020.12.18.423348.
- [31]Seung H. S., Sompolinsky H., Tishby N., Statistical mechanics of learning from examples, Physical Review A 45 (8) (1992) 6056. 9907706
- [32]Saad D., Solla S. A., Exact Solution for On-Line Learning in Multilayer Neural Networks, Physical Review Letters 74 (21) (1995) 4337. 10058475
- [33]Gao P., Trautmann E., Yu B., Santhanam G., Ryu S., Shenoy K., Ganguli S., A theory of multineuronal dimensionality, dynamics and measurement, bioRxiv (2017) 214262.
- [34]Kim C. M., Finkelstein A., Chow C. C., Svoboda K., Darshan R., Distributing task-related neural activity across a cortical network through task-independent connections, Nature Communications 2023 14:1 14 (1) (2023) 1– 21. PMC10195842 37202424
- [35]Russo A. A., Bittner S. R., Perkins S. M., Seely J. S., London B. M., Lara A. H., Miri A., Marshall N. J., Kohn A., Jessell T. M., Abbott L. F., Cunningham J. P., Churchland M. M., Motor cortex embeds muscle-like commands in an untangled population response, Neuron 97 (4) (2018) 953. 29398358 PMC5823788
- [36]Beiran M., Dubreuil A., Valente A., Mastrogiuseppe F., Ostojic S., Shaping Dynamics With Multiple Populations in Low-Rank Recurrent Networks, Neural Computation 33 (6) (2021) 1572– 1615. 34496384
- [37]Sompolinsky H., Crisanti A., Sommers H. J., Chaos in Random Neural Networks, Physical Review Letters 61 (3) (1988) 259. 10039285
- [38]Clark D. G., Abbott L. F., Litwin-Kumar A., Dimension of Activity in Random Neural Networks, Physical Review Letters 131 (11) (2023) 118401. 37774280
- [39]Hamood A. W., Marder E., Animal-to-Animal Variability in Neuromodulation and Circuit Function, Cold Spring Harbor symposia on quantitative biology 79 (2014) 21– 28. 25876630 PMC4610821
- [40]Prinz A. A., Bucher D., Marder E., Similar network activity from disparate circuit parameters, Nature Neuroscience 7 (12) (2004) 1345– 1352. 15558066
- [41]Mastrogiuseppe F., Ostojic S., Linking Connectivity, Dynamics, and Computations in Low-Rank Recurrent Neural Networks, Neuron 99 (3) (2018) 609– 623.e29. 30057201
- [42]Dubreuil A., Valente A., Beiran M., Mastrogiuseppe F., Ostojic S., The role of population structure in computations through neural dynamics, Nature neuroscience 25 (6) (2022) 783– 794. 35668174 PMC9284159
- [43]Synchronization of cortical activity and its putative role in information processing and learning, Annual review of physiology 55 (1) (1993) 349– 374. 8466179
- [44]Koch C., Segev I., The role of single neurons in information processing, Nature neuroscience 3 (11) (2000) 1171– 1177. 11127834
- [45]Goaillard J.-M., Marder E., Ion channel degeneracy, variability, and covariation in neuron and circuit resilience, Annual review of neuroscience 44 (2021) 335– 357. 33770451
- [46]Li H., Xu Z., Taylor G., Studer C., Goldstein T., Visualizing the Loss Landscape of Neural Nets, Advances in Neural Information Processing Systems 31 (2018).
- [47]Fort S., Jastrzebski S., Large Scale Structure of Neural Network Loss Landscapes, Advances in Neural Information Processing Systems 32 (2019).
- [49]Gutenkunst R. N., Waterfall J. J., Casey F. P., Brown K. S., Myers C. R., Sethna J. P., Universally Sloppy Parameter Sensitivities in Systems Biology Models, PLOS Computational Biology 3 (10) (2007) e189. 17922568 PMC2000971
- [50]Daniels B. C., Chen Y. J., Sethna J. P., Gutenkunst R. N., Myers C. R., Sloppiness, robustness, and evolvability in systems biology, Current opinion in biotechnology 19 (4) (2008) 389– 395. 18620054
- [51]Otopalik A. G., Goeritz M. L., Sutton A. C., Brookings T., Guerini C., Marder E., Sloppy morphological tuning in identified neurons of the crustacean stomatogastric ganglion, eLife 6 (feb 2017). PMC5323045 28177286
- [52]O’Leary T., Sutton A. C., Marder E., Computational models in the age of large datasets, Current opinion in neurobiology 32 (2015) 87– 94. 25637959 PMC4517826
- [53]Werbos P. J., Backpropagation Through Time: What It Does and How to Do It, Proceedings of the IEEE 78 (10) (1990) 1550– 1560.
- [54]Kingma D. P., Ba J. L., Adam: A method for stochastic optimization, in: 3rd International Conference on Learning Representations, ICLR 2015 - Conference Track Proceedings, International Conference on Learning Representations, ICLR, 2015. arXiv:1412.6980. · arXiv
- [55]Paszke A., Gross S., Chintala S., Chanan G., Yang E., Facebook Z. D., Research A. I., Lin Z., Desmaison A., Antiga L., Srl O., Lerer A., Automatic differentiation in PyTorch, in: Advances in Neural Information Processing Systems, 2017, pp. 8024– 8035.
Cited by
Sorted by citations
Connectome-constrained networks predict neural activity across the fly visual system
Lappalainen, J. K., Tschopp, F. D., Prakhya, S., McGill, M., Nern, A., Shinomiya, K., Takemura, S.-Y., Gruntman, E., Macke, J. H., & Turaga, S. C. (2024) · Nature · doi:10.1038/s41586-024-07939-3 · Cited by 128
Metadata
- Authors
- Beiran, M., & Litwin-Kumar, A.
- Affiliations
- Columbia University Irving Medical Center (US)
- Corresponding author
- Litwin-Kumar, Ashok
- Venue
- Nature Neuroscience
- Publisher
- openRxiv
- Published
- 2024-02-27
- Volume
- 28
- Issue
- 12
- Pages
- 2561-2574
- ISSN
- 1097-6256 (ISSN-L)
- PMC
- PMC11160579
- OpenAlex
- W4415648663
- Cited by
- 16
- References
- 0
- Citations by year
- 2026: 13 · 2025: 2 · 2024: 1
- FWCI
- 8.55
- Type
- journal article
- Language
- en
- Open access
- green
- doi.org
- Licence
- cc-by-nc-nd
- Locations
- Nature Neuroscience (publishedVersion)
- bioRxiv (Cold Spring Harbor Laboratory) (acceptedVersion, cc-by-nc-nd)
- PubMed (publishedVersion)
- HAL (submittedVersion, other-oa)
- PubMed Central (submittedVersion, cc-by-nc-nd)
- Funders
- U.S. Department of Health and Human Services (R01EB029858, RF1DA060772)
- Burroughs Wellcome Fund
- Kavli Foundation
- McKnight Foundation
- Gatsby Charitable Foundation (GAT3708)
- National Institutes of Health (1r01eb029858-01, 9rf1da060772-02)
- National Institute on Drug Abuse (RF1 DA060772)
- National Institute of Biomedical Imaging and Bioengineering (R01 EB029858)
- Topics
- Life Sciences › Neuroscience › Cognitive Neuroscience › Neural dynamics and brain function
- Physical Sciences › Computer Science › Artificial Intelligence › Neural Networks and Applications
- Life Sciences › Neuroscience › Cognitive Neuroscience › Functional Brain Connectivity Studies
- Keywords
- connectome, recurrent neural networks, neural dynamics, synaptic connectivity, teacher-student models, neural activity prediction
About these checks
Registry, retraction, Cites and statistics results are computed, not judged, with one exception: a printed reference that no index lists is read once by a model before it counts as a citation error. Claims are extracted by a model and kept only when their quote appears verbatim in the text; each cited source is then checked, with a model’s help, for whether it says what the claim relies on. Those verdicts can be wrong — read the claim’s quote and the cited source before relying on one.
Statistics and arithmetic are recomputed, not judged.
Confidence bands are shown only for fields calibrated on our annotated test set. None is calibrated yet, so no band is shown.
What counts as a claim ›How we measure confidence ›How we check this ›
Are you an author, or do you see a problem with this page? Request a review
