PreprintCited by 20Cellular transport and secretionNuclear Structure and FunctionMicrotubule and mitosis dynamics

The DOI matches its Crossref record; 1 of the 1 references it cites were found in a registry or an index.

A Hollow TFG Condensate Spatially Compartmentalizes the Early Secretory Pathway

Open access

Preprint — published as 10.1038/s41467-025-59118-1

Abstract

Summary: In the early secretory pathway, endoplasmic reticulum (ER) and Golgi membranes form a nearly spherical interface. In this ribosome-excluding zone, bidirectional transport of cargo coincides with a spatial segregation of anterograde and retrograde carriers by an unknown mechanism. We show that at physiological conditions, Trk-fused gene (TFG) self-organizes to form a hollow, anisotropic condensate that matches the dimensions of the ER-Golgi interface. Regularly spaced hydrophobic residues in TFG control the condensation mechanism and result in a porous condensate surface. We find that TFG condensates act as a molecular sieve, enabling molecules corresponding to the size of anterograde coats (COPII) to access the condensate interior while restricting retrograde coats (COPI). We propose that a hollow TFG condensate structures the ER-Golgi interface to create a diffusion-limited space for bidirectional transport. We further propose that TFG condensates optimize membrane flux by insulating secretory carriers in their lumen from retrograde carriers outside TFG cages.

Overview

The claims and statistics of this paper haven’t been checked yet.

Run the check — free, no account needed. It reads the open-access text and checks the sources it cites.

A few free checks a day · papers already verified open instantly · results are public

Integrity signals

Registry

Crossref · 10.1101/2024.03.26.586876

Cites

1 of 1 references verified0 citation errors · 0 not checkable

Statistics

Figures

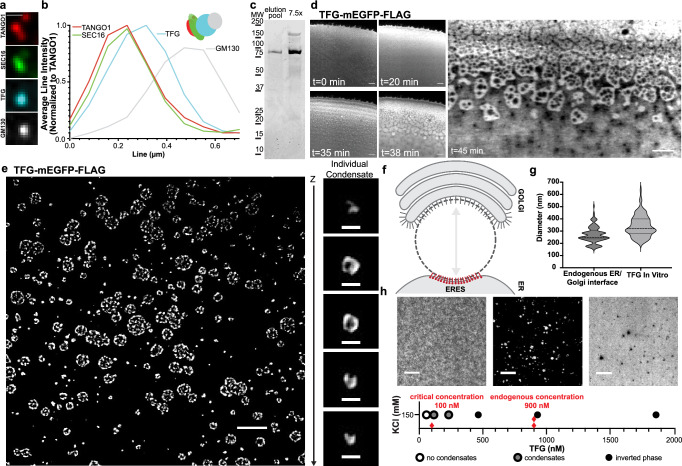
Fig. 1 Recombinant TFG assembles into anisotropic, hollow condensates in vitro. a Representative 4-color micrograph of an individual ERES/cis-Golgi unit. HeLa cells were transfected with mGFP-Sec16L (green), FLAG-TFG-SNAP (cyan) (labeled with SNAP-Cell 647-SiR), and immunostained for endogenous GM130 (gray) and TANGO1 (red). Scale bar 1 µm. b Fluorescence intensity line scan of 4-color ERES/cis-Golgi unit (averaged and normalized to TANGO1, n = 4). Schematic of localizations detected in the representative unit (a) is given. c Representative purity of peak TFG elutions from concentration/salt exchange (Coomassie staining). d Confocal time series of increasing concentration of TFG-mEGFP-FLAG at the edge of an evaporating 10 µL sessile droplet, 150 mM KCl. Scale bar 5 μm. Starting concentration ~100 nM. e TFG-mEGFP-FLAG at 430 nM spontaneously assembles into ‘sponge-like’, anisotropic condensates (HEPES/KOH pH 7.3; 150 mM KCl; 20% (v/v) PEG 8 kDa; confocal microscopy). Scale bar 5 µm. Individual TFG condensate, Z-step 125 nm. Scale bar 500 nm. f Schematic depicting the ER–Golgi interface (targets for immunolabeling at ERES: red; cis-Golgi: grey. g ERES to cis-Golgi distance measured between immunolabeled GM130 and TANGO1, mean = 269, n = 120, vs diameter of individual hollow TFG condensates in vitro, mean = 341, n = 175. h Determination of the saturation concentration required for the formation of hollow TFG condensates (in the absence of crowding agents). Representative micrographs depicting the distribution of TFG below and above the saturation concentration of 100 nM. Higher concentrations of TFG yield inverted phases (right micrograph). Dilute phase (left) shown at <5 nM, dense phase (middle) shown at 200 nM, inverted phase (right) shown at 6.4 µM. Red diamonds indicate saturation concentration and average cellular concentration of TFG. Scale bars 5 µm. Source data are provided as a Source Data file.
Fig. 1 Recombinant TFG assembles into anisotropic, hollow condensates in vitro. a Representative 4-color micrograph of an individual ERES/cis-Golgi unit. HeLa cells were transfected with mGFP-Sec16L (green), FLAG-TFG-SNAP (cyan) (labeled with SNAP-Cell 647-SiR), and immunostained for endogenous GM130 (gray) and TANGO1 (red). Scale bar 1 µm. b Fluorescence intensity line scan of 4-color ERES/cis-Golgi unit (averaged and normalized to TANGO1, n = 4). Schematic of localizations detected in the representative unit (a) is given. c Representative purity of peak TFG elutions from concentration/salt exchange (Coomassie staining). d Confocal time series of increasing concentration of TFG-mEGFP-FLAG at the edge of an evaporating 10 µL sessile droplet, 150 mM KCl. Scale bar 5 μm. Starting concentration ~100 nM. e TFG-mEGFP-FLAG at 430 nM spontaneously assembles into ‘sponge-like’, anisotropic condensates (HEPES/KOH pH 7.3; 150 mM KCl; 20% (v/v) PEG 8 kDa; confocal microscopy). Scale bar 5 µm. Individual TFG condensate, Z-step 125 nm. Scale bar 500 nm. f Schematic depicting the ER–Golgi interface (targets for immunolabeling at ERES: red; cis-Golgi: grey. g ERES to cis-Golgi distance measured between immunolabeled GM130 and TANGO1, mean = 269, n = 120, vs diameter of individual hollow TFG condensates in vitro, mean = 341, n = 175. h Determination of the saturation concentration required for the formation of hollow TFG condensates (in the absence of crowding agents). Representative micrographs depicting the distribution of TFG below and above the saturation concentration of 100 nM. Higher concentrations of TFG yield inverted phases (right micrograph). Dilute phase (left) shown at <5 nM, dense phase (middle) shown at 200 nM, inverted phase (right) shown at 6.4 µM. Red diamonds indicate saturation concentration and average cellular concentration of TFG. Scale bars 5 µm. Source data are provided as a Source Data file.CC BY · PubMed Central
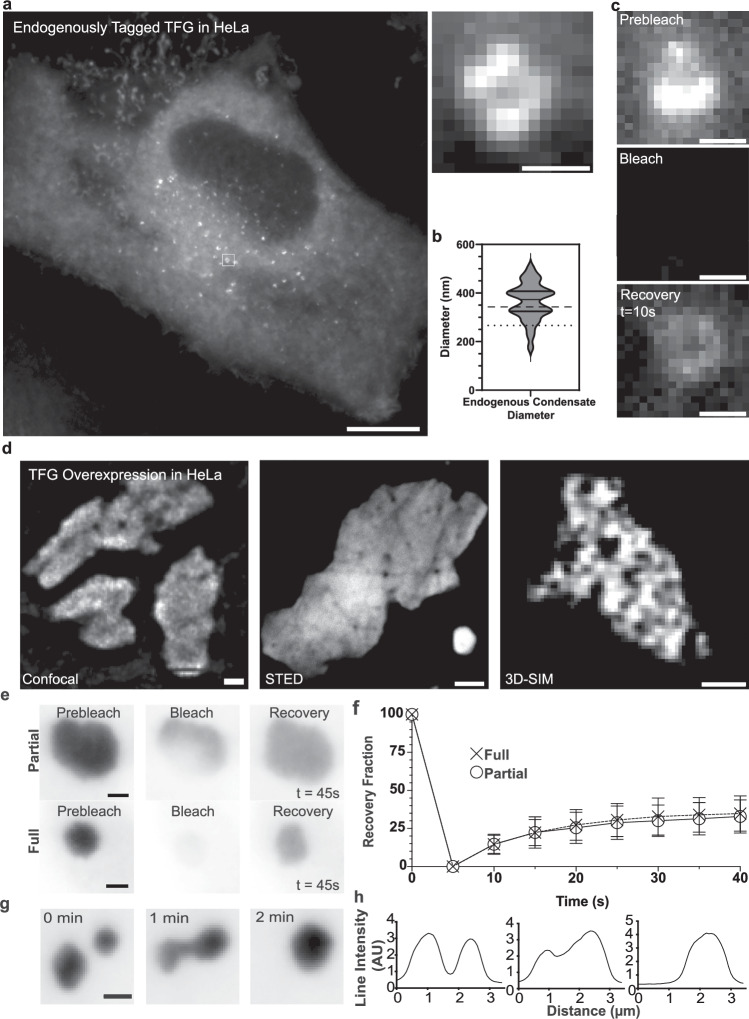
Fig. 2 Endogenous tagging and overexpression confirm assembly of TFG into anisotropic condensates that disassemble during mitosis. a Representative widefield micrograph of HeLa cells with homozygous endogenously tagged TFG::mClover-FLAG. Scale bar 10 μm. Magnified micrograph (dashed box in cell overview): individual TFG condensate. Scale bar 500 nm. b Quantification of the diameter of endogenous TFG condensates = 30. The dashed line represents the average of in vitro condensate diameter (341 nm ± 87) and the dotted line represents the average of endogenous ER/Golgi interface diameter (269 nm), for reference. c Qualitative fluorescence recovery after photobleaching (FRAP) of a TFG condensate. Scale bar 500 nm. d Left: live-cell confocal microscopy of large individual condensates within HeLa cells transfected with TFG-mEGFP-FLAG. Scale bar 5 μm. Middle: STED micrograph of large individual condensates within HeLa cells transfected with TFG-mEGFP-FLAG. Scale bar 2 μm. Right: 3D-structured illumination microscopy (3D-SIM) of large individual condensates within HeLa cells transfected with TFG-tGFP. Scale bar 500 nm. e Representative micrographs of partial and full FRAP experiments on overexpressed TFG condensates in HeLa cells. f Quantification of average condensate recovery rates for partial (n = 33) and full (n = 30) FRAP; normalized to pre-bleach (=100) and post-bleach intensity (=0). Error bars represent standard deviation. g Representative live-cell imaging of TFG condensate fusion dynamics. h Line scan of condensate depicted in (g). Source data are provided as a Source Data file.
Fig. 2 Endogenous tagging and overexpression confirm assembly of TFG into anisotropic condensates that disassemble during mitosis. a Representative widefield micrograph of HeLa cells with homozygous endogenously tagged TFG::mClover-FLAG. Scale bar 10 μm. Magnified micrograph (dashed box in cell overview): individual TFG condensate. Scale bar 500 nm. b Quantification of the diameter of endogenous TFG condensates = 30. The dashed line represents the average of in vitro condensate diameter (341 nm ± 87) and the dotted line represents the average of endogenous ER/Golgi interface diameter (269 nm), for reference. c Qualitative fluorescence recovery after photobleaching (FRAP) of a TFG condensate. Scale bar 500 nm. d Left: live-cell confocal microscopy of large individual condensates within HeLa cells transfected with TFG-mEGFP-FLAG. Scale bar 5 μm. Middle: STED micrograph of large individual condensates within HeLa cells transfected with TFG-mEGFP-FLAG. Scale bar 2 μm. Right: 3D-structured illumination microscopy (3D-SIM) of large individual condensates within HeLa cells transfected with TFG-tGFP. Scale bar 500 nm. e Representative micrographs of partial and full FRAP experiments on overexpressed TFG condensates in HeLa cells. f Quantification of average condensate recovery rates for partial (n = 33) and full (n = 30) FRAP; normalized to pre-bleach (=100) and post-bleach intensity (=0). Error bars represent standard deviation. g Representative live-cell imaging of TFG condensate fusion dynamics. h Line scan of condensate depicted in (g). Source data are provided as a Source Data file.CC BY · PubMed Central
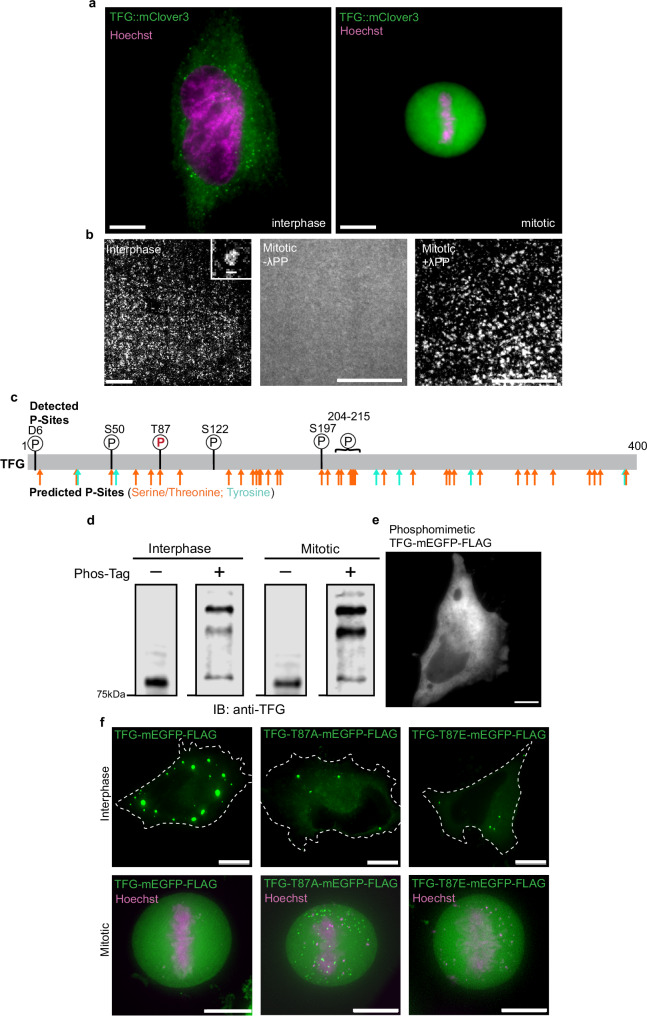
Fig. 3 TFG is regulated by phosphorylation across the cell cycle. a Representative micrograph of interphase (left) and mitotic (right) HeLa cells with endogenously tagged TFG. Cells were stained with Hoechst (magenta). Scale bar 10 μm. b Micrographs of recombinant TFG-162-240-mEGFP-FLAG purified from synchronized interphase or mitotic Expi293F cells. Mitosis-derived protein was treated with lambda protein phosphatase (λPP) where indicated. Scale bar 10 μm; inset 500 nm c Schematic depicting predicted phosphorylation sites within TFG (bottom): serine/threonine, orange; tyrosine, cyan, and depicting confidently identified phosphorylation sites found via mass spectrometry in TFG (top) with mitotic phosphorylation site depicted with red/bolded ‘P’. Putative phosphorylation sites were predicted by NetPhos-3.0. d Representative anti-TFG Western blot of PhosTag gel depicting purified recombinant TFG-mEGFP-FLAG derived from synchronized cells in interphase (I) or mitosis (M) as indicated. Arrows indicate species that are less abundant (lowest arrow) or more abundant (upper arrows). Blank lane between each condition was cropped. e Representative micrograph of phosphomimetic TFG-mEGFP-FLAG 24 h post-transfection in HeLa cells. Widefield microscopy, Z-slice, scale bar 10 µm. f Representative widefield deconvolution micrographs of interphase (upper) and mitotic (lower) HeLa cells overexpressing TFG-mEGFP-FLAG (left), TFG-T87A-mEGFP-FLAG (phosphor-dead) (middle), or TFG-T87E-mEGFP-FLAG (phosphomimetic) (right). Cells were stained with Hoechst (magenta). Scale bar 10 µm. 90% of mitotic cells expressing wild-type TFG (n = 24) or TFG-T87E (n = 10) were able to fully dissolve foci, in contrast to 65% in T87A-expressing cells (n = 26). At least three independent experiments were performed to obtain the replicates for each condition. Source data are provided as a Source Data file.
Fig. 3 TFG is regulated by phosphorylation across the cell cycle. a Representative micrograph of interphase (left) and mitotic (right) HeLa cells with endogenously tagged TFG. Cells were stained with Hoechst (magenta). Scale bar 10 μm. b Micrographs of recombinant TFG-162-240-mEGFP-FLAG purified from synchronized interphase or mitotic Expi293F cells. Mitosis-derived protein was treated with lambda protein phosphatase (λPP) where indicated. Scale bar 10 μm; inset 500 nm c Schematic depicting predicted phosphorylation sites within TFG (bottom): serine/threonine, orange; tyrosine, cyan, and depicting confidently identified phosphorylation sites found via mass spectrometry in TFG (top) with mitotic phosphorylation site depicted with red/bolded ‘P’. Putative phosphorylation sites were predicted by NetPhos-3.0. d Representative anti-TFG Western blot of PhosTag gel depicting purified recombinant TFG-mEGFP-FLAG derived from synchronized cells in interphase (I) or mitosis (M) as indicated. Arrows indicate species that are less abundant (lowest arrow) or more abundant (upper arrows). Blank lane between each condition was cropped. e Representative micrograph of phosphomimetic TFG-mEGFP-FLAG 24 h post-transfection in HeLa cells. Widefield microscopy, Z-slice, scale bar 10 µm. f Representative widefield deconvolution micrographs of interphase (upper) and mitotic (lower) HeLa cells overexpressing TFG-mEGFP-FLAG (left), TFG-T87A-mEGFP-FLAG (phosphor-dead) (middle), or TFG-T87E-mEGFP-FLAG (phosphomimetic) (right). Cells were stained with Hoechst (magenta). Scale bar 10 µm. 90% of mitotic cells expressing wild-type TFG (n = 24) or TFG-T87E (n = 10) were able to fully dissolve foci, in contrast to 65% in T87A-expressing cells (n = 26). At least three independent experiments were performed to obtain the replicates for each condition. Source data are provided as a Source Data file.CC BY · PubMed Central
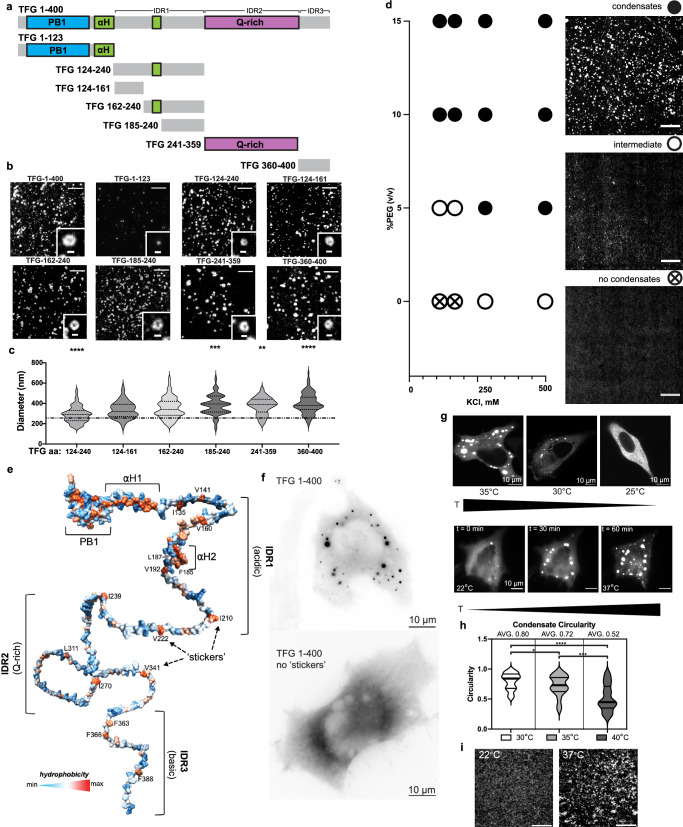
Fig. 4 Hydrophobic ‘sticker’ residues control the anisotropic condensation mechanism of TFG. a Schematic depicting domains present within TFG: PB1 domain, blue; alpha helices, green; Gln-rich region, purple; intrinsically disordered region (IDR), gray. Individual IDRs are defined as: IDR1 (net acidic), IDR2 (Gln-rich), IDR3 (net basic). Residues for truncated constructs are depicted to scale. b All truncated constructs except for residues 1-123 of TFG support the formation of lumen-containing (anisotropic) condensates. Representative micrographs are given. Overview scale bars 5 µm; insets 500 nm. c Quantification of the average peak-to-peak diameter of condensates formed by individual truncations of TFG. TFG; TFG 124–240: n = 124; TFG 124–161: n = 79; TFG 162–240: n = 176; TFG 241–359: n = 93; TFG 360–400: n = 107. The dashed line represents the average TFG 1–400 condensate diameter for reference. Two-tailed unpaired t-tests (TFG-124–240: p < 0.0001, TFG-185–240: p = 0.0006, TFG-241–359: p = 0.0011, TFG-360–400: p < 0.0001). d TFG phase diagram probing increasing concentrations of KCl vs PEG 8 kDa as a crowding agent. TFG-mEGFP-FLAG: 70 nM; HEPES/KOH pH 7.3; X mM KCl as indicated; X% (v/v) PEG 8 kDa as indicated. Scale bar 10 µm. e Schematic based on an AlphaFold prediction of TFG structure color-coded for hydrophobicity (red: max; blue: min). Domain annotations and the position of hydrophobic residues (‘stickers’) within IDRs are given. f Widefield deconvolution micrographs of HeLa cells transfected with TFG-mEGFP-FLAG and TFG-1–400-w/o ‘stickers’-mEGFP-FLAG, respectively. Scale bar 10 µm. g Representative micrographs of HeLa cells transfected with TFG-mEGFP-FLAG shifted to the indicated temperatures (top) and time-lapse of a single cell shifted through indicated temperatures (bottom). Scale bar 10 µm. h Quantification of condensate circularity at specific temperatures. Two-tailed unpaired t-tests (*p = 0.0378, ***p = 0.0003, ****p < 0.0001) i Micrographs of TFG-162-240-mEGFP-FLAG in vitro incubated at indicated temperatures. Representative of three experiments. Scale bar 5 µm. Source data are provided as a Source Data file.
Fig. 4 Hydrophobic ‘sticker’ residues control the anisotropic condensation mechanism of TFG. a Schematic depicting domains present within TFG: PB1 domain, blue; alpha helices, green; Gln-rich region, purple; intrinsically disordered region (IDR), gray. Individual IDRs are defined as: IDR1 (net acidic), IDR2 (Gln-rich), IDR3 (net basic). Residues for truncated constructs are depicted to scale. b All truncated constructs except for residues 1-123 of TFG support the formation of lumen-containing (anisotropic) condensates. Representative micrographs are given. Overview scale bars 5 µm; insets 500 nm. c Quantification of the average peak-to-peak diameter of condensates formed by individual truncations of TFG. TFG; TFG 124–240: n = 124; TFG 124–161: n = 79; TFG 162–240: n = 176; TFG 241–359: n = 93; TFG 360–400: n = 107. The dashed line represents the average TFG 1–400 condensate diameter for reference. Two-tailed unpaired t-tests (TFG-124–240: p < 0.0001, TFG-185–240: p = 0.0006, TFG-241–359: p = 0.0011, TFG-360–400: p < 0.0001). d TFG phase diagram probing increasing concentrations of KCl vs PEG 8 kDa as a crowding agent. TFG-mEGFP-FLAG: 70 nM; HEPES/KOH pH 7.3; X mM KCl as indicated; X% (v/v) PEG 8 kDa as indicated. Scale bar 10 µm. e Schematic based on an AlphaFold prediction of TFG structure color-coded for hydrophobicity (red: max; blue: min). Domain annotations and the position of hydrophobic residues (‘stickers’) within IDRs are given. f Widefield deconvolution micrographs of HeLa cells transfected with TFG-mEGFP-FLAG and TFG-1–400-w/o ‘stickers’-mEGFP-FLAG, respectively. Scale bar 10 µm. g Representative micrographs of HeLa cells transfected with TFG-mEGFP-FLAG shifted to the indicated temperatures (top) and time-lapse of a single cell shifted through indicated temperatures (bottom). Scale bar 10 µm. h Quantification of condensate circularity at specific temperatures. Two-tailed unpaired t-tests (*p = 0.0378, ***p = 0.0003, ****p < 0.0001) i Micrographs of TFG-162-240-mEGFP-FLAG in vitro incubated at indicated temperatures. Representative of three experiments. Scale bar 5 µm. Source data are provided as a Source Data file.CC BY · PubMed Central
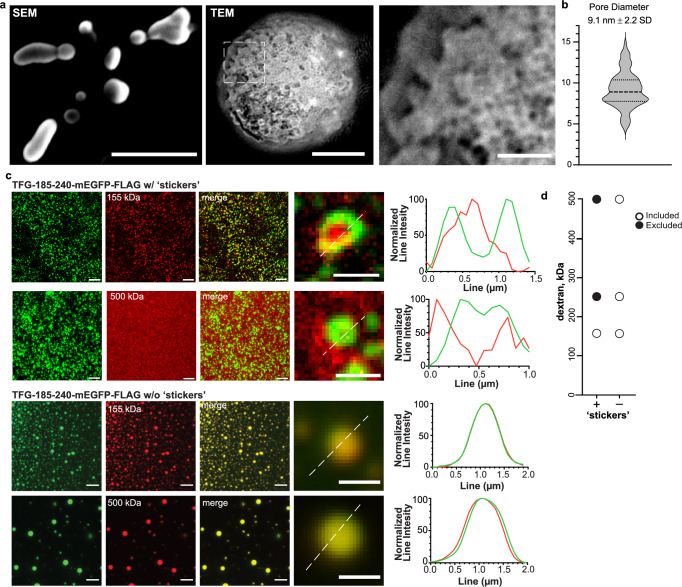
Fig. 5 Hollow TFG condensates are porous and select for macromolecules of defined sizes. a Left: SEM of TFG-162–240-mEGFP-FLAG condensates. Scale bar 500 nm. Middle: transmission electron micrograph (TEM) of a single TFG-162–240-mEGFP-FLAG condensate (no crowding agents or negative staining; LUT inverted). Scale bar 100 nm. Right: Magnification of the porous surface of TFG condensates (boxed area in middle panel, inverted LUT). Scale bar 25 nm. b Quantification of average pore size of TFG condensates micrograph (n = 79). c Permeability of TFG-185–240-mEGFP-FLAG and TFG-185–240-w/o ‘stickers’ -mEGFP-FLAG condensates (induced with 20 % (v/v) PEG 8 kDa) for fluorescent dextran-TMR species of various sizes. Representative confocal micrographs are given for 155 kDa and 500 kDa dextran. Normalized line intensities for representative merged images are given with TFG in green and dextran species in red. Scale bar 5 µm, zoom in 1 µm. Representative of at least three experiments. d Graph depicts the molecular weight range of dextrans that can access the lumen of TFG condensates (included: detected in the lumen of TFG condensates, white-filled circles; excluded: sequestered from TFG condensates, back circles). Source data are provided as a Source Data file.
Fig. 5 Hollow TFG condensates are porous and select for macromolecules of defined sizes. a Left: SEM of TFG-162–240-mEGFP-FLAG condensates. Scale bar 500 nm. Middle: transmission electron micrograph (TEM) of a single TFG-162–240-mEGFP-FLAG condensate (no crowding agents or negative staining; LUT inverted). Scale bar 100 nm. Right: Magnification of the porous surface of TFG condensates (boxed area in middle panel, inverted LUT). Scale bar 25 nm. b Quantification of average pore size of TFG condensates micrograph (n = 79). c Permeability of TFG-185–240-mEGFP-FLAG and TFG-185–240-w/o ‘stickers’ -mEGFP-FLAG condensates (induced with 20 % (v/v) PEG 8 kDa) for fluorescent dextran-TMR species of various sizes. Representative confocal micrographs are given for 155 kDa and 500 kDa dextran. Normalized line intensities for representative merged images are given with TFG in green and dextran species in red. Scale bar 5 µm, zoom in 1 µm. Representative of at least three experiments. d Graph depicts the molecular weight range of dextrans that can access the lumen of TFG condensates (included: detected in the lumen of TFG condensates, white-filled circles; excluded: sequestered from TFG condensates, back circles). Source data are provided as a Source Data file.CC BY · PubMed Central
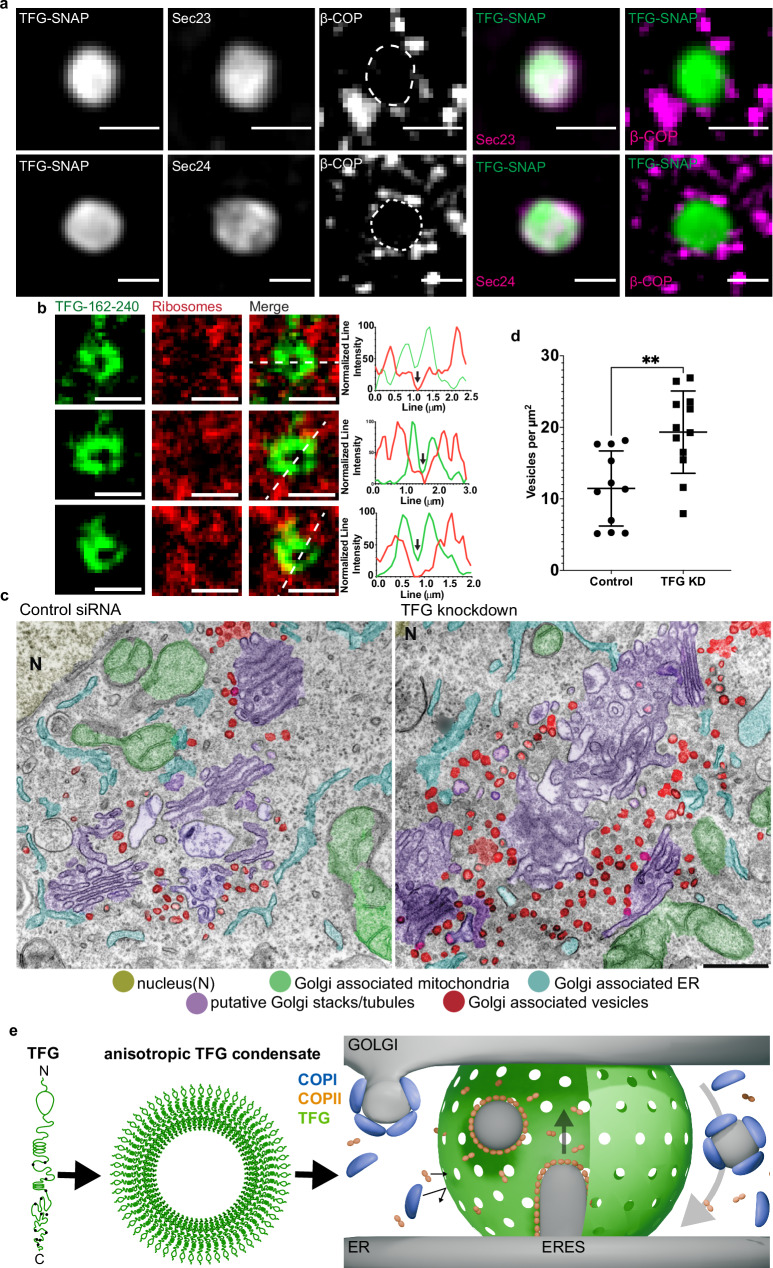
Fig. 6 TFG condensates insulate COPII from COPI coats. a Representative micrograph of HeLa cells transfected with FLAG-TFG-SNAP: Snap-Cell 647 SiR, mEmerald-Sec23A (top), EYFP-Sec24C (bottom), and immunostained for β-COP, a component of coatomer. Scale bar 1 µm. The experimental setup was reproduced seven times. b Permeability of TFG-162–240-mEGFP-FLAG condensates (induced with 10% (v/v) PEG 8 kDa) for E. coli ribosomes labeled with NHS-SiR. Line scans depict normalized line intensity with TFG in green and ribosomes in red. Scale bar 1 µm. Representative of at least three separate experiments. c Electron micrographs of (left) control siRNA and nocodazole and (middle/right) TFG knockdown and nocodazole. Nucleus (N), yellow; Golgi-associated mitochondria, green; Golgi-associated ER, cyan; putative Golgi stacks/tubules, purple; Golgi-associated vesicles, red. d Quantification of vesicles per µm2 of multiple selected Golgi stack areas from micrographs depicted in c. p = 0.0025. See “Methods”. e Model depicting the role of TFG at the ER–Golgi interface: TFG self-organizes into 300-nm condensates that are hollow. Their porous surface allows for COPII coat components (Sec23/24, Sec13/31, both complexes < 250 kDa) to access the lumen of TFG condensates, forming anterograde carriers. The retrograde carrier-forming COPI coat (550 kDa total) cannot access the lumen of TFG condensates. This may lead to a spatial segregation of anterograde from retrograde traffic, and the creation of a diffusion-limited space for bidirectional transport at the ER–Golgi interface. Source data are provided as a Source Data file.
Fig. 6 TFG condensates insulate COPII from COPI coats. a Representative micrograph of HeLa cells transfected with FLAG-TFG-SNAP: Snap-Cell 647 SiR, mEmerald-Sec23A (top), EYFP-Sec24C (bottom), and immunostained for β-COP, a component of coatomer. Scale bar 1 µm. The experimental setup was reproduced seven times. b Permeability of TFG-162–240-mEGFP-FLAG condensates (induced with 10% (v/v) PEG 8 kDa) for E. coli ribosomes labeled with NHS-SiR. Line scans depict normalized line intensity with TFG in green and ribosomes in red. Scale bar 1 µm. Representative of at least three separate experiments. c Electron micrographs of (left) control siRNA and nocodazole and (middle/right) TFG knockdown and nocodazole. Nucleus (N), yellow; Golgi-associated mitochondria, green; Golgi-associated ER, cyan; putative Golgi stacks/tubules, purple; Golgi-associated vesicles, red. d Quantification of vesicles per µm2 of multiple selected Golgi stack areas from micrographs depicted in c. p = 0.0025. See “Methods”. e Model depicting the role of TFG at the ER–Golgi interface: TFG self-organizes into 300-nm condensates that are hollow. Their porous surface allows for COPII coat components (Sec23/24, Sec13/31, both complexes < 250 kDa) to access the lumen of TFG condensates, forming anterograde carriers. The retrograde carrier-forming COPI coat (550 kDa total) cannot access the lumen of TFG condensates. This may lead to a spatial segregation of anterograde from retrograde traffic, and the creation of a diffusion-limited space for bidirectional transport at the ER–Golgi interface. Source data are provided as a Source Data file.CC BY · PubMed Central

Verification

Claims the paper makes

The claims and statistics of this paper haven’t been checked yet.

Run the check — free, no account needed. It reads the open-access text and checks the sources it cites.

A few free checks a day · papers already verified open instantly · results are public

Self-check

Percentages, sums and reported differences re-computed from the paper’s own numbers.

The self-check needs the paper’s full text.

Citations

Cites

Show all 1 references

Research works printed but not linked: 43

  1. 10.1146/annurev-cellbio-111315-125016 · DOI
  2. 10.1083/jcb.144.6.1135 · DOI
  3. 10.1104/pp.108.120618 · DOI
  4. 10.1091/mbc.E16-12-0863 · DOI
  5. 10.1146/annurev-biophys-070317-033259 · DOI
  6. 10.1016/0092-8674(91)90248-W · DOI
  7. 10.1083/jcb.121.1.49 · DOI
  8. Griffiths, G. , Pepperkok, R. , Locker, J. & Kreis, T. Immunocytochemical localization of β-COP to the ER-Golgi boundary and the TGN. (1995). · DOI
  9. 10.1016/S0092-8674(00)80341-4 · DOI
  10. 10.1038/ncb2225 · DOI
  11. 10.15252/embj.201489032 · DOI
  12. 10.1083/jcb.201608080 · DOI
  13. 10.1073/pnas.1709120114 · DOI
  14. 2019, COPII-mediated trafficking at the ER/ERGIC interface, Traffic, 20, 491, 10.1111/tra.12654 · DOI
  15. 10.1002/1873-3468.13715 · DOI
  16. 10.1002/1873-3468.13884 · DOI
  17. 10.1146/annurev-biochem-080120-022017 · DOI
  18. 2023, DYRK3 enables secretory trafficking by maintaining the liquid-like state of ER exit sites, Dev. Cell, 58, 1880, 10.1016/j.devcel.2023.08.005 · DOI
  19. 10.1016/j.celrep.2016.04.062 · DOI
  20. 10.1091/mbc.7.4.631 · DOI
  21. Wegmann, S. et al. Tau protein liquid-liquid phase separation can initiate tau aggregation. EMBO J. 37, (2018). · DOI · Paper page
  22. 2020, Liquid–Liquid Phase Separation in Crowded Environments, Int. J. Mol. Sci, 21, 5908, 10.3390/ijms21165908 · DOI
  23. 10.1016/j.molcel.2015.01.013 · DOI · Paper page
  24. 10.1073/pnas.1509317112 · DOI · Paper page
  25. 10.1016/j.cell.2016.11.054 · DOI
  26. 10.1126/science.aat5671 · DOI
  27. Itzhak, D. N. , Tyanova, S. , Cox, J. & Borner, G. H . Global, quantitative and dynamic mapping of protein subcellular localization. Elife 5, (2016). · DOI · Paper page
  28. 10.1038/nmeth.1928 · DOI
  29. 2017, Trk-fused gene (TFG) regulates pancreatic β cell mass and insulin secretory activity, Sci. Rep, 7, 13026, 10.1038/s41598-017-13432-x · DOI
  30. 10.1083/jcb.149.2.341 · DOI
  31. 10.1016/j.devcel.2020.07.017 · DOI
  32. 10.1016/j.ceb.2017.03.008 · DOI
  33. 10.1083/jcb.201703084 · DOI
  34. 10.1126/science.aaw8653 · DOI · Paper page
  35. 2018, Relationship of Sequence and Phase Separation in Protein Low-Complexity Regions, Biochemistry, 57, 2478, 10.1021/acs.biochem.8b00008 · DOI · Paper page
  36. 10.1007/s12575-009-9008-x · DOI · Paper page
  37. 2012, The ER/Golgi interface - is there anything in-between?, Front. Plant Sci, 3, 73
  38. 10.1016/j.cell.2007.05.036 · DOI
  39. 10.1126/science.aab1121 · DOI
  40. 10.1016/j.cell.2021.03.035 · DOI
  41. 10.1242/jcs.03019 · DOI
  42. 10.1016/j.bbamcr.2005.03.013 · DOI
  43. 10.1101/cshperspect.a005249 · DOI

Metadata

Authors
Wegeng, W. R., Bogus, S. M., Ruiz, M., Chavez, S. R., Noori, K. S. M., Niesman, I. R., & Ernst, A. M.
Affiliations
  • University of California San Diego (US)
  • San Diego State University (US)
Corresponding author
Ernst, Andreas M.
Venue
Nature Communications
Publisher
openRxiv
Published
2024-03-27
Volume
16
Issue
1
Pages
3715-3715
ISSN
2041-1723 (ISSN-L)
OpenAlex
W4409591571
Cited by
20
References
1
Citations by year
2026: 11 · 2025: 8 · 2024: 1
FWCI
9.44
Type
journal article
Language
en
Open access
Licence
cc-by
Locations
  • Nature Communications (publishedVersion, cc-by)
  • bioRxiv (Cold Spring Harbor Laboratory) (acceptedVersion, cc-by-nc)
  • PubMed Central (publishedVersion, cc-by)
  • PubMed (publishedVersion)
  • eScholarship (California Digital Library) (submittedVersion, cc-by)
  • PubMed Central (submittedVersion, cc-by-nc)
  • RePEc: Research Papers in Economics (submittedVersion)
  • DOAJ (DOAJ: Directory of Open Access Journals) (submittedVersion, cc-by-sa)
Funders
  • U.S. Department of Health and Human Services (R35GM142433)
  • National Institutes of Health (1s10od021724-01, 1s10od016234-01)
  • Directorate for Biological Sciences
  • University of California, San Diego (P30 NS047101)
  • National Institute of General Medical Sciences (GM133351, S10 OD016234, T32GM133351, R35GM142433)
  • National Institute of Neurological Disorders and Stroke (P30NS047101)
Topics
  • Life Sciences › Biochemistry, Genetics and Molecular Biology › Cell Biology › Cellular transport and secretion
  • Life Sciences › Biochemistry, Genetics and Molecular Biology › Molecular Biology › Nuclear Structure and Function
  • Life Sciences › Biochemistry, Genetics and Molecular Biology › Cell Biology › Microtubule and mitosis dynamics
Keywords
TFG, liquid-liquid phase separation, biomolecular condensates, ER-Golgi interface, early secretory pathway, retrograde transport, anterograde transport, molecular sieves, hydrophobic residues, cell cycle regulation, permeate flux

About these checks

Registry, retraction, Cites and statistics results are computed, not judged, with one exception: a printed reference that no index lists is read once by a model before it counts as a citation error. Claims are extracted by a model and kept only when their quote appears verbatim in the text; each cited source is then checked, with a model’s help, for whether it says what the claim relies on. Those verdicts can be wrong — read the claim’s quote and the cited source before relying on one.

Statistics and arithmetic are recomputed, not judged.

Confidence bands are shown only for fields calibrated on our annotated test set. None is calibrated yet, so no band is shown.

What counts as a claim ›How we measure confidence ›How we check this ›

Are you an author, or do you see a problem with this page? Request a review

How to cite

Cite CoChat for the checks on this page, and the paper for its own findings.

This page
CoChat. (2026). Citation check: A Hollow TFG Condensate Spatially Compartmentalizes the Early Secretory Pathway. https://app.cochat.ai/papers/10.1101/2024.03.26.586876
The paper
Wegeng, W. R., Bogus, S. M., Ruiz, M., Chavez, S. R., Noori, K. S. M., Niesman, I. R., & Ernst, A. M. (2024). A Hollow TFG Condensate Spatially Compartmentalizes the Early Secretory Pathway. Nature Communications. https://doi.org/10.1101/2024.03.26.586876