Student or educator? Sign up with your school email and get 6 months of Pro free.
PreprintCited by 4Cellular Mechanics and InteractionsMuscle Physiology and DisordersProtein Structure and Dynamics

The DOI matches its Crossref record; 1 of the 1 references it cites were found in a registry or an index.

Multiscale characterization of Caenorhabditis elegans mutants to probe functional mechanisms of human actin pathological variants

Open access

Preprint — published as 10.1016/j.isci.2025.113652 · Paper page

Abstract

SUMMARY: Actin plays a crucial role in diverse physiological processes by forming dynamic networks that determine cellular shape and mechanical properties. Non-Muscle Actinopathies (NMA) are rare diseases caused by de novo variants in human cytoskeletal β-actin ( ACTB ) and γ-actin ( ACTG1 ) genes, ranging from missense mutations to whole gene deletions. Currently, the high clinical variability and genotype-phenotype correlations in NMA remain largely unresolved. To address this concern, we inserted nine mutations identified in patients in the C. elegans cytoplasmic actin orthologue act-2 and performed a quantitative multiscale characterization of these animal models. We uncovered various perturbations including micro-scale actin network defects, cell-scale abnormalities, morphogenesis failure, and weaker behavioural phenotypes. Notably, the severity of the observed defects correlates with the severity of patients’ symptoms. Thus, we provide evidence that such C. elegans models are relevant to investigate the mechanisms underlying NMA physiopathology and could ultimately be used to screen for therapeutic strategies.

Overview

The claims and statistics of this paper haven’t been checked yet.

Run the check — free, no account needed. It reads the open-access text and checks the sources it cites.

A few free checks a day · papers already verified open instantly · results are public

Integrity signals

Registry

Crossref · 10.1101/2024.07.22.604239

Cites

1 of 1 references verified0 citation errors · 0 not checkable

Statistics

Figures

Graphical abstract
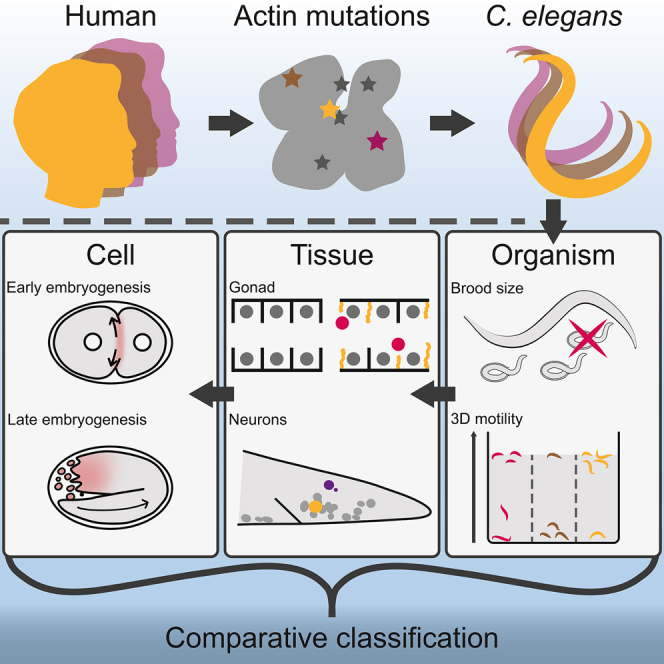
Graphical abstract CC BY-NC-ND · PubMed Central
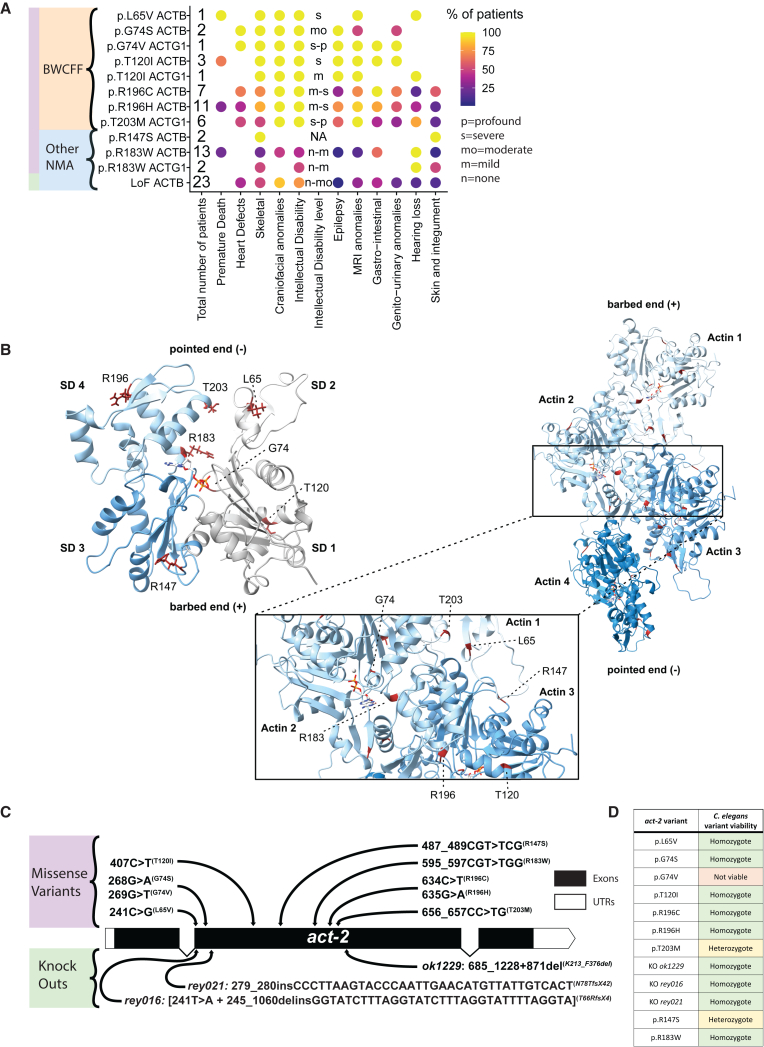
Figure 1 Insertion of non-muscle actinopathies variants in the C. elegans act-2 (A) Dot heatmap of patients’ symptoms. Intellectual disability (ID) level letter code: n = none, m = mild, mo = moderate, s = severe, p = profound. MRI = Magnetic Resonance Imaging. BWCFF = Baraitser-Winter Cerebro Fronto Facial syndrome. (B) Structural model of ACT-2 G-actin generated by Alphafold2. Subdomains of ACT-2 are colored in gray (SD1), light gray (SD2), blue (SD3) and light blue (SD4). (Right) Homology model of the ACT-2 filament (based on PDB-ID: 8DNH). ACT-2 protomers are colored in different shades of blue. The mutated residues investigated in this study are shown in red. The ATP bound to the individual protomers is shown as a stick-model. The zoom-in shows the location and structural environment of the individual mutated residues in more detail. (C) Schematic act-2 representation highlighting the location of single point variants obtained via CRISPR edition. Three act-2 gene knockout alleles are also depicted: rey016, rey021 and ok1229.29 Note that the amino acid numbering is here in frame with human ACTB/ACTG1, consider −1 AA in the frame of C. elegans due to an additional cysteine in second N-ter position, the base pair are however kept in the C. elegans act-2 frame. (D) Table summarizing the overall viability of C. elegans act-2 variants at 20°C.
Figure 1 Insertion of non-muscle actinopathies variants in the C. elegans act-2 (A) Dot heatmap of patients’ symptoms. Intellectual disability (ID) level letter code: n = none, m = mild, mo = moderate, s = severe, p = profound. MRI = Magnetic Resonance Imaging. BWCFF = Baraitser-Winter Cerebro Fronto Facial syndrome. (B) Structural model of ACT-2 G-actin generated by Alphafold2. Subdomains of ACT-2 are colored in gray (SD1), light gray (SD2), blue (SD3) and light blue (SD4). (Right) Homology model of the ACT-2 filament (based on PDB-ID: 8DNH). ACT-2 protomers are colored in different shades of blue. The mutated residues investigated in this study are shown in red. The ATP bound to the individual protomers is shown as a stick-model. The zoom-in shows the location and structural environment of the individual mutated residues in more detail. (C) Schematic act-2 representation highlighting the location of single point variants obtained via CRISPR edition. Three act-2 gene knockout alleles are also depicted: rey016, rey021 and ok1229.29 Note that the amino acid numbering is here in frame with human ACTB/ACTG1, consider −1 AA in the frame of C. elegans due to an additional cysteine in second N-ter position, the base pair are however kept in the C. elegans act-2 frame. (D) Table summarizing the overall viability of C. elegans act-2 variants at 20°C.CC BY-NC-ND · PubMed Central
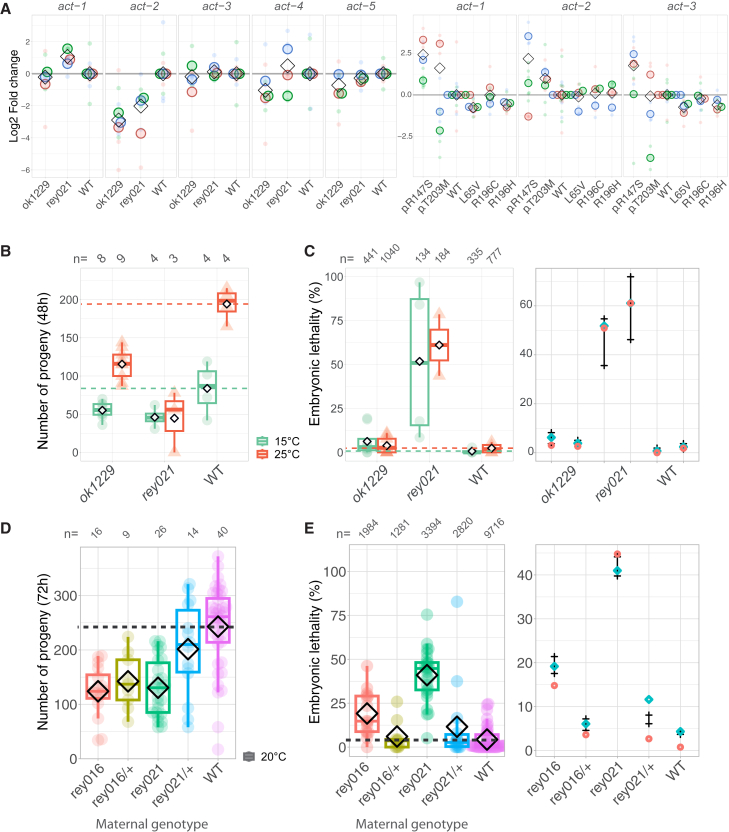
Figure 2 act-2 gene knock-outs affects fertility despite compensation mechanisms (A) Single animal RT-qPCR showing the normalized amount of mRNA for each C. elegans actin coding genes. Normalization was done using a housekeeping gene (iscu-1) and WT values. Different colors show different replicates. Small dot is the value for one animal while bigger dots correspond to the experiment’s mean. Diamonds show the mean of all replicates. (B) Progeny number per homozygous act-2 knockout (ok1229 and rey021) animal, at the mentioned temperatures, counted during 48h. Standardised boxplots and mean values (diamond) are shown. (C) Percentage of eggs that failed to hatch. The mean number of eggs that did not hatch for one animal is shown as a dot or a triangle, overlaid by standardised boxplots and mean values represented by a diamond. The rightmost plot presents the 95% credibility intervals of the posterior distributions of the embryonic lethality rates, considering low informative priors described in the STAR Methods section and our observed dataset. These are calculated with a Bayesian model based on Poisson laws with an offset to account for the progeny numbers. Experimental values are represented by red diamonds (mean) and cyan rhombus (median). (D) Progeny number at 20°C counted for 72h per homozygous or heterozygous act-2 KO animal. Standardised boxplots and mean values (diamond) are shown. (E) Percentage of eggs that failed to hatch. The mean number of eggs that did not hatch for one animal is shown as a dot, overlaid by standardised boxplots and mean values represented by a diamond. The rightmost plot presents the 95% credibility intervals of the posterior distributions of the embryonic lethality rates considering low informative priors described in the STAR Methods section and our observed dataset. These are calculated with a Bayesian model based on Poisson laws with an offset to account for the progeny numbers. Experimental values are represented by red diamonds (mean) and cyan rhombus (median). (B–E) Boxplots display the maximum and minimum values, the median as well as first and third quartiles.
Figure 2 act-2 gene knock-outs affects fertility despite compensation mechanisms (A) Single animal RT-qPCR showing the normalized amount of mRNA for each C. elegans actin coding genes. Normalization was done using a housekeeping gene (iscu-1) and WT values. Different colors show different replicates. Small dot is the value for one animal while bigger dots correspond to the experiment’s mean. Diamonds show the mean of all replicates. (B) Progeny number per homozygous act-2 knockout (ok1229 and rey021) animal, at the mentioned temperatures, counted during 48h. Standardised boxplots and mean values (diamond) are shown. (C) Percentage of eggs that failed to hatch. The mean number of eggs that did not hatch for one animal is shown as a dot or a triangle, overlaid by standardised boxplots and mean values represented by a diamond. The rightmost plot presents the 95% credibility intervals of the posterior distributions of the embryonic lethality rates, considering low informative priors described in the STAR Methods section and our observed dataset. These are calculated with a Bayesian model based on Poisson laws with an offset to account for the progeny numbers. Experimental values are represented by red diamonds (mean) and cyan rhombus (median). (D) Progeny number at 20°C counted for 72h per homozygous or heterozygous act-2 KO animal. Standardised boxplots and mean values (diamond) are shown. (E) Percentage of eggs that failed to hatch. The mean number of eggs that did not hatch for one animal is shown as a dot, overlaid by standardised boxplots and mean values represented by a diamond. The rightmost plot presents the 95% credibility intervals of the posterior distributions of the embryonic lethality rates considering low informative priors described in the STAR Methods section and our observed dataset. These are calculated with a Bayesian model based on Poisson laws with an offset to account for the progeny numbers. Experimental values are represented by red diamonds (mean) and cyan rhombus (median). (B–E) Boxplots display the maximum and minimum values, the median as well as first and third quartiles.CC BY-NC-ND · PubMed Central
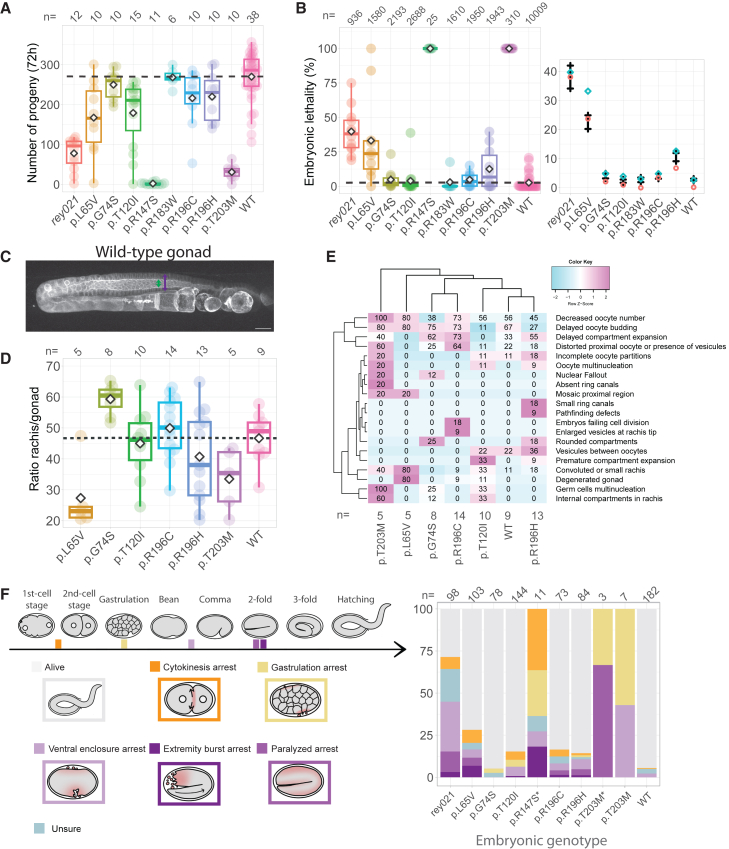
Figure 3 act-2 variants affect egg-laying capacities and embryogenesis success (A) Total progeny number at 20°C per homozygous act-2 variant. The sum of eggs laid for one animal is shown as a dot, overlaid by standardised boxplots and mean values represented by a diamond. (B) Percentage of eggs that failed to hatch. The percent of dead eggs for one animal is shown as a dot, overlaid by standardised boxplots and mean values represented by a diamond. Boxplots display the maximum and minimum values, the median as well as first and third quartiles. The rightmost plot presents the 95% credibility intervals of the posterior distributions of the embryonic lethality rates considering the priors described in the STAR Methods section and our observed dataset. These are calculated with a Bayesian model based on Poisson laws with an offset to account for the progeny numbers. Experimental values are represented by red diamonds (mean) and blue circles (median). (C) Actin organization in a WT gonad observed using an actin probe (Lifeact::mKate2), max projection of a z series of images. Green and purple arrows illustrate the space measured to calculate the rachis/gonad ratio measured in front of the −1 oocyte. Scale bar is 20μm. (D) Boxplot presenting the ratio between the rachis and the gonad width of homozygote animals. Mean is represented as a diamond. (E) Heatmap of observed phenotypes, in percent. (F) Stacked histogram of the end status of embryogenesis for different act-2 variants in percent. Schemes on the left represent the different defects observed. Also see Videos S1, S2, S3, S4 and S5.
Figure 3 act-2 variants affect egg-laying capacities and embryogenesis success (A) Total progeny number at 20°C per homozygous act-2 variant. The sum of eggs laid for one animal is shown as a dot, overlaid by standardised boxplots and mean values represented by a diamond. (B) Percentage of eggs that failed to hatch. The percent of dead eggs for one animal is shown as a dot, overlaid by standardised boxplots and mean values represented by a diamond. Boxplots display the maximum and minimum values, the median as well as first and third quartiles. The rightmost plot presents the 95% credibility intervals of the posterior distributions of the embryonic lethality rates considering the priors described in the STAR Methods section and our observed dataset. These are calculated with a Bayesian model based on Poisson laws with an offset to account for the progeny numbers. Experimental values are represented by red diamonds (mean) and blue circles (median). (C) Actin organization in a WT gonad observed using an actin probe (Lifeact::mKate2), max projection of a z series of images. Green and purple arrows illustrate the space measured to calculate the rachis/gonad ratio measured in front of the −1 oocyte. Scale bar is 20μm. (D) Boxplot presenting the ratio between the rachis and the gonad width of homozygote animals. Mean is represented as a diamond. (E) Heatmap of observed phenotypes, in percent. (F) Stacked histogram of the end status of embryogenesis for different act-2 variants in percent. Schemes on the left represent the different defects observed. Also see Videos S1, S2, S3, S4 and S5.CC BY-NC-ND · PubMed Central
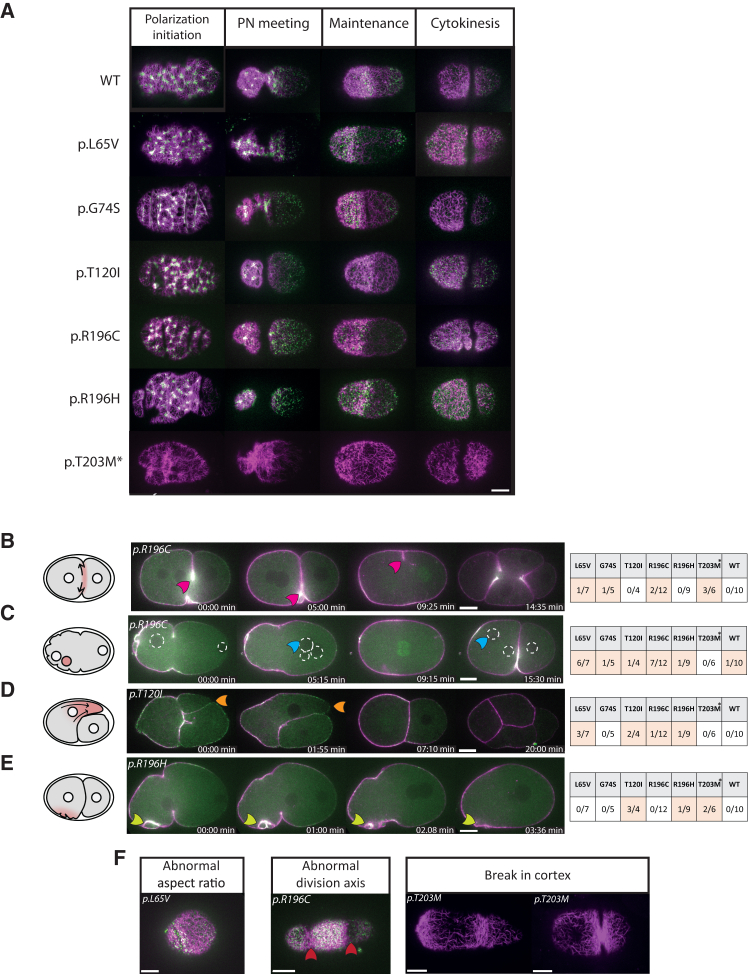
Figure 4 Actin mutation effects on cortical organization in early embryos (A) Cortical plane of embryos at different stages, Lifeact::mKate2 shown in magenta and NMY-2::GFP shown in green, to reveal actin filaments and myosin distribution. p.T203M animals only have Lifeact::mKate2. (PN = Pronuclei) Anterior is on the left. (B–E) Equatorial plane image of embryos expressing Lifeact::mKate2 (magenta) and NMY-2::GFP (green). (B) Cytokinesis defect observed. The cytokinesis ring relaxes after the completion of a first ingression (pink arrow), this is followed by multiple simultaneous ingressions as the cell proceeds to divide directly into four daughter cells. See Video S6. (C) An additional nucleus is visible (blue arrow). Nuclei are circled. See Video S7. (D) Blebbing. Large protrusion called bleb extruded from the anterior cell (orange arrow). After actin and myosin reassembly, the bleb retracted and division seemed to occur normally. See Video S8. (E) Abnormal membrane ruffling is observed in some embryos (white arrow). (F) Cortical plane of embryos presenting other phenotypes. Abnormal aspect ratio of the cortex implies a rounder embryo (see also Figure S4). Abnormal division axis (red arrows) leads to abnormal cell-cell contacts. Breaks in the cortex are highlighted by green arrows. (∗) Embryos from homozygote actin variants expressing Lifeact::mKate2 only. Scale bar is 10 μm.
Figure 4 Actin mutation effects on cortical organization in early embryos (A) Cortical plane of embryos at different stages, Lifeact::mKate2 shown in magenta and NMY-2::GFP shown in green, to reveal actin filaments and myosin distribution. p.T203M animals only have Lifeact::mKate2. (PN = Pronuclei) Anterior is on the left. (B–E) Equatorial plane image of embryos expressing Lifeact::mKate2 (magenta) and NMY-2::GFP (green). (B) Cytokinesis defect observed. The cytokinesis ring relaxes after the completion of a first ingression (pink arrow), this is followed by multiple simultaneous ingressions as the cell proceeds to divide directly into four daughter cells. See Video S6. (C) An additional nucleus is visible (blue arrow). Nuclei are circled. See Video S7. (D) Blebbing. Large protrusion called bleb extruded from the anterior cell (orange arrow). After actin and myosin reassembly, the bleb retracted and division seemed to occur normally. See Video S8. (E) Abnormal membrane ruffling is observed in some embryos (white arrow). (F) Cortical plane of embryos presenting other phenotypes. Abnormal aspect ratio of the cortex implies a rounder embryo (see also Figure S4). Abnormal division axis (red arrows) leads to abnormal cell-cell contacts. Breaks in the cortex are highlighted by green arrows. (∗) Embryos from homozygote actin variants expressing Lifeact::mKate2 only. Scale bar is 10 μm.CC BY-NC-ND · PubMed Central
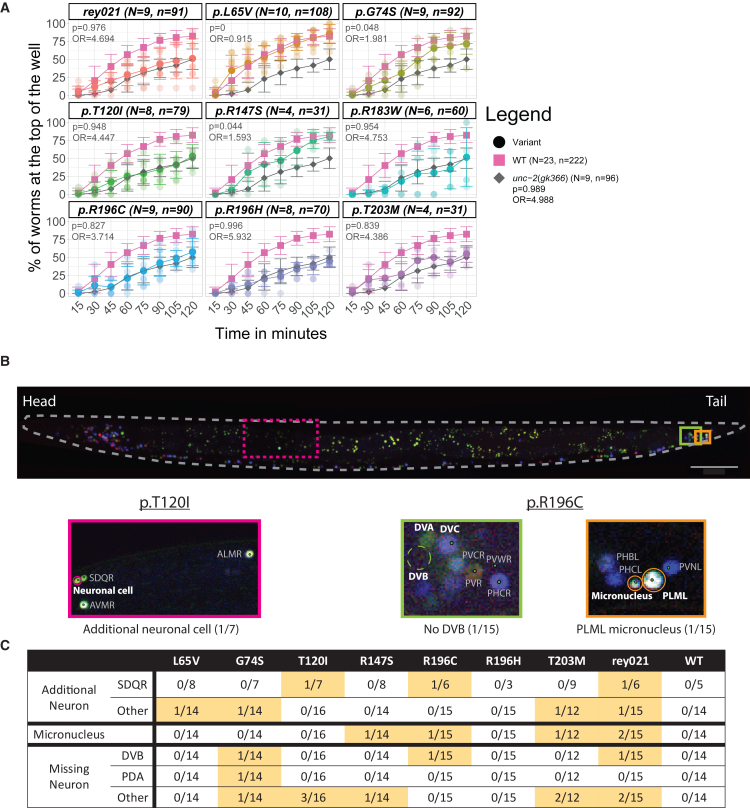
Figure 5 Actin mutations can affect motility and/or neuronal cell number (A) 3D animal migration assay. Percentage of animals reaching a chemoattractant after migration inside a pluronic gel, monitored every 15 min for 2 h. Results for individual wells (N) for each variant are visible as transparent dots, n is the total number of animals assessed and bars show the standard deviation. The final proportion for each variant was compared to that of WT in the frame of Bayesian statistics, using two binomial distributions. The odds ratio (OR) as well as the probability (p) that the difference is superior to 0.2 are indicated. (B) Variation of the neuronal cell number are observed in act-2 variant conditions. Reconstructed image of an animal expressing the NeuroPal transgene. Insets show representative images of identified defects compared to the WT act-2 reference: presence of a micronucleus (Orange), an extra (Magenta) or a missing cell (Green). Scale bar is 50 μm. (C) Summary of neuronal phenotypes observed in the actin variants.
Figure 5 Actin mutations can affect motility and/or neuronal cell number (A) 3D animal migration assay. Percentage of animals reaching a chemoattractant after migration inside a pluronic gel, monitored every 15 min for 2 h. Results for individual wells (N) for each variant are visible as transparent dots, n is the total number of animals assessed and bars show the standard deviation. The final proportion for each variant was compared to that of WT in the frame of Bayesian statistics, using two binomial distributions. The odds ratio (OR) as well as the probability (p) that the difference is superior to 0.2 are indicated. (B) Variation of the neuronal cell number are observed in act-2 variant conditions. Reconstructed image of an animal expressing the NeuroPal transgene. Insets show representative images of identified defects compared to the WT act-2 reference: presence of a micronucleus (Orange), an extra (Magenta) or a missing cell (Green). Scale bar is 50 μm. (C) Summary of neuronal phenotypes observed in the actin variants.CC BY-NC-ND · PubMed Central
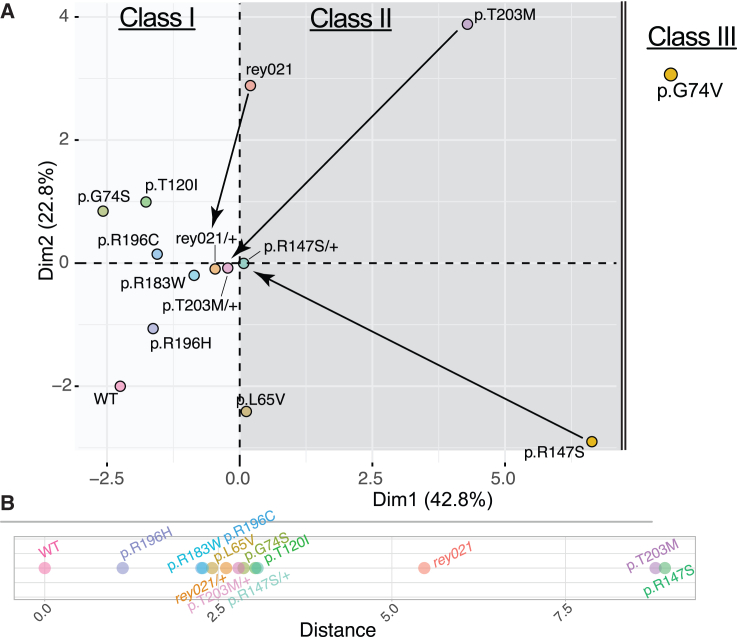
Figure 6 Data integration to build a comparative tool (A) Principal Component Analysis plot of analyzed actin variant animals reveal clusters which can be associated to classes of phenotypes. Variables factor map is available in Figure S6A. p.G74V was added manually as no data could be retrieved for this strain. Arrows link homozygotes to their respective heterozygotes. (B) Distances calculated between each actin variant and the WT reference in the two first dimensions.
Figure 6 Data integration to build a comparative tool (A) Principal Component Analysis plot of analyzed actin variant animals reveal clusters which can be associated to classes of phenotypes. Variables factor map is available in Figure S6A. p.G74V was added manually as no data could be retrieved for this strain. Arrows link homozygotes to their respective heterozygotes. (B) Distances calculated between each actin variant and the WT reference in the two first dimensions.CC BY-NC-ND · PubMed Central

Verification

Claims the paper makes

The claims and statistics of this paper haven’t been checked yet.

Run the check — free, no account needed. It reads the open-access text and checks the sources it cites.

A few free checks a day · papers already verified open instantly · results are public

Self-check

Percentages, sums and reported differences re-computed from the paper’s own numbers.

The self-check needs the paper’s full text.

Citations

Cites

Research works printed but not linked: 98

  1. 10.1152/physrev.00018.2013 · DOI · Paper page
  2. 2015, Forcing cells into shape: the mechanics of actomyosin contractility, Nat. Publ. Group, 16, 486
  3. 10.1016/j.cub.2024.08.043 · DOI
  4. 10.1038/s41580-022-00508-4 · DOI
  5. 10.3390/ijms21093371 · DOI
  6. 10.1016/j.arr.2020.101021 · DOI
  7. 10.1016/j.ajhg.2017.11.006 · DOI
  8. 10.1038/s41467-018-06713-0 · DOI
  9. 10.1111/bjd.19339 · DOI
  10. 10.1038/ng.1091 · DOI
  11. 10.1038/ejhg.2014.95 · DOI
  12. 10.1101/2024.08.21.24310320 · DOI
  13. 10.1242/jcs.041970 · DOI
  14. 10.7554/eLife.31661 · DOI
  15. 10.15252/embj.2021107982 · DOI
  16. 10.1016/j.cub.2011.06.019 · DOI
  17. 10.7554/eLife.50014 · DOI
  18. 10.1371/journal.pgen.1010806 · DOI
  19. 10.7554/eLife.93013 · DOI
  20. 10.1016/j.ejcb.2022.151216 · DOI
  21. 10.1111/febs.70018 · DOI
  22. 10.1073/pnas.1807895115 · DOI
  23. 10.1002/cm.20467 · DOI
  24. 10.1091/mbc.E11-06-0582 · DOI · Paper page
  25. 10.1002/cm.21647 · DOI
  26. 10.1073/pnas.2308255121 · DOI
  27. 10.12688/f1000research.18476.1 · DOI
  28. 10.1091/mbc.E05-09-0886 · DOI
  29. 10.1016/j.ymeth.2011.09.008 · DOI
  30. 10.1002/ar.22965 · DOI
  31. 10.1016/0022-2836(89)90503-2 · DOI
  32. 10.1016/0022-2836(84)90024-X · DOI
  33. 10.1093/genetics/133.4.897 · DOI
  34. 10.1091/mbc.E04-12-1061 · DOI
  35. 10.1534/genetics.115.179382 · DOI · Paper page
  36. 10.1016/j.ejmg.2020.103877 · DOI
  37. Vontell, R. , Supramaniam, V.G. , Davidson, A. , Thornton, C. , Marnerides, A. , Holder-Espinasse, M. , Lillis, S. , Yau, S. , Jansson, M. , Hagberg, H.E. , et al. (2019). Post-mortem Characterisation of a Case With an ACTG1 Variant, Agenesis of the Corpus Callosum and Neuronal Heterotopia. Front. Physiol. 10. · DOI
  38. 10.1002/ajmg.a.38057 · DOI
  39. 10.1016/j.jid.2017.03.017 · DOI
  40. 10.1016/j.jid.2017.04.003 · DOI
  41. 10.1002/mds.26842 · DOI
  42. 10.1155/2017/9184265 · DOI
  43. 10.1002/ana.10319 · DOI
  44. 10.1086/504271 · DOI
  45. 10.1007/s10048-017-0521-9 · DOI
  46. 10.1186/s11689-018-9235-z · DOI
  47. 10.1002/mdc3.12854 · DOI
  48. 10.1038/s41594-023-01101-9 · DOI
  49. 10.1002/1873-3468.70088 · DOI
  50. 10.1146/annurev-biophys-042910-155359 · DOI · Paper page
  51. 10.1002/cm.21169 · DOI
  52. 10.1038/s41586-022-05366-w · DOI
  53. 10.1093/genetics/110.1.17 · DOI
  54. 10.1016/j.mex.2015.02.002 · DOI
  55. Schafer, W . (2005). Egg-laying. WormBook. · DOI
  56. 10.1242/dev.199633 · DOI
  57. 10.1016/j.cell.2011.03.037 · DOI
  58. 10.1016/j.gde.2006.06.002 · DOI
  59. 10.1016/bs.ctdb.2015.11.012 · DOI
  60. Nance, J . (2005). Gastrulation in C. elegans. WormBook. · DOI
  61. 10.1083/jcb.202302102 · DOI
  62. 10.1371/journal.pgen.1002863 · DOI
  63. 10.7554/eLife.23866 · DOI
  64. Ennomani, H. , Letort, G. , Guérin, C. , Martiel, J.-L. , Cao, W. , Nédélec, F. , De La Cruz, E.M. , Théry, M. , and Blanchoin, L. (2016). Architecture and Connectivity Govern Actin Network Contractility. Curr. Biol., 1–12. · DOI
  65. 10.7554/eLife.17807 · DOI
  66. Rose, L. , and Gönczy, P . (2014). Polarity establishment, asymmetric division and segregation of fate determinants in early C. elegans embryos. WormBook, 1–43. · DOI
  67. 10.1016/bs.ctdb.2020.12.006 · DOI
  68. 10.1016/j.cub.2010.10.030 · DOI
  69. 10.1091/mbc.E17-01-0056 · DOI
  70. 10.1038/nrm2453 · DOI · Paper page
  71. 10.1016/j.cub.2019.09.013 · DOI
  72. 10.1038/s41598-019-51608-9 · DOI
  73. 10.1016/j.cell.2020.12.012 · DOI
  74. 10.1074/mcp.M111.015099 · DOI
  75. 10.1242/jcs.203760 · DOI
  76. 10.1002/ar.23958 · DOI
  77. 10.1038/s41586-018-0821-8 · DOI
  78. 10.1242/jcs.00421 · DOI
  79. 10.3908/wormatlas.4.1 · DOI
  80. 10.1016/j.cels.2022.07.001 · DOI
  81. 10.1242/dev.174029 · DOI
  82. 10.1016/j.cell.2024.04.012 · DOI
  83. 10.1093/genetics/iyae135 · DOI
  84. 10.7554/eLife.37677 · DOI
  85. 10.1016/0012-1606(86)90358-1 · DOI · Paper page
  86. 10.1242/dev.167262 · DOI
  87. 10.1016/j.celrep.2022.111365 · DOI
  88. 10.1038/s41421-022-00376-4 · DOI
  89. 10.1242/dev.019075 · DOI
  90. 10.1534/g3.112.003830 · DOI · Paper page
  91. 10.1051/medsci/20031967725 · DOI · Paper page
  92. 10.1002/adhm.202000519 · DOI
  93. 10.1038/nmeth.2560 · DOI · Paper page
  94. 10.1186/1471-2199-9-9 · DOI
  95. 10.1038/365810a0 · DOI · Paper page
  96. 10.1093/nar/gky427 · DOI · Paper page
  97. 10.7554/eLife.82015 · DOI
  98. 10.1002/pro.3943 · DOI · Paper page

Metadata

Authors
Hecquet, T., Arbogast, N., Suhner, D., Goetz, A., Amann, G., Yürekli, S., Marangoni, F., Quintin, S., Greve, J. N., Di Donato, N., & Reymann, A.-C.
Affiliations
  • Centre National de la Recherche Scientifique (FR)
  • Medizinische Hochschule Hannover (DE)
Corresponding author
Reymann, Anne-Cécile
Venue
iScience
Publisher
openRxiv
Published
2024-07-22
Volume
28
Issue
11
Pages
113652-113652
ISSN
2589-0042 (ISSN-L)
OpenAlex
W4415648457
Cited by
4
References
1
Citations by year
2026: 3 · 2025: 1
FWCI
1.97
Type
journal article
Language
en
Open access
Locations
  • iScience (publishedVersion, cc-by-nc-nd)
  • bioRxiv (Cold Spring Harbor Laboratory) (acceptedVersion, cc-by-nc-nd)
  • Europe PMC (PubMed Central) (publishedVersion, cc-by-nc-nd)
  • PubMed (publishedVersion)
  • HAL (submittedVersion, other-oa)
  • HAL (submittedVersion, cc-by-nc-nd)
Funders
  • Fondation Maladies Rares (SAM-2022-121409)
  • E-Rare
  • Deutsche Forschungsgemeinschaft (DI 2170/3‐1, DI 2170/5-1)
  • Agence Nationale de la Recherche (ANR-10-IDEX-0002, ANR-19-RAR4-0001, ANR-20-SFRI-0012, ANR‐10_INBS‐04, ANR-17-EURE-0023, ANR-10-INBS-0004)
  • Institut National de la Santé et de la Recherche Médicale
  • Bundesministerium für Bildung und Forschung (ANR-19-RAR4-0001-03, 01GM1922A, 01GM1922B)
  • Else Kröner-Fresenius-Stiftung (2020_EKES.04)
  • Université de Strasbourg (ANR 20-SFRI-0012, ANR-10-IDEX- 0002, ANR-17-EURE-0023)
  • Centre National de la Recherche Scientifique
  • Medizinischen Hochschule Hannover
  • National Institutes of Health (P40OD010440)
  • Horizon 2020 Framework Programme (825575)
Topics
  • Life Sciences › Biochemistry, Genetics and Molecular Biology › Cell Biology › Cellular Mechanics and Interactions
  • Life Sciences › Biochemistry, Genetics and Molecular Biology › Molecular Biology › Muscle Physiology and Disorders
  • Life Sciences › Biochemistry, Genetics and Molecular Biology › Molecular Biology › Protein Structure and Dynamics
Keywords
non-muscle actin, actinopathy, multiscale characterization, therapeutic screening

About these checks

Registry, retraction, Cites and statistics results are computed, not judged, with one exception: a printed reference that no index lists is read once by a model before it counts as a citation error. Claims are extracted by a model and kept only when their quote appears verbatim in the text; each cited source is then checked, with a model’s help, for whether it says what the claim relies on. Those verdicts can be wrong — read the claim’s quote and the cited source before relying on one.

Statistics and arithmetic are recomputed, not judged.

Confidence bands are shown only for fields calibrated on our annotated test set. None is calibrated yet, so no band is shown.

What counts as a claim ›How we measure confidence ›How we check this ›

Are you an author, or do you see a problem with this page? Request a review

Data sources

Bibliographic data: Semantic Scholar, OpenAlex, Crossref.

Contains information from the Semantic Scholar Academic Graph Datasets, made available under the ODC Attribution License (ODC-BY 1.0).

Semantic Scholar’s data is described in: Kinney, R., et al. (2023). The Semantic Scholar Open Data Platform. arXiv:2301.10140.