PreprintCited by 12

The DOI matches its Crossref record; 4 of the 4 references it cites were found in a registry or an index.

Artifacts in single-cell mitochondrial DNA mutation analyses misinform phylogenetic inference

Lareau, Caleb A., Chapman, Michael S., Penter, Livius, Nawy, Tal, Pe’er, Dana, Ludwig, Leif S.·2024

Abstract

Sequencing mitochondrial DNA (mtDNA) variants from single cells has resolved clonality and lineage in native human samples and clinical specimens. Prior work established that heteroplasmic mtDNA variants can be used to delineate clonality in hematopoiesis, but they have limited ability to reconstruct cellular phylogenies. However, a recent report by Weng et al . challenges the current paradigm by describing an unprecedented number of shared mtDNA variants between cells that reportedly resolve high-resolution phylogenetic trees. We re-examined the claims of Weng et al ., and identified two major points of concern regarding this unprecedented connectedness. First, shared variants between cells are disproportionately detected in a single molecule per cell, and second, these variants are enriched 10–20-fold at the edges of mtDNA molecules, reminiscent of artifacts reported in other sequencing approaches. Further, our analyses show that pruning low support and likely artificial mtDNA variants removes nearly all of the reported phylogenetic structure. Thus, we strongly caution against using mtDNA variant calling workflows that rely on minimal evidence, including the computational pipeline introduced in Weng et al ., as variants with high connectedness and low evidence are likely artifacts that lead to the construction of false phylogenies.

Overview

The claims and statistics of this paper haven’t been checked yet.

Run the check — free, no account needed. It reads the open-access text and checks the sources it cites.

A few free checks a day · papers already verified open instantly · results are public

Integrity signals

Registry

Crossref · 10.1101/2024.07.28.605517

Cites

4 of 4 references verified0 citation errors · 0 not checkable

Statistics

Figures

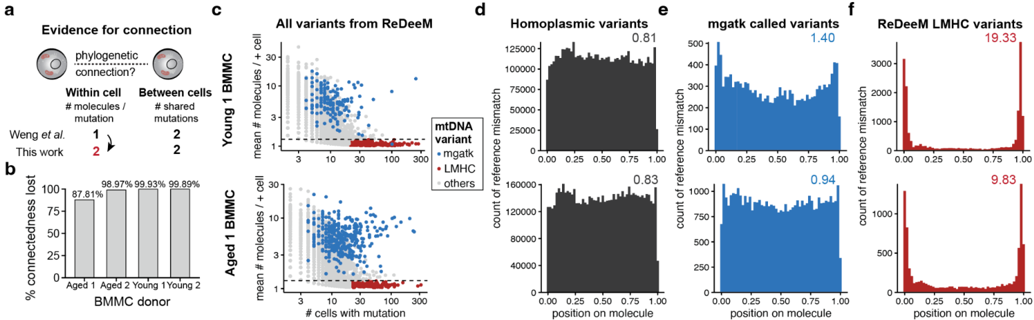
Figure 1 ReDeeM-based cell-cell connectivity is driven by low-mean frequency but highly abundant variants of an irregular nature. (a) Schematic of key parameters, including within cell (left) and between cell (right) values required to establish cell-cell connectedness. (b) Summary of % connectedness lost for four donors profiled by ReDeeM after increasing the required number of mtDNA molecules per mutation per cell from 1 to 2 mutations to establish connectedness between two cells. BMMC, bone marrow mononuclear cells. (c) Annotation of all variants called using the ReDeeM workflow. Individual variants (dots) are colored by overlap with mgatk (blue) or low mean, high connectedness (LMHC) variants (red). (d) Meta pileup of the position of the mismatches for all homoplasmic variants for two donors ('Young 1' - top; 'Aged 1' - bottom'). Molecule fragment sizes were normalized and show the relative position of the variant, with 0.50 corresponding to the middle of the molecule and 0.00 and 1.00 to the respective ends. (e) Same as in (d), but for variants called by mgatk. (f) Same as in (d), but for the LMHC variants called only by ReDeeM. For d-f, values above each plot represent the fold enrichment of mismatches at the edges of molecules ( Methods ).
Figure 1 ReDeeM-based cell-cell connectivity is driven by low-mean frequency but highly abundant variants of an irregular nature. (a) Schematic of key parameters, including within cell (left) and between cell (right) values required to establish cell-cell connectedness. (b) Summary of % connectedness lost for four donors profiled by ReDeeM after increasing the required number of mtDNA molecules per mutation per cell from 1 to 2 mutations to establish connectedness between two cells. BMMC, bone marrow mononuclear cells. (c) Annotation of all variants called using the ReDeeM workflow. Individual variants (dots) are colored by overlap with mgatk (blue) or low mean, high connectedness (LMHC) variants (red). (d) Meta pileup of the position of the mismatches for all homoplasmic variants for two donors ('Young 1' - top; 'Aged 1' - bottom'). Molecule fragment sizes were normalized and show the relative position of the variant, with 0.50 corresponding to the middle of the molecule and 0.00 and 1.00 to the respective ends. (e) Same as in (d), but for variants called by mgatk. (f) Same as in (d), but for the LMHC variants called only by ReDeeM. For d-f, values above each plot represent the fold enrichment of mismatches at the edges of molecules ( Methods ).CC-BY · From the PDF
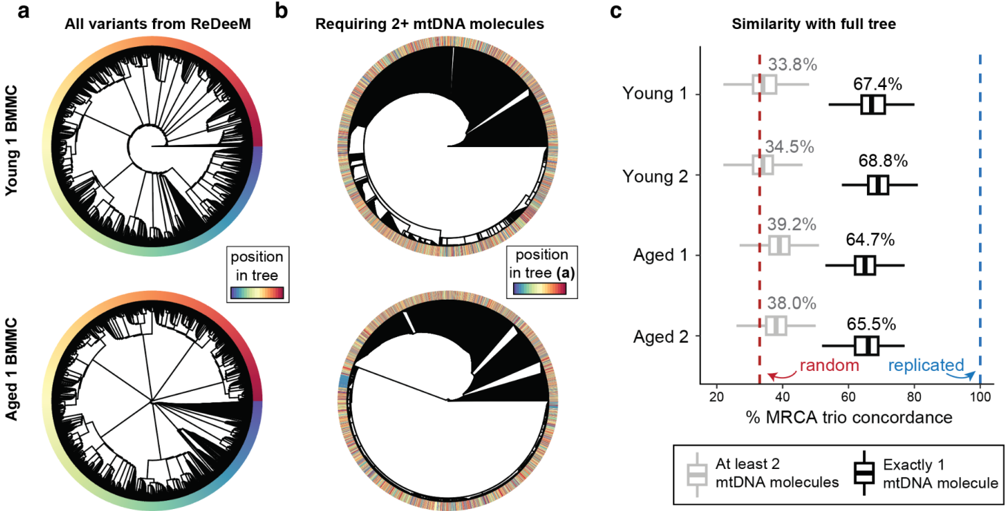
Figure 2 Phylogenetic tree inferences are primarily driven by variants supported by only one molecule. (a,b) Phylogenetic trees of BMMCs from Young 1 and Aged 1 individuals were constructed using ( a ) all variants from the ReDeeM pipeline or ( b ) only variants that are supported by 2+ mtDNA molecules. The color bar marks the relative position of cells in the topology in (a), showing substantial reshuffling of cells following removal of cell/variant calls with exactly one molecule of support in (b). (c) Quantification of tree similarity between (a) and (b) using trio analyses to determine most recent common ancestors (MRCA), when considering variants with 2+ mtDNA molecules of support (grey), compared to only considering variants supported by exactly 1 mtDNA molecule (black). Box plots represent 100 bootstraps each of 1,000 trios that were compared using the tree in (a) as the 'truth' and the tree in (b) as the 'query'. MRCA trio analyses would yield a mean of 33.3% for completely random trees (dotted red line).
Figure 2 Phylogenetic tree inferences are primarily driven by variants supported by only one molecule. (a,b) Phylogenetic trees of BMMCs from Young 1 and Aged 1 individuals were constructed using ( a ) all variants from the ReDeeM pipeline or ( b ) only variants that are supported by 2+ mtDNA molecules. The color bar marks the relative position of cells in the topology in (a), showing substantial reshuffling of cells following removal of cell/variant calls with exactly one molecule of support in (b). (c) Quantification of tree similarity between (a) and (b) using trio analyses to determine most recent common ancestors (MRCA), when considering variants with 2+ mtDNA molecules of support (grey), compared to only considering variants supported by exactly 1 mtDNA molecule (black). Box plots represent 100 bootstraps each of 1,000 trios that were compared using the tree in (a) as the 'truth' and the tree in (b) as the 'query'. MRCA trio analyses would yield a mean of 33.3% for completely random trees (dotted red line).CC-BY · From the PDF
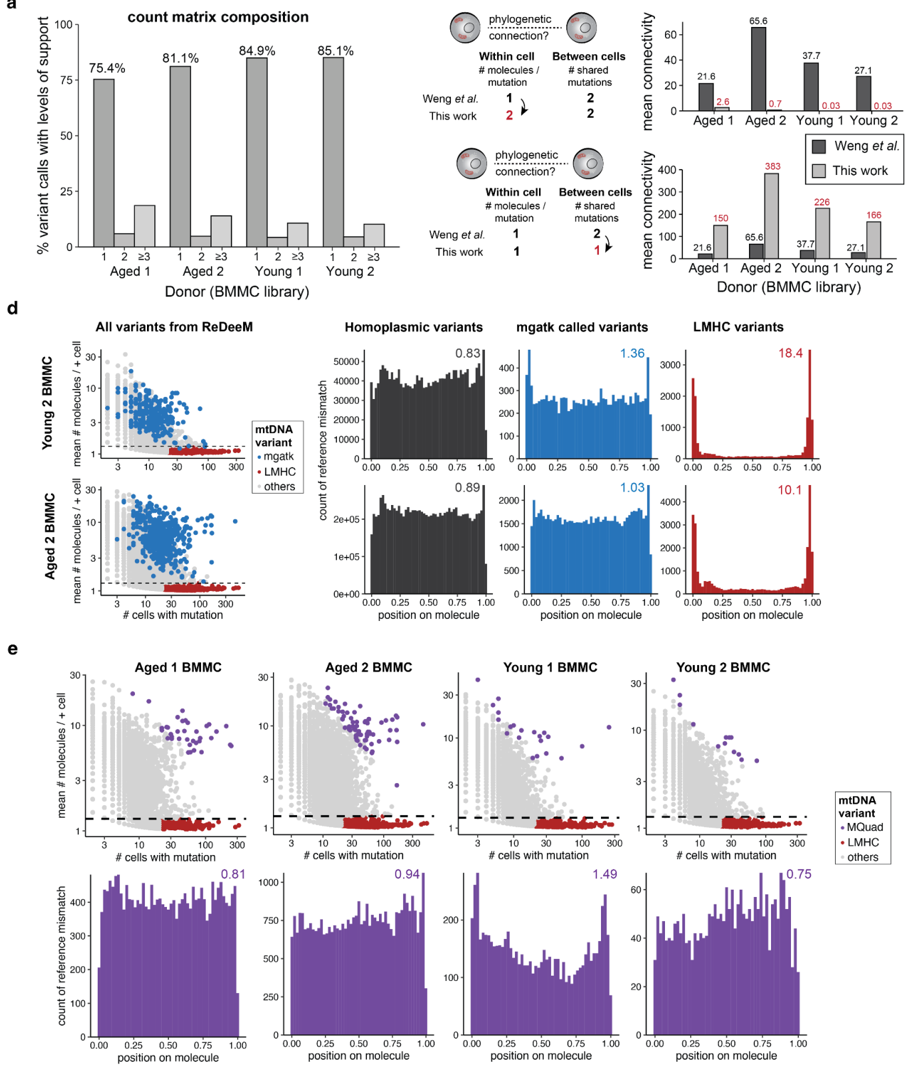
Extended Data Figure 1. The majority of ReDeeM-called variants have low support and are likely artificial. (a) Summary of support per variant per cell, stratified by donor, represented as the percent of non-zero entries in the cell-by-variant ReDeeM matrix. The percent of variants with exactly 1, 2 or ≥3 molecules of support per cell appears above the corresponding bars. (b,c) Connectedness analyses, including key parameter adjustments (left) and the effects on mean connectivity (right). (d) Same analyses as in Fig. 1 , but for the two other donors profiled by Weng et al. , showing similar positional bias in LMHC variants. (e) Annotation of all variants called using the ReDeeM workflow, including variants called by MQuad (purple) for four donors (top). Meta pileup of the position of the mismatches for variants called by MQuad (bottom). The values above each plot represent the fold enrichment of mismatches at the edges of molecules.
Extended Data Figure 1. The majority of ReDeeM-called variants have low support and are likely artificial. (a) Summary of support per variant per cell, stratified by donor, represented as the percent of non-zero entries in the cell-by-variant ReDeeM matrix. The percent of variants with exactly 1, 2 or ≥3 molecules of support per cell appears above the corresponding bars. (b,c) Connectedness analyses, including key parameter adjustments (left) and the effects on mean connectivity (right). (d) Same analyses as in Fig. 1 , but for the two other donors profiled by Weng et al. , showing similar positional bias in LMHC variants. (e) Annotation of all variants called using the ReDeeM workflow, including variants called by MQuad (purple) for four donors (top). Meta pileup of the position of the mismatches for variants called by MQuad (bottom). The values above each plot represent the fold enrichment of mismatches at the edges of molecules.CC-BY · From the PDF
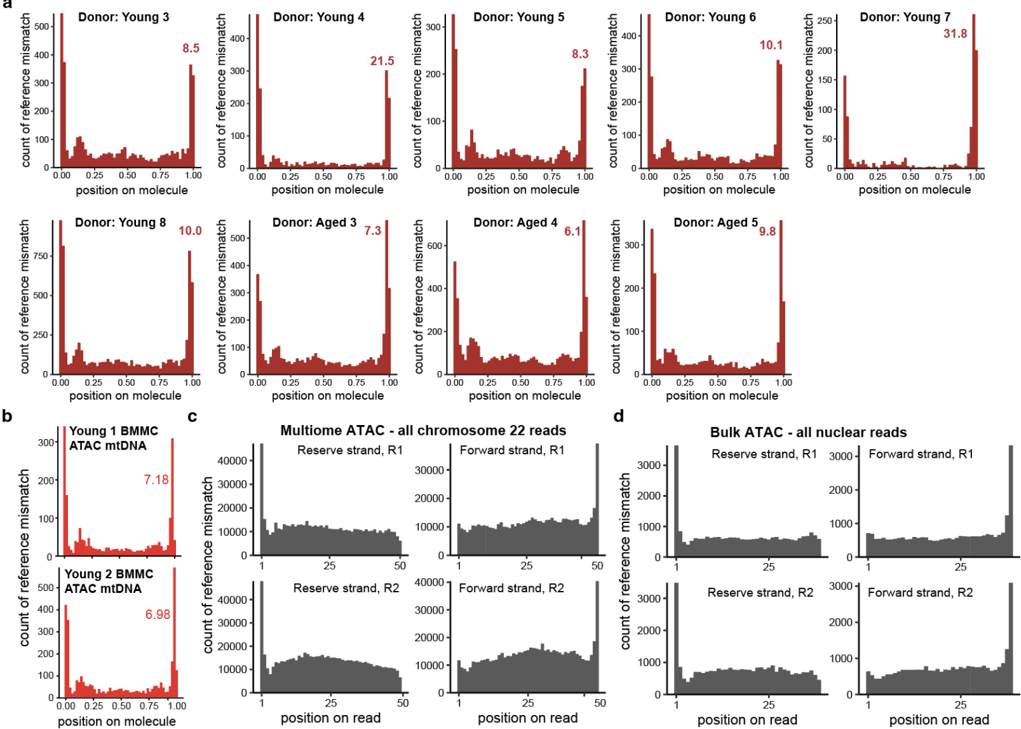
Extended Data Figure 2. Mismatch position bias is present throughout ATAC-seq-derived molecules. (a) Pileup of LMHC variants for 9 additional donors from the ReDeeM hashing experiments. Values in each panel represent the fold enrichment of mismatches at the edges of molecules relative to the center. (b) Pileup of LMHC variants from Fig. 1c and Extended Data Fig. 1d from the multiome ATAC-seq library. Values in each panel represent the fold enrichment of mismatches at the edges of molecules. (c) Pileup of all positions containing a mismatch or reads mapping to the reverse strand or forward strand of chromosome 22, split by the sequencing read, from a publicly available single-nucleus peripheral blood mononuclear cell multiome experiment ( Methods ). (d) Same as in (c) but for a bulk ATAC-seq experiment 3 summarizing all nuclear chromosomes. Note that no variant calling was performed for panels c and d, such that pileups reflect all mismatches from the reference observed in the library.
Extended Data Figure 2. Mismatch position bias is present throughout ATAC-seq-derived molecules. (a) Pileup of LMHC variants for 9 additional donors from the ReDeeM hashing experiments. Values in each panel represent the fold enrichment of mismatches at the edges of molecules relative to the center. (b) Pileup of LMHC variants from Fig. 1c and Extended Data Fig. 1d from the multiome ATAC-seq library. Values in each panel represent the fold enrichment of mismatches at the edges of molecules. (c) Pileup of all positions containing a mismatch or reads mapping to the reverse strand or forward strand of chromosome 22, split by the sequencing read, from a publicly available single-nucleus peripheral blood mononuclear cell multiome experiment ( Methods ). (d) Same as in (c) but for a bulk ATAC-seq experiment 3 summarizing all nuclear chromosomes. Note that no variant calling was performed for panels c and d, such that pileups reflect all mismatches from the reference observed in the library.CC-BY · From the PDF
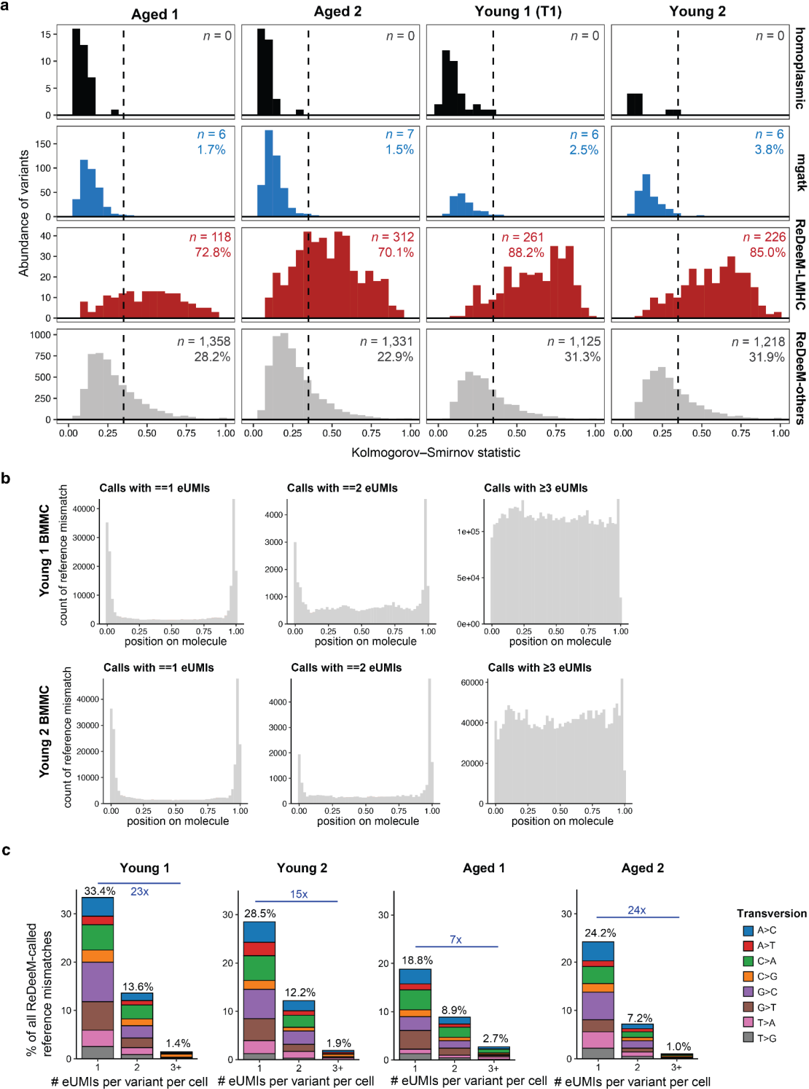
Extended Data Figure 3. A substantial set of ReDeeM variants exhibit artifactual features. (a) Kolmogorov-Smirnov (KS) statistics for variants identified via different methods. The number and percentage of variants with a KS statistic > 0.35 (dotted line) are reported per panel. (b) Pileup of all ReDeeM-called heteroplasmic variants, stratified by the amount of support (i.e., eUMIs per variant per cell). Each variant is represented in two or more panels per donor. (c) The composition of nucleotide changes at the edges of molecules, stratified by the number of eUMIs detected for the mutation. Percentages represent the sums of all transversions; blue numbers represent the fold enrichment of transversions between 1 eUMI and 3+ eUMI categories for each donor.
Extended Data Figure 3. A substantial set of ReDeeM variants exhibit artifactual features. (a) Kolmogorov-Smirnov (KS) statistics for variants identified via different methods. The number and percentage of variants with a KS statistic > 0.35 (dotted line) are reported per panel. (b) Pileup of all ReDeeM-called heteroplasmic variants, stratified by the amount of support (i.e., eUMIs per variant per cell). Each variant is represented in two or more panels per donor. (c) The composition of nucleotide changes at the edges of molecules, stratified by the number of eUMIs detected for the mutation. Percentages represent the sums of all transversions; blue numbers represent the fold enrichment of transversions between 1 eUMI and 3+ eUMI categories for each donor.CC-BY · From the PDF
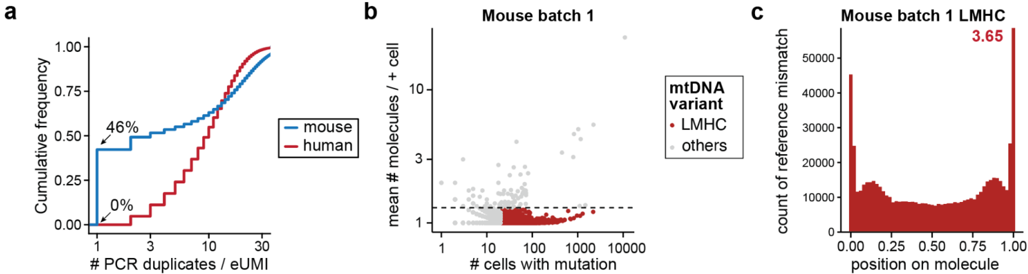
Extended Data Figure 4. Comparison of human hematopoiesis and murine CRISPR tracing tumors. (a) Cumulative distribution plot comparing the number of PCR duplicates per endogenous unique molecular identifier (eUMI) in the Young 1 human bone marrow dataset (human) and a mouse Kras;Trp53 (KP) tumor model. Highlighted percentages represent the number of eUMIs with exactly 1 PCR duplicate. (b) Annotation of low mean, high connectedness (LMHC) variants in the mouse KP tumor validation data. (c) Summary of reference mismatch positions in the murine data for the LMHCs in (b).
Extended Data Figure 4. Comparison of human hematopoiesis and murine CRISPR tracing tumors. (a) Cumulative distribution plot comparing the number of PCR duplicates per endogenous unique molecular identifier (eUMI) in the Young 1 human bone marrow dataset (human) and a mouse Kras;Trp53 (KP) tumor model. Highlighted percentages represent the number of eUMIs with exactly 1 PCR duplicate. (b) Annotation of low mean, high connectedness (LMHC) variants in the mouse KP tumor validation data. (c) Summary of reference mismatch positions in the murine data for the LMHCs in (b).CC-BY · From the PDF

Verification

Claims the paper makes

The claims and statistics of this paper haven’t been checked yet.

Run the check — free, no account needed. It reads the open-access text and checks the sources it cites.

A few free checks a day · papers already verified open instantly · results are public

Claims other papers make about this one

Each is checked against this paper’s own text: does it say what the citing paper says it does?

Self-check

Percentages, sums and reported differences re-computed from the paper’s own numbers.

The self-check needs the paper’s full text.

Citations

Cites

Show all 4 references

Research works printed but not linked: 28

  1. 10.1126/science.abm5874 · DOI · Paper page
  2. 10.1158/2159-8290.CD-21-0276 · DOI
  3. 10.1016/j.cell.2019.01.022 · DOI · Paper page
  4. 2022, Mitochondrial variant enrichment from high-throughput single-cell RNA sequencing resolves clonal populations, Nat. Biotechnol, 40, 1030, 10.1038/s41587-022-01210-8 · DOI
  5. Weng, C. et al. Deciphering cell states and genealogies of human hematopoiesis. Nature (2024). · DOI
  6. 10.21203/rs.3.rs-3083262/v1 · DOI · Paper page
  7. 2021, Massively parallel single-cell mitochondrial DNA genotyping and chromatin profiling, Nat. Biotechnol, 39, 451, 10.1038/s41587-020-0645-6 · DOI · Paper page
  8. 10.1101/2024.05.15.594338 · DOI
  9. 10.1038/s41586-022-04786-y · DOI · Paper page
  10. 10.1038/nature21703 · DOI
  11. 10.1038/S41587-021-00927-2 · DOI · Paper page
  12. 10.1038/s41590-022-01327-7 · DOI
  13. 10.1182/blood-2017-02-769869 · DOI · Paper page
  14. 10.1126/science.335.6074.1302-a · DOI
  15. 10.1126/science.335.6074.1302-a · DOI
  16. 2021, Somatic mutation landscapes at single-molecule resolution, Nature, 593, 405, 10.1038/s41586-021-03477-4 · DOI · Paper page
  17. 10.7554/elife.70899.sa0 · DOI
  18. 2024, Mapping genotypes to chromatin accessibility profiles in single cells, Nature, 629, 1149, 10.1038/s41586-024-07388-y · DOI
  19. Nitsch, L. , Lareau, C. A. & Ludwig, L. S. Mitochondrial genetics through the lens of single-cell multi-omics. Nat. Genet. 1–11 (2024). · DOI
  20. 2022, MQuad enables clonal substructure discovery using single cell mitochondrial variants, Nat. Commun, 13, 1205, 10.1038/s41467-022-28845-0 · DOI
  21. 2024, Single-cell mtDNA dynamics in tumors is driven by coregulation of nuclear and mitochondrial genomes, Nat. Genet, 56, 889, 10.1038/s41588-024-01724-8 · DOI
  22. 10.1073/pnas.2013724117 · DOI
  23. 10.1073/pnas.1607794113 · DOI · Paper page
  24. 2024, Mitochondrial haplotype and mito-nuclear matching drive somatic mutation and selection throughout ageing, Nat Ecol Evol, 8, 1021, 10.1038/s41559-024-02338-3 · DOI
  25. 10.1038/ng.806 · DOI
  26. 2024, Mitochondrial DNA mosaicism in normal human somatic cells, Nat. Genet, 56, 1665, 10.1038/s41588-024-01838-z · DOI
  27. 10.1038/s44318-024-00183-5 · DOI
  28. 2023, Mitochondrial single-cell ATAC-seq for high-throughput multi-omic detection of mitochondrial genotypes and chromatin accessibility, Nat. Protoc, 18, 1416, 10.1038/s41596-022-00795-3 · DOI

Cited by

See all 12

Metadata

Authors
Lareau, C. A., Chapman, M. S., Penter, L., Nawy, T., Pe’er, D., & Ludwig, L. S.
Publisher
openRxiv
Published
2024-07-29
Cited by
12
References
4
Type
Preprint

About these checks

Registry, retraction, Cites and statistics results are computed, not judged, with one exception: a printed reference that no index lists is read once by a model before it counts as a citation error. Claims are extracted by a model and kept only when their quote appears verbatim in the text; each cited source is then checked, with a model’s help, for whether it says what the claim relies on. Those verdicts can be wrong — read the claim’s quote and the cited source before relying on one.

Statistics and arithmetic are recomputed, not judged.

Confidence bands are shown only for fields calibrated on our annotated test set. None is calibrated yet, so no band is shown.

What counts as a claim ›How we measure confidence ›How we check this ›

Are you an author, or do you see a problem with this page? Request a review

How to cite

Cite CoChat for the checks on this page, and the paper for its own findings.

This page
CoChat. (2026). Citation check: Artifacts in single-cell mitochondrial DNA mutation analyses misinform phylogenetic inference. https://app.cochat.ai/papers/10.1101/2024.07.28.605517
The paper
Lareau, C. A., Chapman, M. S., Penter, L., Nawy, T., Pe’er, D., & Ludwig, L. S. (2024). Artifacts in single-cell mitochondrial DNA mutation analyses misinform phylogenetic inference. https://doi.org/10.1101/2024.07.28.605517