PreprintCited by 5Cellular transport and secretionAutophagy in Disease and TherapyEndoplasmic Reticulum Stress and Disease

The DOI matches its Crossref record; 1 of the 1 references it cites were found in a registry or an index.

TUG protein acts through a disordered region to organize the early secretory pathway

Open access

Preprint — published as 10.1038/s41467-025-60691-8 · Paper page

Abstract

The endoplasmic reticulum (ER)-Golgi Intermediate Compartment (ERGIC) is a distinct compartment in mammalian cells, which forms in part by homotypic fusion of ER-derived vesicles and gives rise to the cis cisterna of the Golgi ribbon. How the ERGIC is regulated is not well understood. Here we show that the TUG protein is essential to maintain this compartment as a distinct organelle. TUG (UBXN9, Aspscr1) is known to regulate the cell type -specific trafficking of GLUT4 glucose transporters, but its role in more ubiquitous trafficking pathways has not been well characterized. TUG localized to the ERGIC and in fibroblasts its deletion enhanced anterograde flux and increased resorption of ERGIC markers into the cis-Golgi, perturbing membrane homeostasis in the early secretory pathway. TUG knockout cells had a compacted Golgi morphology, and ultrastructural studies revealed dilated cisterna with surrounding small vesicles. A central disordered region in TUG mediated its recruitment to ERGIC membranes, and an amino terminal domain was sufficient to induce oligomerization in cells. In TUG knockout cells, ERGIC-dependent processes such as autophagy are disrupted and model cargoes such as CFTR are missorted. Together, these results reveal a novel, TUG-dependent regulatory mechanism in the early secretory pathway, which modulates ERGIC organization and anterograde trafficking. This function is co-opted by GLUT4 and other proteins that employ an unconventional secretion pathway to the plasma membrane.

Overview

The claims and statistics of this paper haven’t been checked yet.

Run the check — free, no account needed. It reads the open-access text and checks the sources it cites.

A few free checks a day · papers already verified open instantly · results are public

Integrity signals

Registry

Crossref · 10.1101/2024.08.09.607373

Cites

1 of 1 references verified0 citation errors · 0 not checkable

Statistics

Figures

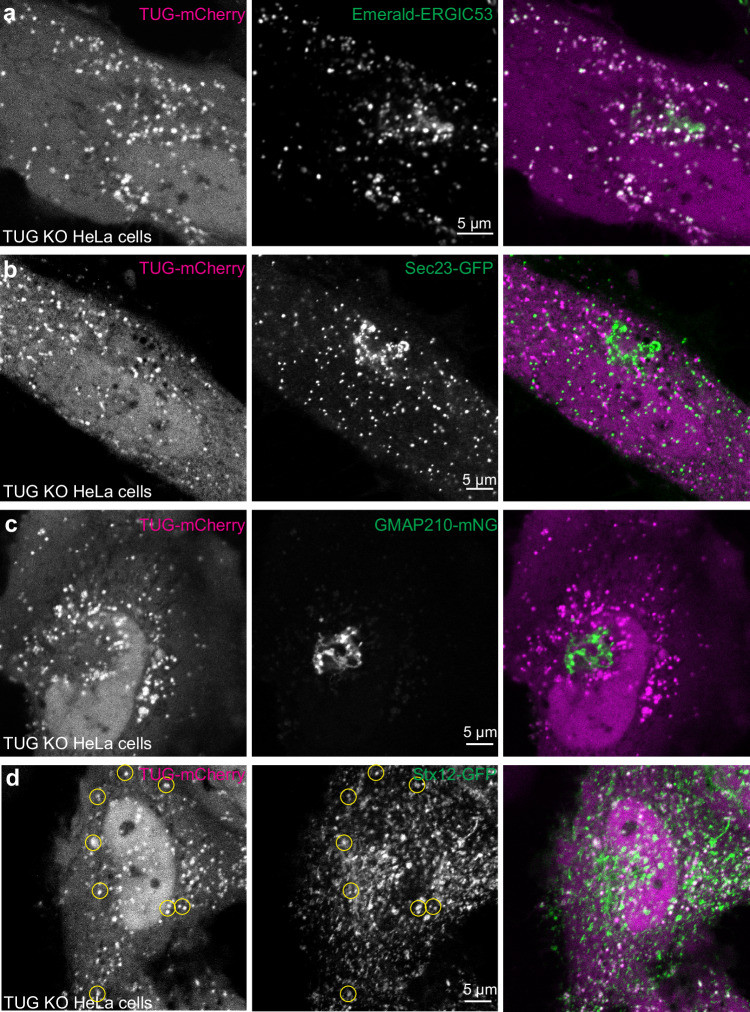
Fig. 1 TUG localizes to the ERGIC. a–d Confocal images are shown of TUG KO HeLa cells co-transfected with mCherry-tagged TUG (Tug-mCherry; magenta) together with Emerald-tagged ERGIC53 (Em-ERGIC53; a; green), the ERES marker Sec23-GFP (b; green), the Golgi marker mNG-tagged GMAP210 (GMAP210-mNG; c; green) and Stx12-GFP (d; green). Note the colocalization between TUG and ERGIC53 in peripheral punctate structures. TUG puncta also are positive for Stx12 (yellow circles), but are distinct from the ERES (Sec23) and are excluded from the Golgi apparatus (GMAP210). Images for co-transfection of Tug-mCherry with Em-ERGIC53 are representative of three independent experiments with similar results. Those for Sec23-GFP and GMAP210-mNG and Stx12-GFP are representative of two independent experiments with similar results.
Fig. 1 TUG localizes to the ERGIC. a–d Confocal images are shown of TUG KO HeLa cells co-transfected with mCherry-tagged TUG (Tug-mCherry; magenta) together with Emerald-tagged ERGIC53 (Em-ERGIC53; a; green), the ERES marker Sec23-GFP (b; green), the Golgi marker mNG-tagged GMAP210 (GMAP210-mNG; c; green) and Stx12-GFP (d; green). Note the colocalization between TUG and ERGIC53 in peripheral punctate structures. TUG puncta also are positive for Stx12 (yellow circles), but are distinct from the ERES (Sec23) and are excluded from the Golgi apparatus (GMAP210). Images for co-transfection of Tug-mCherry with Em-ERGIC53 are representative of three independent experiments with similar results. Those for Sec23-GFP and GMAP210-mNG and Stx12-GFP are representative of two independent experiments with similar results.CC BY · PubMed Central
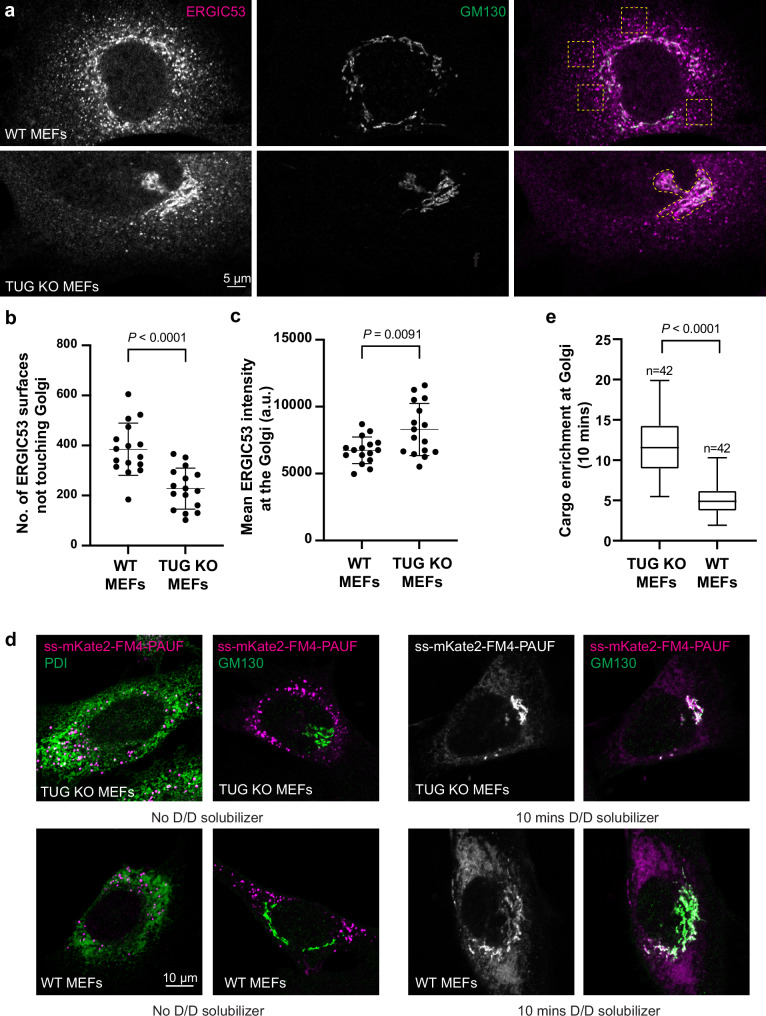
Fig. 2 TUG regulates anterograde trafficking. a WT (top) and TUG KO (bottom) MEFs were fixed and stained using antibodies to the ERGIC marker ERGIC53 (magenta) and the cis-Golgin GM130 (green). Images are a single slice from a confocal stack. Dashed boxes in the top image denote peripheral punctate staining of ERGIC53, which is devoid of GM130. The dashed region in the bottom image denotes the Golgi, based on GM130 staining. Note the reduction in peripheral ERGIC53 puncta in TUG KO MEFs, compared to WT cells, and increased ERGIC53 distribution at the cis-Golgi. b Confocal images were segmented to generate ERGIC53 and GM130 surfaces. The graph compares independent ERGIC53 surfaces (not touching GM130 surfaces) in WT and TUG KO MEFs. A reduction in the number of independent ERGIC53 surfaces was observed in TUG KO MEFs. Data from 16 WT and 16 KO cells are shown; mean ± standard deviation (s.d.). c The graph compares average intensities of ERGIC53 staining at the Golgi after collapsing a confocal stack. Data from 16 WT and 16 KO cells are shown; mean ± s.d. d Images of TUG KO (top) and WT (bottom) MEFs containing retroviruses to express PAUF tagged with mKate2 and FM4 domains. The FM4 domains cause aggregation of PAUF in the ER (marked by PDI, in green; left), and is distinct from GM130 (green; right) signal in the absence of D/D solubilizer. The addition of D/D-solubilizer releases PAUF from the ER for anterograde traffic through the secretory pathway. Cells were fixed 10 min after the addition of D/D solubilizer and were imaged (right). In TUG KO MEFs (top), most signal is concentrated at the Golgi, but in WT MEFs there is also surrounding ER signal. e Data from replicates of the experiment in f were quantified, and enrichment of mKate2-tagged PAUF signal at the Golgi is normalized to the signal in the surrounding ER. N = 42 cells in each group, acquired from 4 independent experiments. The box indicates median and quartile ranges, and whiskers show the spread of the data from minimum to maximum. All statistical analyses used an unpaired two-tailed t test with Welch’s correction.
Fig. 2 TUG regulates anterograde trafficking. a WT (top) and TUG KO (bottom) MEFs were fixed and stained using antibodies to the ERGIC marker ERGIC53 (magenta) and the cis-Golgin GM130 (green). Images are a single slice from a confocal stack. Dashed boxes in the top image denote peripheral punctate staining of ERGIC53, which is devoid of GM130. The dashed region in the bottom image denotes the Golgi, based on GM130 staining. Note the reduction in peripheral ERGIC53 puncta in TUG KO MEFs, compared to WT cells, and increased ERGIC53 distribution at the cis-Golgi. b Confocal images were segmented to generate ERGIC53 and GM130 surfaces. The graph compares independent ERGIC53 surfaces (not touching GM130 surfaces) in WT and TUG KO MEFs. A reduction in the number of independent ERGIC53 surfaces was observed in TUG KO MEFs. Data from 16 WT and 16 KO cells are shown; mean ± standard deviation (s.d.). c The graph compares average intensities of ERGIC53 staining at the Golgi after collapsing a confocal stack. Data from 16 WT and 16 KO cells are shown; mean ± s.d. d Images of TUG KO (top) and WT (bottom) MEFs containing retroviruses to express PAUF tagged with mKate2 and FM4 domains. The FM4 domains cause aggregation of PAUF in the ER (marked by PDI, in green; left), and is distinct from GM130 (green; right) signal in the absence of D/D solubilizer. The addition of D/D-solubilizer releases PAUF from the ER for anterograde traffic through the secretory pathway. Cells were fixed 10 min after the addition of D/D solubilizer and were imaged (right). In TUG KO MEFs (top), most signal is concentrated at the Golgi, but in WT MEFs there is also surrounding ER signal. e Data from replicates of the experiment in f were quantified, and enrichment of mKate2-tagged PAUF signal at the Golgi is normalized to the signal in the surrounding ER. N = 42 cells in each group, acquired from 4 independent experiments. The box indicates median and quartile ranges, and whiskers show the spread of the data from minimum to maximum. All statistical analyses used an unpaired two-tailed t test with Welch’s correction.CC BY · PubMed Central
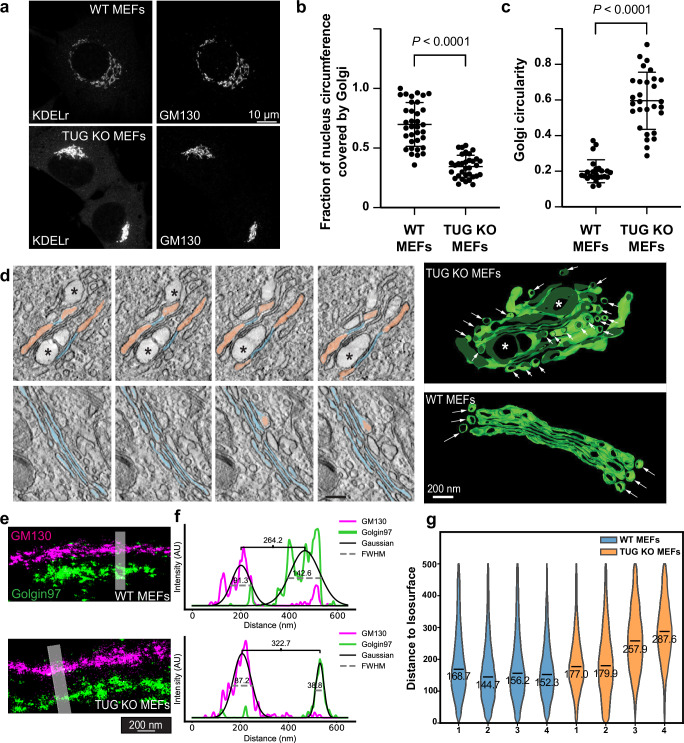
Fig. 3 TUG regulates the organization of the Golgi apparatus. a WT and TUG KO MEFs were immunostained to detect KDELr and GM130. Note the compacted Golgi morphology in TUG KO MEFs. b Quantification of Golgi length along the nuclear circumference. Plots show mean ± s.d.; N = 35 WT and 33 KO cells, analyzed using a two-tailed t test. c Compaction of Golgi based on GM130 images was calculated using a circularity function (see Methods). Plots show mean ± s.d.; N = 24 WT and 29 KO cells, analyzed using a two-tailed t test. d Electron microscopy (EM) tomography imaging of Golgi complexes in WT and TUG KO MEFs. At left, cross sections of TUG KO (upper) and WT (lower panels) MEFs are shown. Narrow, well-stacked cisternae are pseudo-colored in blue, dilated cisternae are salmon, and ballooned areas are marked by asterisks. At right, tomographic reconstructions of Golgi complexes in TUG KO and WT MEFs are shown. In addition to dilated cisterna, accumulated small vesicles were observed in TUG KO cells (arrows). e 4Pi-SMS side view images of Golgi stacks are shown, immunostained for GM130 (cis-Golgi; magenta) and Golgin97 (trans-Golgi; green). Images from WT and TUG KO MEFs are indicated. Shaded areas were used to quantify the separation of cis and trans markers in line scan profiles. f Line scan profiles were generated for GM130 and Golgin97. The intensity profile in each channel was fitted to a gaussian and the peak-to-peak distance was used to measure the separation between these cis and trans markers. In the example shown, this distance was 264 nm in WT MEFs and 323 nm in TUG KO MEFs; the increase in KO cells was ~60 nm. FWHM represents full width at half-maximum. g Violin plots of the shortest distances of trans points to the cis isosurface for four WT and four TUG KO cells (see Supplementary fig. 4). The median value for each cell is indicated. For WT cells, N = 254,025, 291,063, 372,879, and 252,424 measurements; for KO cells, N = 290,987, 272,770, 156,019, and 163,102 measurements. The overall median distance was 155.0 nm for WT cells and 210.2 nm for KO cells.
Fig. 3 TUG regulates the organization of the Golgi apparatus. a WT and TUG KO MEFs were immunostained to detect KDELr and GM130. Note the compacted Golgi morphology in TUG KO MEFs. b Quantification of Golgi length along the nuclear circumference. Plots show mean ± s.d.; N = 35 WT and 33 KO cells, analyzed using a two-tailed t test. c Compaction of Golgi based on GM130 images was calculated using a circularity function (see Methods). Plots show mean ± s.d.; N = 24 WT and 29 KO cells, analyzed using a two-tailed t test. d Electron microscopy (EM) tomography imaging of Golgi complexes in WT and TUG KO MEFs. At left, cross sections of TUG KO (upper) and WT (lower panels) MEFs are shown. Narrow, well-stacked cisternae are pseudo-colored in blue, dilated cisternae are salmon, and ballooned areas are marked by asterisks. At right, tomographic reconstructions of Golgi complexes in TUG KO and WT MEFs are shown. In addition to dilated cisterna, accumulated small vesicles were observed in TUG KO cells (arrows). e 4Pi-SMS side view images of Golgi stacks are shown, immunostained for GM130 (cis-Golgi; magenta) and Golgin97 (trans-Golgi; green). Images from WT and TUG KO MEFs are indicated. Shaded areas were used to quantify the separation of cis and trans markers in line scan profiles. f Line scan profiles were generated for GM130 and Golgin97. The intensity profile in each channel was fitted to a gaussian and the peak-to-peak distance was used to measure the separation between these cis and trans markers. In the example shown, this distance was 264 nm in WT MEFs and 323 nm in TUG KO MEFs; the increase in KO cells was ~60 nm. FWHM represents full width at half-maximum. g Violin plots of the shortest distances of trans points to the cis isosurface for four WT and four TUG KO cells (see Supplementary fig. 4). The median value for each cell is indicated. For WT cells, N = 254,025, 291,063, 372,879, and 252,424 measurements; for KO cells, N = 290,987, 272,770, 156,019, and 163,102 measurements. The overall median distance was 155.0 nm for WT cells and 210.2 nm for KO cells.CC BY · PubMed Central
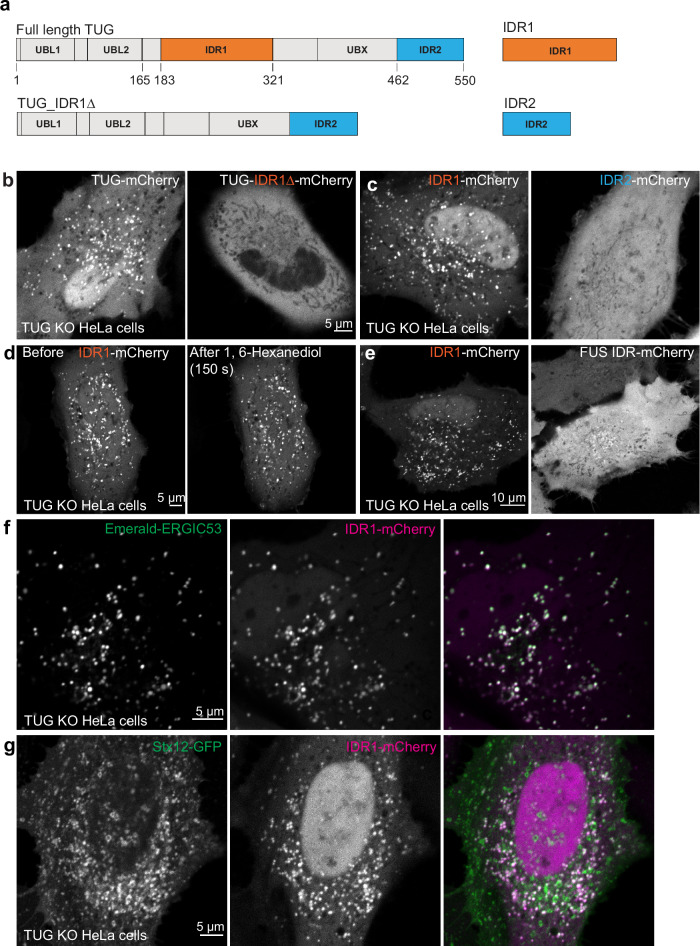
Fig. 4 The central disordered region (IDR1) in TUG is necessary and sufficient to mediate TUG localization to the ERGIC. a Schematic of TUG variants used for expression in TUG KO HeLa cells. All the proteins also contained a C-terminal mCherry tag to aid the visualization of the proteins in living cells. b Images of TUG KO HeLa cells transfected with full-length TUG (Tug-mCherry; left) or with a variant where the central IDR, IDR1 was deleted (Tug-IDR1∆-mCherry; right). Although full-length TUG forms punctate structures, the mutant is present in a diffuse distribution. Also note that the mutant is excluded from the nucleus. c Images of TUG KO HeLa cells transfected with IDR1 alone, tagged with mCherry (IDR1-mCherry; left), or with IDR2 alone, also tagged with mCherry (IDR2-mCherry; right). Although IDR1 forms punctate structures in cells, IDR2 is present in a diffuse distribution. In (b) and (c), a minimum of three independent transfections were performed for Tug-mCherry and IDR1-mCherry, three independent transfections for IDR2-mCherry and two independent transfections for Tug-IDR1∆-mCherry. d Images of TUG KO HeLa cells transfected with IDR1-mCherry and treated with 1,6-hexanediol and imaged before (left) or 150 sec. after 1,6-hexanediol treatment (right). Note that the punctate structures containing IDR1-mCherry continue to be present after 1,6-hexanediol treatment. The structures before and after are not necessarily at the same position, due to shift and refocusing during imaging after drug treatment. The treatment with 1,6-hexanediol was done three times, with similar results each time. e Images of TUG KO HeLa cells transfected with IDR1-mCherry (left) and mCherry-tagged IDR from FUS protein (right). Note the differences in the distribution of the two IDRs in cells. mCherry-tagged FUS IDR was transfected in TUG KO HeLa cells in two independent experiments, with similar results. f Images from TUG KO HeLa cells co-transfected with IDR1-mCherry (red) and Em-ERGIC53 (green). Note the colocalization of the two proteins in peripheral punctate structures. g Images from TUG KO HeLa cells co-transfected with IDR1-mCherry (red) and Stx12-GFP (green). Note the partial colocalization of the two proteins in punctate structures. Representative images for colocalization of IDR1-mCherry were from three independent experiments with Em-ERGIC53 (f) and two independent experiments with Stx12-GFP (g).
Fig. 4 The central disordered region (IDR1) in TUG is necessary and sufficient to mediate TUG localization to the ERGIC. a Schematic of TUG variants used for expression in TUG KO HeLa cells. All the proteins also contained a C-terminal mCherry tag to aid the visualization of the proteins in living cells. b Images of TUG KO HeLa cells transfected with full-length TUG (Tug-mCherry; left) or with a variant where the central IDR, IDR1 was deleted (Tug-IDR1∆-mCherry; right). Although full-length TUG forms punctate structures, the mutant is present in a diffuse distribution. Also note that the mutant is excluded from the nucleus. c Images of TUG KO HeLa cells transfected with IDR1 alone, tagged with mCherry (IDR1-mCherry; left), or with IDR2 alone, also tagged with mCherry (IDR2-mCherry; right). Although IDR1 forms punctate structures in cells, IDR2 is present in a diffuse distribution. In (b) and (c), a minimum of three independent transfections were performed for Tug-mCherry and IDR1-mCherry, three independent transfections for IDR2-mCherry and two independent transfections for Tug-IDR1∆-mCherry. d Images of TUG KO HeLa cells transfected with IDR1-mCherry and treated with 1,6-hexanediol and imaged before (left) or 150 sec. after 1,6-hexanediol treatment (right). Note that the punctate structures containing IDR1-mCherry continue to be present after 1,6-hexanediol treatment. The structures before and after are not necessarily at the same position, due to shift and refocusing during imaging after drug treatment. The treatment with 1,6-hexanediol was done three times, with similar results each time. e Images of TUG KO HeLa cells transfected with IDR1-mCherry (left) and mCherry-tagged IDR from FUS protein (right). Note the differences in the distribution of the two IDRs in cells. mCherry-tagged FUS IDR was transfected in TUG KO HeLa cells in two independent experiments, with similar results. f Images from TUG KO HeLa cells co-transfected with IDR1-mCherry (red) and Em-ERGIC53 (green). Note the colocalization of the two proteins in peripheral punctate structures. g Images from TUG KO HeLa cells co-transfected with IDR1-mCherry (red) and Stx12-GFP (green). Note the partial colocalization of the two proteins in punctate structures. Representative images for colocalization of IDR1-mCherry were from three independent experiments with Em-ERGIC53 (f) and two independent experiments with Stx12-GFP (g).CC BY · PubMed Central
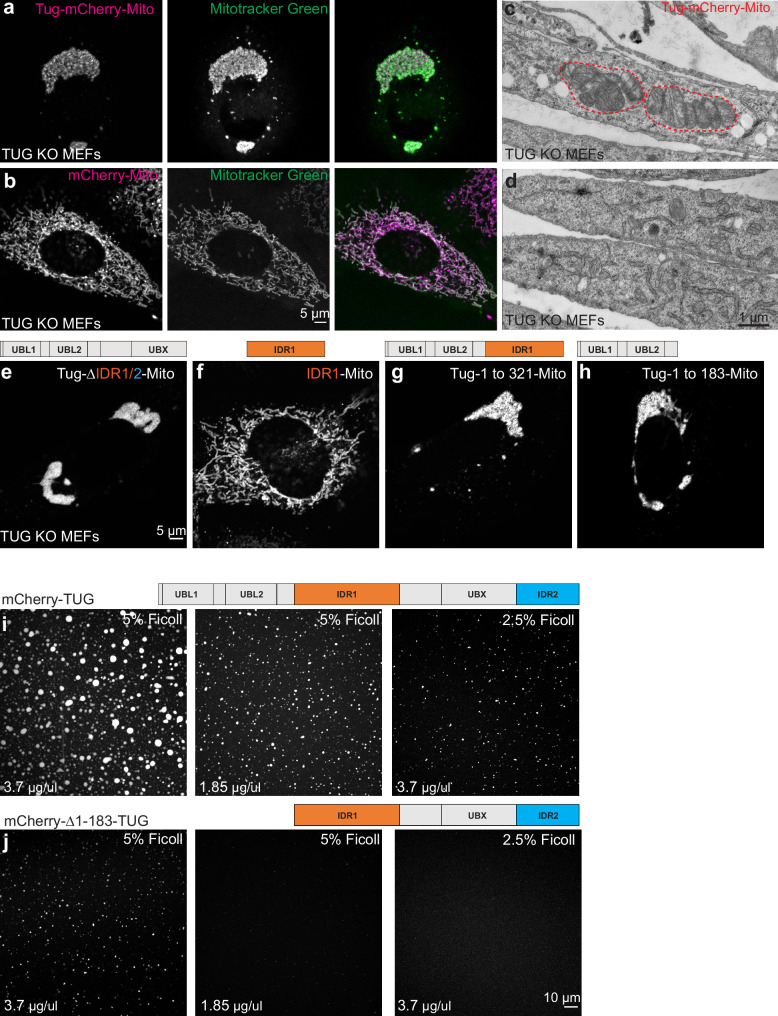
Fig. 5 TUG oligomerizes in trans via its N-terminal ubiquitin-like domains. a Images of TUG KO MEFs infected with retroviruses to express mCherry-tagged TUG (magenta) tethered to mitochondria by the fusion of a transmembrane domain from the protein mitochondrial monoamine oxidase A (Tug-mCherry-Mito). Living cells were also incubated with Mitotracker green (green), which was washed off prior to imaging. Tethering of TUG to mitochondria results in mitochondrial clumping. b Images of TUG KO MEFs expressing mCherry tethered to mitochondria (magenta), together with Mitotracker green (green). Mitochondria were present in a filamentous organization under this condition. c, d Electron micrographs from TUG KO MEFs expressing Tug-mCherry-Mito (c) or without any exogenous protein expression (control; d) are shown. Mitochondria appear stacked when TUG is tethered to the mitochondrial outer membrane by monoamine oxidase A, but are dispersed in control cells. e–h Images of TUG KO MEFs expressing different truncations of TUG tagged with mCherry and tethered to the mitochondria. Deletion of IDR1 and IDR2 shows that these regions are not required for clumping of mitochondria (e); IDR1 alone is not sufficient to clump mitochondria (f). The N-terminal structured UBL1 and UBL2 regions in TUG protein are sufficient to mediate protein-protein interaction in trans and thus to clump mitochondria when fused to the transmembrane domain of mitochondrial monoamine oxidase A (g, h). All the above images are from TUG KO MEFs stably expressing the constructs; cells were imaged in two independent experiments. i, j Purified mCherry-tagged TUG (i) and a truncated version (deletion of N-terminal UBL1 and UBL2 domains, ( j) were incubated in the presence of different concentrations of Ficoll 400 and the condensates were imaged at same settings using confocal microscopy. Based on the size and intensity of the condensates, it is evident that the full-length protein is more effective in condensate formation compared to the deletion mutant, implying the structured UBL domains function to promote TUG condensation. Images with 5% Ficoll 400 were all acquired at similar setting for the wildtype and the mutant protein. Images with 2.5% Ficoll are acquired in the same imaging settings for the wildtype and the mutant protein. Experiments were repeated at least twice with similar results.
Fig. 5 TUG oligomerizes in trans via its N-terminal ubiquitin-like domains. a Images of TUG KO MEFs infected with retroviruses to express mCherry-tagged TUG (magenta) tethered to mitochondria by the fusion of a transmembrane domain from the protein mitochondrial monoamine oxidase A (Tug-mCherry-Mito). Living cells were also incubated with Mitotracker green (green), which was washed off prior to imaging. Tethering of TUG to mitochondria results in mitochondrial clumping. b Images of TUG KO MEFs expressing mCherry tethered to mitochondria (magenta), together with Mitotracker green (green). Mitochondria were present in a filamentous organization under this condition. c, d Electron micrographs from TUG KO MEFs expressing Tug-mCherry-Mito (c) or without any exogenous protein expression (control; d) are shown. Mitochondria appear stacked when TUG is tethered to the mitochondrial outer membrane by monoamine oxidase A, but are dispersed in control cells. e–h Images of TUG KO MEFs expressing different truncations of TUG tagged with mCherry and tethered to the mitochondria. Deletion of IDR1 and IDR2 shows that these regions are not required for clumping of mitochondria (e); IDR1 alone is not sufficient to clump mitochondria (f). The N-terminal structured UBL1 and UBL2 regions in TUG protein are sufficient to mediate protein-protein interaction in trans and thus to clump mitochondria when fused to the transmembrane domain of mitochondrial monoamine oxidase A (g, h). All the above images are from TUG KO MEFs stably expressing the constructs; cells were imaged in two independent experiments. i, j Purified mCherry-tagged TUG (i) and a truncated version (deletion of N-terminal UBL1 and UBL2 domains, ( j) were incubated in the presence of different concentrations of Ficoll 400 and the condensates were imaged at same settings using confocal microscopy. Based on the size and intensity of the condensates, it is evident that the full-length protein is more effective in condensate formation compared to the deletion mutant, implying the structured UBL domains function to promote TUG condensation. Images with 5% Ficoll 400 were all acquired at similar setting for the wildtype and the mutant protein. Images with 2.5% Ficoll are acquired in the same imaging settings for the wildtype and the mutant protein. Experiments were repeated at least twice with similar results.CC BY · PubMed Central
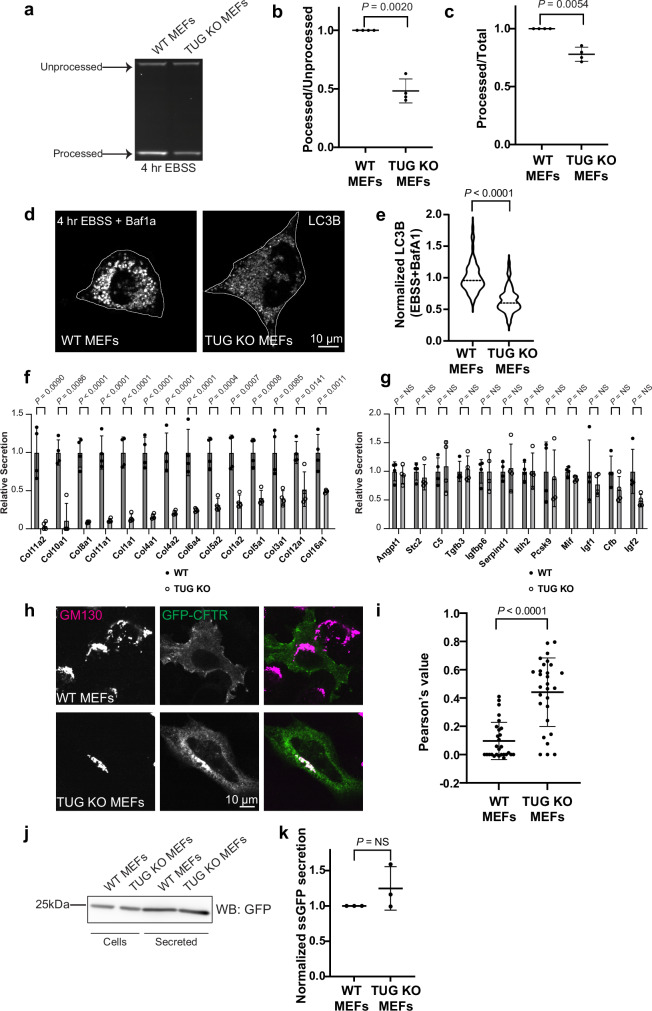
Fig. 6 Physiological effects of TUG deletion on autophagy, collagen secretion and CFTR trafficking. a In-gel fluorescence was used to monitor autophagic flux in WT and TUG KO MEFs. Processed and processed LC3 reporter bands were quantified. Note the low intensity of the processed band in KO MEFs. b, c Quantification of the ratio of processed to unprocessed LC3 bands (b) and ratio of intensities of processed to total LC3 reporter (c) from N = 4 independent experiments, normalized with respect to WT cells. Mean ± s.d., analyzed using a two-tailed t test. d Confocal images of WT and TUG KO MEFs, starved for 4 h in EBSS with BafA1 and stained for endogenous LC3B. Note the decreased LC3B in KO cells. e LC3B intensities per cell are plotted, normalized to the mean in WT cells. Medians are indicated. N = 70 WT and 61 KO cells from two independent experiments, analyzed using a two-tailed t test with Welch’s correction. f, g Abundances of secreted collagens (f) and control proteins (g) were quantified using mass spectrometry. Note the decreased collagen secretion in TUG KO MEFs. N = 4 independent experiments; mean ± s.d., analyzed using a two-tailed t test adjusted for multiple comparisons across all secreted proteins. h Images from WT and TUG KO MEFs transfected with GFP-tagged CFTR and stained using GFP booster (green) and an antibody to GM130. GFP-CFTR accumulates at the Golgi in TUG KO MEFs. i Pearson’s correlation coefficient was used to quantify the overlap of GFP-CFTR and GM130. N = 28 WT and 28 KO cells from three independent experiments. Mean ± s.d., analyzed by a two-tailed t test with Welch’s correction. Note that Pearson’s coefficient was increased in TUG KO cell, indicating that CFTR accumulates at the Golgi. j Immunoblot to detect abundances of ectopically expressed signal sequence-GFP (ssGFP) in cell lysates and secreted into media in WT and TUG KO MEFs. k Plots show the amount of secreted GFP, normalized to that in cell lysates. Data are normalized to WT cells. N = 3 independent experiments. Mean ± s.d., analyzed by a two-tailed t test with Welch’s correction.
Fig. 6 Physiological effects of TUG deletion on autophagy, collagen secretion and CFTR trafficking. a In-gel fluorescence was used to monitor autophagic flux in WT and TUG KO MEFs. Processed and processed LC3 reporter bands were quantified. Note the low intensity of the processed band in KO MEFs. b, c Quantification of the ratio of processed to unprocessed LC3 bands (b) and ratio of intensities of processed to total LC3 reporter (c) from N = 4 independent experiments, normalized with respect to WT cells. Mean ± s.d., analyzed using a two-tailed t test. d Confocal images of WT and TUG KO MEFs, starved for 4 h in EBSS with BafA1 and stained for endogenous LC3B. Note the decreased LC3B in KO cells. e LC3B intensities per cell are plotted, normalized to the mean in WT cells. Medians are indicated. N = 70 WT and 61 KO cells from two independent experiments, analyzed using a two-tailed t test with Welch’s correction. f, g Abundances of secreted collagens (f) and control proteins (g) were quantified using mass spectrometry. Note the decreased collagen secretion in TUG KO MEFs. N = 4 independent experiments; mean ± s.d., analyzed using a two-tailed t test adjusted for multiple comparisons across all secreted proteins. h Images from WT and TUG KO MEFs transfected with GFP-tagged CFTR and stained using GFP booster (green) and an antibody to GM130. GFP-CFTR accumulates at the Golgi in TUG KO MEFs. i Pearson’s correlation coefficient was used to quantify the overlap of GFP-CFTR and GM130. N = 28 WT and 28 KO cells from three independent experiments. Mean ± s.d., analyzed by a two-tailed t test with Welch’s correction. Note that Pearson’s coefficient was increased in TUG KO cell, indicating that CFTR accumulates at the Golgi. j Immunoblot to detect abundances of ectopically expressed signal sequence-GFP (ssGFP) in cell lysates and secreted into media in WT and TUG KO MEFs. k Plots show the amount of secreted GFP, normalized to that in cell lysates. Data are normalized to WT cells. N = 3 independent experiments. Mean ± s.d., analyzed by a two-tailed t test with Welch’s correction.CC BY · PubMed Central

Verification

Claims the paper makes

The claims and statistics of this paper haven’t been checked yet.

Run the check — free, no account needed. It reads the open-access text and checks the sources it cites.

A few free checks a day · papers already verified open instantly · results are public

Self-check

Percentages, sums and reported differences re-computed from the paper’s own numbers.

The self-check needs the paper’s full text.

Citations

Cites

Metadata

Authors
Parchure, A., Tejada, H., Xi, Z., Su, M., Julca-Zevallos, O., Alcazar-Roman, A. R., Yan, Y., Liu, X., Toomre, D., & Bogan, J. S.
Affiliations
  • Yale University (US)
  • Centre National de la Recherche Scientifique (FR)
Corresponding author
  • Parchure, Anup
  • Bogan, Jonathan S
Venue
Nature Communications
Publisher
openRxiv
Published
2024-08-10
Volume
16
Issue
1
Pages
5518-5518
ISSN
2041-1723 (ISSN-L)
OpenAlex
W4411886980
Cited by
5
References
1
Citations by year
2026: 3 · 2025: 1 · 2024: 1
FWCI
2.00
Type
journal article
Language
en
Open access
Locations
  • Nature Communications (publishedVersion, cc-by)
  • bioRxiv (Cold Spring Harbor Laboratory) (acceptedVersion, cc-by-nc-nd)
  • PubMed Central (publishedVersion, cc-by)
  • PubMed (publishedVersion)
  • HAL (submittedVersion, cc-by)
  • DOAJ (DOAJ: Directory of Open Access Journals) (submittedVersion, cc-by-sa)
Funders
  • U.S. Department of Health and Human Services (R01 GM134148, R01DK129466, P30 DK045735, R01 GM151829)
  • Yale University
  • Blavatnik Family Foundation
  • Agence Nationale de la Recherche
  • Fondation pour la Recherche Médicale (AJE202210016216)
  • Fondation ARC pour la Recherche sur le Cancer
  • National Institutes of Health (DK045735)
  • National Institute of General Medical Sciences (R01GM134148, R01GM151829)
  • National Institute of Diabetes and Digestive and Kidney Diseases (P30DK045735, R01DK129466)
Topics
  • Life Sciences › Biochemistry, Genetics and Molecular Biology › Cell Biology › Cellular transport and secretion
  • Life Sciences › Biochemistry, Genetics and Molecular Biology › Cell Biology › Autophagy in Disease and Therapy
  • Life Sciences › Biochemistry, Genetics and Molecular Biology › Cell Biology › Endoplasmic Reticulum Stress and Disease
Keywords
ASPSCR1, ERGIC, early secretory pathway, intrinsically disordered regions, biomolecular condensates, protein oligomerization, Golgi morphology, cis-Golgi, autophagy, collagen secretion, GLUT4 trafficking, membrane trafficking
MeSH terms
Animals, Autophagy, Collagen, Endoplasmic Reticulum, Golgi Apparatus, Humans, Cystic Fibrosis Transmembrane Conductance Regulator, Protein Transport, COP-Coated Vesicles, Mice, Secretory Pathway

About these checks

Registry, retraction, Cites and statistics results are computed, not judged, with one exception: a printed reference that no index lists is read once by a model before it counts as a citation error. Claims are extracted by a model and kept only when their quote appears verbatim in the text; each cited source is then checked, with a model’s help, for whether it says what the claim relies on. Those verdicts can be wrong — read the claim’s quote and the cited source before relying on one.

Statistics and arithmetic are recomputed, not judged.

Confidence bands are shown only for fields calibrated on our annotated test set. None is calibrated yet, so no band is shown.

What counts as a claim ›How we measure confidence ›How we check this ›

Are you an author, or do you see a problem with this page? Request a review