Student or educator? Sign up with your school email and get 6 months of Pro free.
PreprintCited by 1Animal Virus Infections StudiesRNA Research and SplicingProtein Structure and Dynamics

The DOI matches its Crossref record; 1 of the 1 references it cites were found in a registry or an index.

The C terminus of infectious bursal disease virus (IBDV) VP3 encodes a predicted intrinsically disordered region (IDR), which promotes the formation of cytoplasmic puncta and modulates their physical properties

Open access

Preprint — published as 10.1128/mbio.03107-25

Abstract

The virus factories (VFs) of infectious bursal disease virus (IBDV) form through liquid-liquid phase separation (LLPS). A major component of the IBDV VF is the nonstructural protein VP3. Here, we predicted the full-length structure of the VP3 monomer and homodimer and employed molecular dynamics simulations to characterize their behavior. We identified the 36 amino acid carboxy(C)-terminus as a highly dynamic intrinsically disordered region (IDR). We then compared the cytoplasmic puncta that were made in the presence of the wild type (wt) VP3 with those made with a VP3 that lacked the C-terminus (VP3ΔC). Using live-cell imaging with fluorescent reporter tagged proteins, we found that VP3ΔC puncta were significantly less numerous (p<0.0001), smaller (p<0.0001), and more irregular in shape than puncta formed in the presence of wt VP3, demonstrating that the VP3 C terminal IDR promoted their formation. Moreover, by fluorescence recovery after photobleaching (FRAP), the VP3ΔC puncta had a significantly reduced mobile fraction (0.29) as compared to full-length VP3 puncta (0.70) (p<0.001), demonstrating that the VP3 C terminal IDR modulated their physical properties. However, the VP3ΔC puncta still exhibited liquid-like fusion events in the cytoplasm and were sensitive to treatment with aliphatic diols. Moreover, VP3 did not form puncta when expressed alone, and the removal of the C terminus did not abolish puncta formation completely. We propose that VP3 forms part of a higher order complex with other biomolecules to drive LLPS, and that the VP3 C terminal IDR modulates the physical properties of the resultant LLPS structures. Importance: LLPS is a phenomenon of growing interest in cell biology. It is a part of the replication cycles of diverse viruses, but our understanding of the molecular basis that underpins the mechanism of phase separation is incomplete. We previously demonstrated that the birnavirus IBDV, a major agricultural pathogen, exploits LLPS in the formation of its VFs. Here, we have characterized the C-terminal 36 amino acid region of IBDV VP3 bioinformatically and by molecular dynamics simulations and found that it encodes a highly dynamic intrinsically disordered region (IDR). Furthermore, we found this region to promote the formation of cytoplasmic puncta and modulate their physical properties. This work contributes to a more detailed understanding of birnavirus replication at the molecular level, and to the study of LLPS as a phenomenon.

Overview

The claims and statistics of this paper haven’t been checked yet.

Run the check — free, no account needed. It reads the open-access text and checks the sources it cites.

A few free checks a day · papers already verified open instantly · results are public

Integrity signals

Registry

Crossref · 10.1101/2025.01.17.633518

Cites

1 of 1 references verified0 citation errors · 0 not checkable

Statistics

Figures

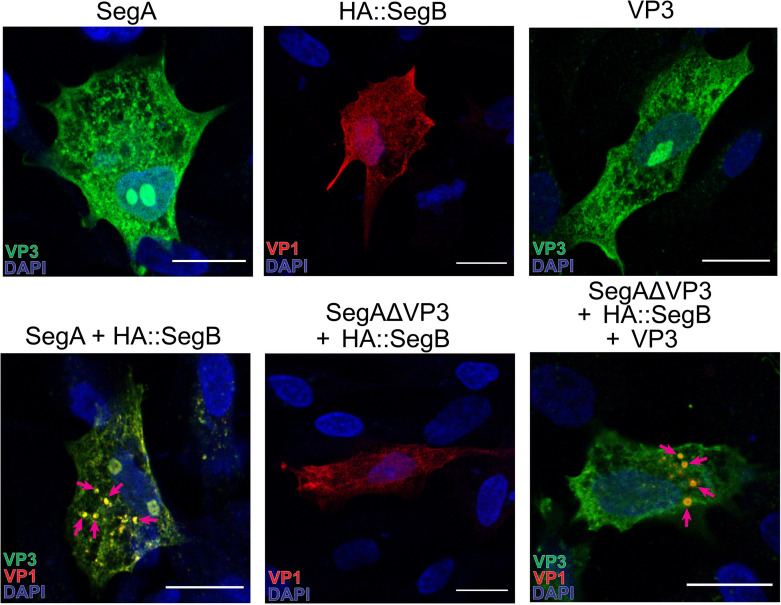
Fig 1 VP3 is necessary, but not sufficient, for the formation of IBDV cytoplasmic puncta. DF-1 cells were transfected with Segment A (SegA), HA::Segment B (HA::SegB), VP3 alone, or SegA + HA::SegB, SegAΔVP3 + HA::SegB, or SegAΔVP3 + HA::SegB + VP3 (A). Cells were fixed at 34 hpt and stained with DAPI (blue) and antibodies against VP3 (green) or HA (red). Mosaic images were acquired with the Leica Stellaris 8 scanning confocal microscope. Arrows denote puncta; scale bars, 50 µm.
Fig 1 VP3 is necessary, but not sufficient, for the formation of IBDV cytoplasmic puncta. DF-1 cells were transfected with Segment A (SegA), HA::Segment B (HA::SegB), VP3 alone, or SegA + HA::SegB, SegAΔVP3 + HA::SegB, or SegAΔVP3 + HA::SegB + VP3 (A). Cells were fixed at 34 hpt and stained with DAPI (blue) and antibodies against VP3 (green) or HA (red). Mosaic images were acquired with the Leica Stellaris 8 scanning confocal microscope. Arrows denote puncta; scale bars, 50 µm.CC BY · PubMed Central
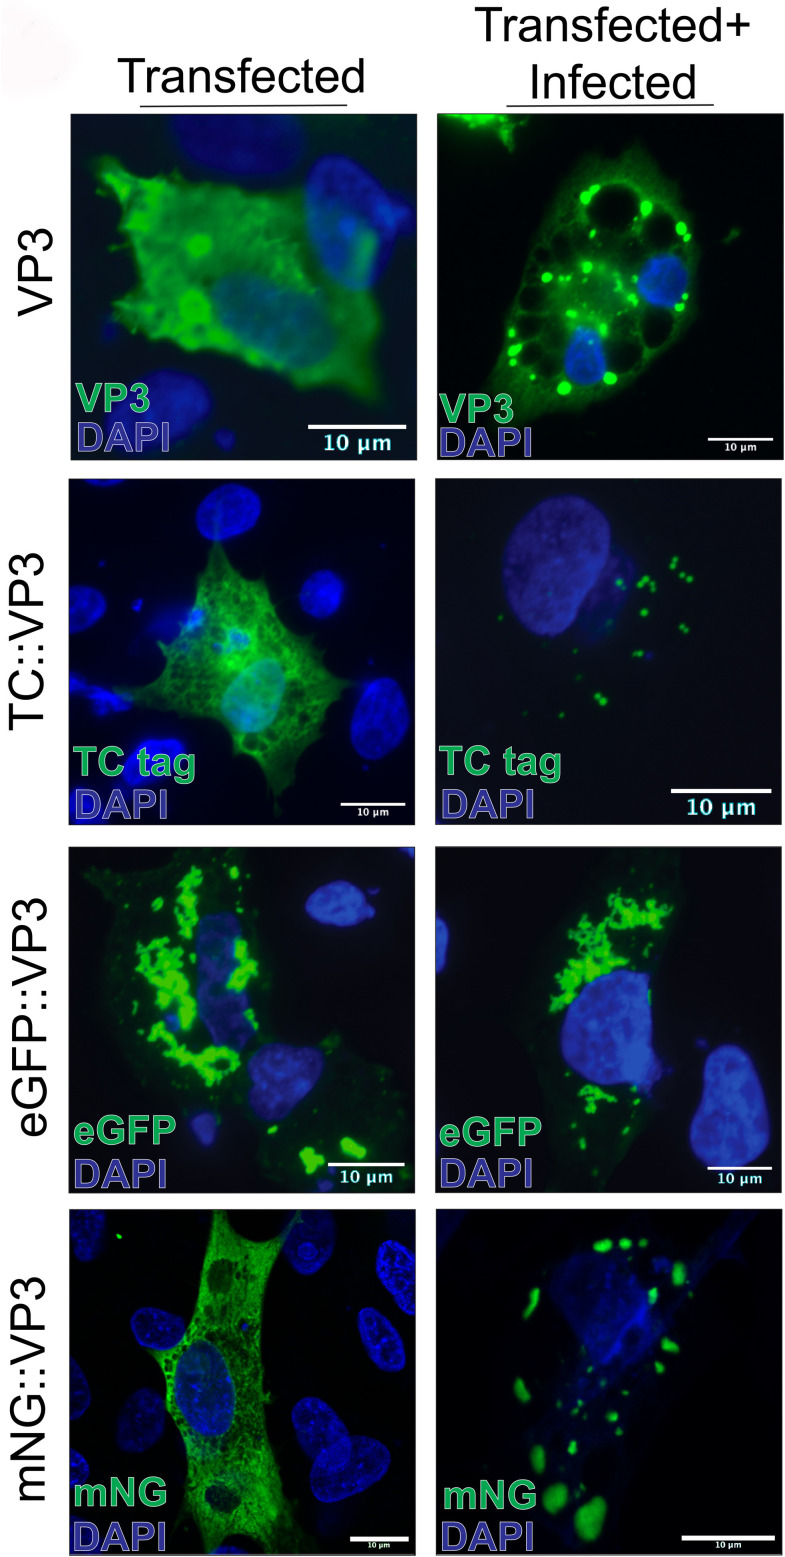
Fig 2 Evaluating the expression of VP3 fused to different tags. DF-1 cells were transfected with a vector expressing VP3, or reporter-conjugated VP3 constructs (TC::VP3, eGFP::VP3, and mNG::VP3). Cells were imaged by confocal microscopy at 18 hpt, either alone (left column) or in cells simultaneously transfected with reporter::VP3 conjugates and infected with strain PBG98 IBDV (multiplicity of infection [MOI] = 5). Scale bars, 10 µm.
Fig 2 Evaluating the expression of VP3 fused to different tags. DF-1 cells were transfected with a vector expressing VP3, or reporter-conjugated VP3 constructs (TC::VP3, eGFP::VP3, and mNG::VP3). Cells were imaged by confocal microscopy at 18 hpt, either alone (left column) or in cells simultaneously transfected with reporter::VP3 conjugates and infected with strain PBG98 IBDV (multiplicity of infection [MOI] = 5). Scale bars, 10 µm.CC BY · PubMed Central
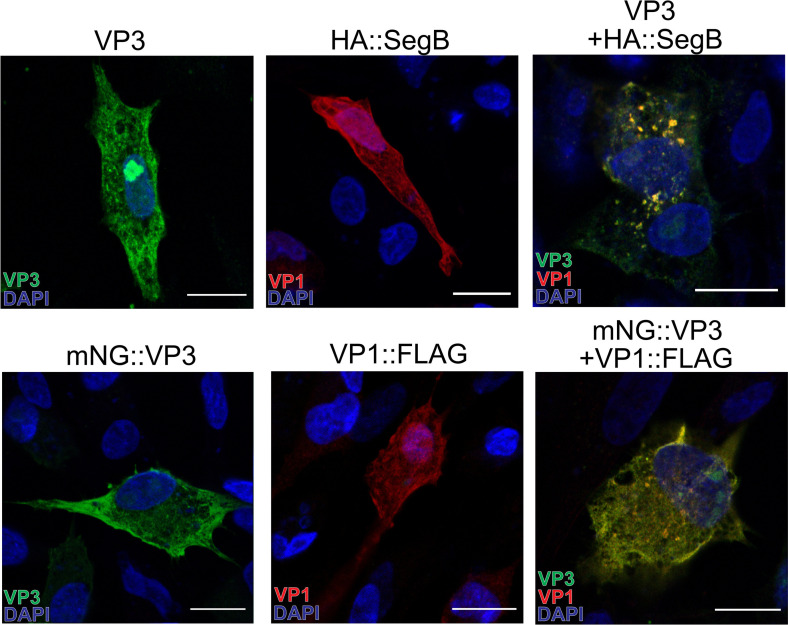
Fig 3 The minimal components of IBDV cytoplasmic puncta are VP3 and VP1. DF-1 cells were transfected with mNG::VP3, VP1::FLAG, VP3, HA::Segment B (HA::SegB) or a mixture of VP3 + HA::SegB (A). Cells were fixed at 34 hpt, and the nuclei were stained with DAPI (blue). mNG is shown in green, Segment B (visualized by staining with anti-HA monoclonal antibody) and VP1 (visualized by staining with anti-FLAG monoclonal antibody) are shown in red. Mosaic images were acquired with the Leica Stellaris 8 scanning confocal microscope. Scale bars, 50 µm.
Fig 3 The minimal components of IBDV cytoplasmic puncta are VP3 and VP1. DF-1 cells were transfected with mNG::VP3, VP1::FLAG, VP3, HA::Segment B (HA::SegB) or a mixture of VP3 + HA::SegB (A). Cells were fixed at 34 hpt, and the nuclei were stained with DAPI (blue). mNG is shown in green, Segment B (visualized by staining with anti-HA monoclonal antibody) and VP1 (visualized by staining with anti-FLAG monoclonal antibody) are shown in red. Mosaic images were acquired with the Leica Stellaris 8 scanning confocal microscope. Scale bars, 50 µm.CC BY · PubMed Central
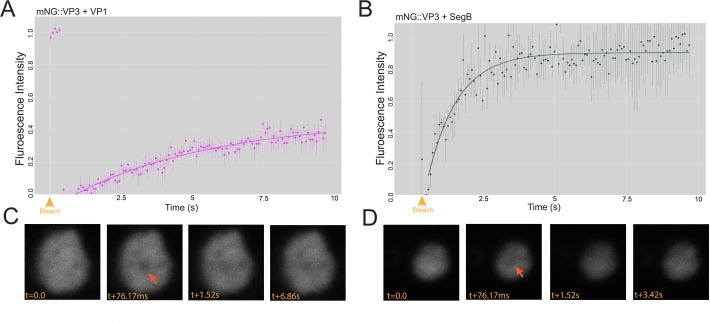
Fig 4 The minimal components of IBDV phase-separated biomolecular condensates are VP3, VP1, and RNA. DF-1 cells were co-transfected with a mixture of mNG::VP3 and VP1::FLAG, and a time-lapse series was captured by live confocal microscopy at 34 hpt with a single iteration of point bleaching on the 5th frame (yellow arrowhead). Intensity data were extracted and used to calculate a FRAP recovery curve. Results are from three replicates; error bars = SEM (A). DF-1 cells were co-transfected with a mixture of mNG::VP3 and SegB, and a FRAP recovery curve was generated in the same way (B). Representative recovery images for a photobleached puncta formed in the presence of VP1::FLAG with the time post-bleach (t) shown in milliseconds (ms) (C). Representative recovery images for a photobleached puncta formed in the presence of SegB with the t post-bleach shown in s (D).
Fig 4 The minimal components of IBDV phase-separated biomolecular condensates are VP3, VP1, and RNA. DF-1 cells were co-transfected with a mixture of mNG::VP3 and VP1::FLAG, and a time-lapse series was captured by live confocal microscopy at 34 hpt with a single iteration of point bleaching on the 5th frame (yellow arrowhead). Intensity data were extracted and used to calculate a FRAP recovery curve. Results are from three replicates; error bars = SEM (A). DF-1 cells were co-transfected with a mixture of mNG::VP3 and SegB, and a FRAP recovery curve was generated in the same way (B). Representative recovery images for a photobleached puncta formed in the presence of VP1::FLAG with the time post-bleach (t) shown in milliseconds (ms) (C). Representative recovery images for a photobleached puncta formed in the presence of SegB with the t post-bleach shown in s (D).CC BY · PubMed Central
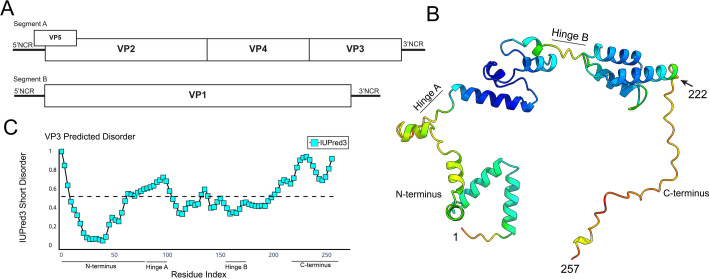
Fig 5 VP3 encodes a C-terminal domain with a predicted lack of secondary structure. A schematic of the IBDV genome architecture depicting Segment A encoding VP3 at the 3′ end of the coding strand, upstream of the 3′ non-coding region (NCR) and downstream of VP4 (A). A predicted structure for VP3, generated by AlphaFold2, visualized with UCSF ChimeraX, and colored by positional confidence (red indicates lower confidence; blue indicates higher confidence). The N-terminus, C-terminus, and hinge regions are labeled (B). A disorder plot of the VP3 from IBDV strain PBG98, with IUPred3 short disorder plotted on the y-axis against VP3 amino acid residue number on the x-axis. The horizontal dashed line represents an IUPred3 Short Disorder of 0.5 and the N-terminus, C-terminus, and hinge regions of VP3 are labeled (C).
Fig 5 VP3 encodes a C-terminal domain with a predicted lack of secondary structure. A schematic of the IBDV genome architecture depicting Segment A encoding VP3 at the 3′ end of the coding strand, upstream of the 3′ non-coding region (NCR) and downstream of VP4 (A). A predicted structure for VP3, generated by AlphaFold2, visualized with UCSF ChimeraX, and colored by positional confidence (red indicates lower confidence; blue indicates higher confidence). The N-terminus, C-terminus, and hinge regions are labeled (B). A disorder plot of the VP3 from IBDV strain PBG98, with IUPred3 short disorder plotted on the y-axis against VP3 amino acid residue number on the x-axis. The horizontal dashed line represents an IUPred3 Short Disorder of 0.5 and the N-terminus, C-terminus, and hinge regions of VP3 are labeled (C).CC BY · PubMed Central
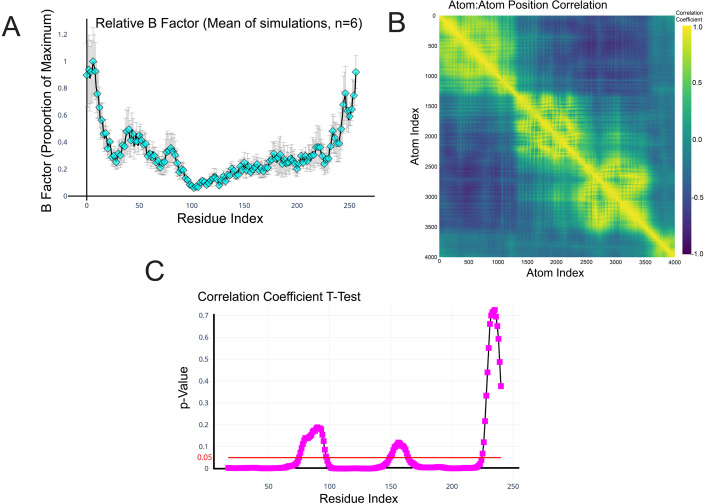
Fig 6 The VP3 C-terminal domain is predicted to be a highly dynamic IDR. The mean relative B-factor, calculated from MD simulations of the VP3 monomer (6 independent 20 nanosecond simulations), was plotted on the y-axis against VP3 amino acid residue number on the x-axis. Error bars represent the standard error of the mean (SEM) (A). Pearson’s product moment correlation coefficient between the trajectories of each pair of atoms was calculated and plotted as a heatmap. Yellow represents perfect positive correlation, purple represents perfect negative correlation, and blue/teal suggests a lack of correlation (B). The movement of the atoms (average positional correlation coefficient) within the 36 amino acids of the C-terminus was compared to equally sized windows of 36 amino acids in length spanning the whole length of the VP3 protein sequence, and the P-values were plotted on the y-axis against the VP3 amino acid residue number on the x-axis. Regions of the VP3 region that were significantly more ordered than the C-terminus had a P value below the 0.05 cutoff (red line) (C).
Fig 6 The VP3 C-terminal domain is predicted to be a highly dynamic IDR. The mean relative B-factor, calculated from MD simulations of the VP3 monomer (6 independent 20 nanosecond simulations), was plotted on the y-axis against VP3 amino acid residue number on the x-axis. Error bars represent the standard error of the mean (SEM) (A). Pearson’s product moment correlation coefficient between the trajectories of each pair of atoms was calculated and plotted as a heatmap. Yellow represents perfect positive correlation, purple represents perfect negative correlation, and blue/teal suggests a lack of correlation (B). The movement of the atoms (average positional correlation coefficient) within the 36 amino acids of the C-terminus was compared to equally sized windows of 36 amino acids in length spanning the whole length of the VP3 protein sequence, and the P-values were plotted on the y-axis against the VP3 amino acid residue number on the x-axis. Regions of the VP3 region that were significantly more ordered than the C-terminus had a P value below the 0.05 cutoff (red line) (C).CC BY · PubMed Central
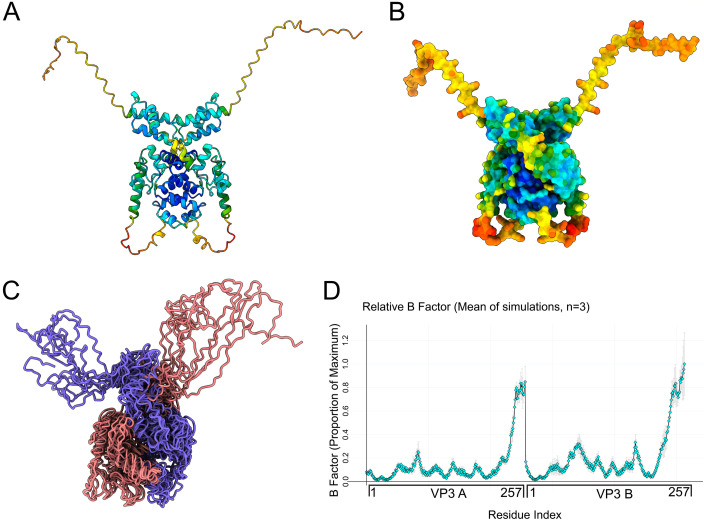
Fig 7 IBDV VP3 can exist as a homodimer with two C-terminal dynamic IDRs extending from the core. A cartoon rendering of the VP3 homodimer as predicted by AlphaFold3, visualized in UCSF ChimeraX, and colored by positional confidence (red indicates lower confidence; blue indicates higher confidence) (A). A solvent-accessible surface of the VP3 homodimer, visualized by UCSF ChimeraX, and colored by positional confidence (red indicates lower confidence; blue indicates higher confidence) (B). An ensemble of structures representing 10 evenly spaced timepoints of a single 20 nanosecond MD simulation. Structures were extracted from the trajectory and rendered as an ensemble in UCSF ChimeraX without alignment, colored by monomer (one monomer in purple, the other in pink) (C). The mean relative B-factor was calculated from the MD simulations of the VP3 homodimer (6 independent 20 nanosecond simulations) and plotted on the y-axis against the amino acid residue number of two VP3 monomers (A and B) concatenated on the x-axis. Error bars represent SEM (D).
Fig 7 IBDV VP3 can exist as a homodimer with two C-terminal dynamic IDRs extending from the core. A cartoon rendering of the VP3 homodimer as predicted by AlphaFold3, visualized in UCSF ChimeraX, and colored by positional confidence (red indicates lower confidence; blue indicates higher confidence) (A). A solvent-accessible surface of the VP3 homodimer, visualized by UCSF ChimeraX, and colored by positional confidence (red indicates lower confidence; blue indicates higher confidence) (B). An ensemble of structures representing 10 evenly spaced timepoints of a single 20 nanosecond MD simulation. Structures were extracted from the trajectory and rendered as an ensemble in UCSF ChimeraX without alignment, colored by monomer (one monomer in purple, the other in pink) (C). The mean relative B-factor was calculated from the MD simulations of the VP3 homodimer (6 independent 20 nanosecond simulations) and plotted on the y-axis against the amino acid residue number of two VP3 monomers (A and B) concatenated on the x-axis. Error bars represent SEM (D).CC BY · PubMed Central
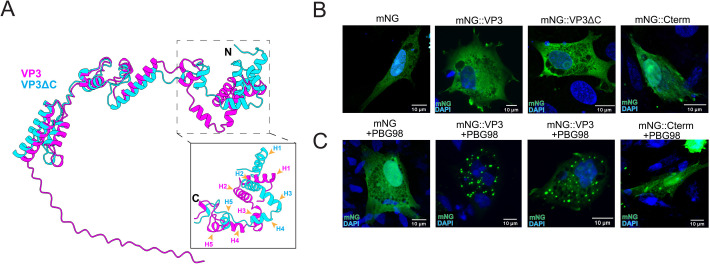
Fig 8 The C-terminal IDR is not required for the recruitment of IBDV VP3 into VFs. AlphaFold3 predictions for the wt VP3 (magenta) and the VP3ΔC (cyan) were aligned with ChimeraX and overlaid (N terminal helices numbered H1–5) (A). DF-1 cells were transfected with mNG, mNG::VP3, mNG::VP3ΔC, or mNG::Cterm (B) or were co-transfected with the plasmids and simultaneously infected with IBDV strain PBG98 (MOI 5) (C). Cells were fixed at 12 hpi, and the nuclei were stained with DAPI (blue), and the mNG signal is shown in green. Scale bars, 10 µm.
Fig 8 The C-terminal IDR is not required for the recruitment of IBDV VP3 into VFs. AlphaFold3 predictions for the wt VP3 (magenta) and the VP3ΔC (cyan) were aligned with ChimeraX and overlaid (N terminal helices numbered H1–5) (A). DF-1 cells were transfected with mNG, mNG::VP3, mNG::VP3ΔC, or mNG::Cterm (B) or were co-transfected with the plasmids and simultaneously infected with IBDV strain PBG98 (MOI 5) (C). Cells were fixed at 12 hpi, and the nuclei were stained with DAPI (blue), and the mNG signal is shown in green. Scale bars, 10 µm.CC BY · PubMed Central
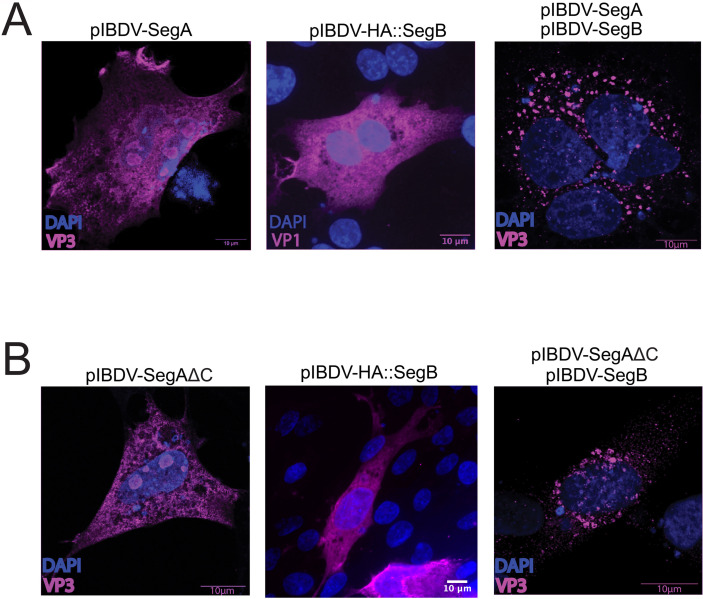
Fig 9 The IBDV VP3 C-terminal IDR is not required for the formation of cytoplasmic puncta. DF-1 cells were either transfected with SegA or HA::SegB and fixed and stained with anti-VP3 or anti-HA antibodies at 18 hpt, or DF-1 cells were simultaneously transfected with both SegA and SegB and fixed and stained with an anti-VP3 antibody at 18 hpt (A). DF-1 cells were either transfected with SegAΔC or HA::SegB, and were fixed and stained with anti-VP3 or anti-HA antibodies at 18 hpt, or DF-1 cells were simultaneously transfected with both SegAΔC and SegB, and fixed and stained with an anti-VP3 antibody at 18 hpt. The nuclei were stained with DAPI (blue), and the VP3 or HA-VP1 signals are shown in magenta. Scale bars, 10 µm (B).
Fig 9 The IBDV VP3 C-terminal IDR is not required for the formation of cytoplasmic puncta. DF-1 cells were either transfected with SegA or HA::SegB and fixed and stained with anti-VP3 or anti-HA antibodies at 18 hpt, or DF-1 cells were simultaneously transfected with both SegA and SegB and fixed and stained with an anti-VP3 antibody at 18 hpt (A). DF-1 cells were either transfected with SegAΔC or HA::SegB, and were fixed and stained with anti-VP3 or anti-HA antibodies at 18 hpt, or DF-1 cells were simultaneously transfected with both SegAΔC and SegB, and fixed and stained with an anti-VP3 antibody at 18 hpt. The nuclei were stained with DAPI (blue), and the VP3 or HA-VP1 signals are shown in magenta. Scale bars, 10 µm (B).CC BY · PubMed Central
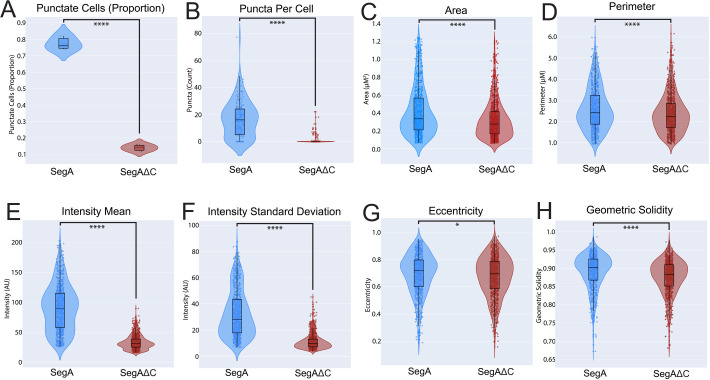
Fig 10 The IBDV VP3 C-terminal IDR promotes the formation of cytoplasmic puncta and influences their size and morphology. DF-1 cells were co-transfected with either SegA and SegB::mNG or SegAΔC and SegB::mNG. From each of 3 replicates, 50 cells were randomly selected at 34 hpt, and their phenotype (punctate or non-punctate) was classified (A), and the puncta per cell were counted (B). Fifty cells prepared in the same manner were then imaged individually by confocal microscopy, and puncta were segmented by watershed segmentation and the area, perimeter, mean fluorescence intensity, intensity standard deviation, eccentricity, and geometric solidity (a measure of morphological “roundness” or “smoothness”) were measured with the Scikit-image python module (C–H).
Fig 10 The IBDV VP3 C-terminal IDR promotes the formation of cytoplasmic puncta and influences their size and morphology. DF-1 cells were co-transfected with either SegA and SegB::mNG or SegAΔC and SegB::mNG. From each of 3 replicates, 50 cells were randomly selected at 34 hpt, and their phenotype (punctate or non-punctate) was classified (A), and the puncta per cell were counted (B). Fifty cells prepared in the same manner were then imaged individually by confocal microscopy, and puncta were segmented by watershed segmentation and the area, perimeter, mean fluorescence intensity, intensity standard deviation, eccentricity, and geometric solidity (a measure of morphological “roundness” or “smoothness”) were measured with the Scikit-image python module (C–H).CC BY · PubMed Central
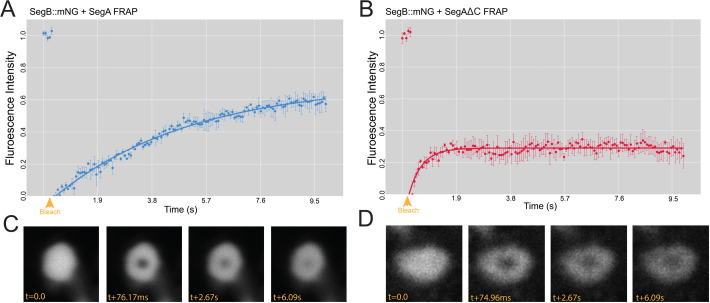
Fig 11 The VP3 C-terminal IDR significantly contributes to the mobile fraction of the molecules within the cytoplasmic puncta. DF-1 cells were co-transfected with a mixture of SegA and SegB::mNG, and a time-lapse series was captured by live confocal microscopy at 14 hpt with a single iteration of point bleaching on the 5th frame (yellow arrowhead). Intensity data were extracted and used to calculate a FRAP recovery curve. Results are from three replicates; error bars = SEM (A). DF-1 cells were co-transfected with a mixture of SegAΔC and SegB::mNG, and a FRAP recovery curve was generated in the same way (B). Representative recovery images for a photobleached puncta formed in the presence of SegA with the time post-bleach (t) shown in milliseconds (ms) (C). Representative recovery images for a photobleached puncta formed in the presence of SegAΔC with the t post-bleach shown in ms (D).
Fig 11 The VP3 C-terminal IDR significantly contributes to the mobile fraction of the molecules within the cytoplasmic puncta. DF-1 cells were co-transfected with a mixture of SegA and SegB::mNG, and a time-lapse series was captured by live confocal microscopy at 14 hpt with a single iteration of point bleaching on the 5th frame (yellow arrowhead). Intensity data were extracted and used to calculate a FRAP recovery curve. Results are from three replicates; error bars = SEM (A). DF-1 cells were co-transfected with a mixture of SegAΔC and SegB::mNG, and a FRAP recovery curve was generated in the same way (B). Representative recovery images for a photobleached puncta formed in the presence of SegA with the time post-bleach (t) shown in milliseconds (ms) (C). Representative recovery images for a photobleached puncta formed in the presence of SegAΔC with the t post-bleach shown in ms (D).CC BY · PubMed Central
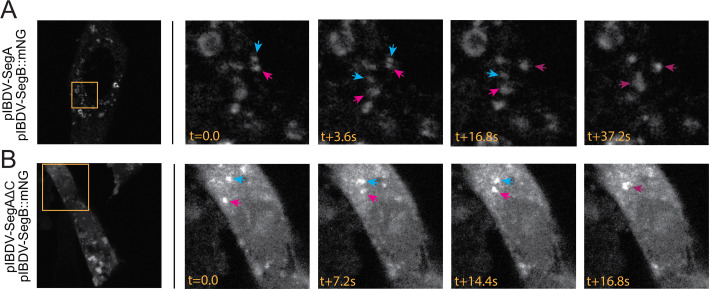
Fig 12 Puncta formed in the presence or absence of the VP3 C-terminal IDR are dynamic. DF-1 cells were transfected with a mixture of SegA and SegB::mNG (A), or DF-1 cells were transfected with a mixture of SegAΔC and SegB::mNG (B). At 34 hpt, cells were imaged by live-cell confocal microscopy, capturing images every five frames to make a time lapse. Still frames from the timelapses are shown. The leftmost images show whole-cell images (mNG signal shown in white), with stills from the inset regions (orange boxed regions) shown thereafter. The timestamp (t) of imaging is shown in seconds (s). Arrows show individual puncta that undergo fusion.
Fig 12 Puncta formed in the presence or absence of the VP3 C-terminal IDR are dynamic. DF-1 cells were transfected with a mixture of SegA and SegB::mNG (A), or DF-1 cells were transfected with a mixture of SegAΔC and SegB::mNG (B). At 34 hpt, cells were imaged by live-cell confocal microscopy, capturing images every five frames to make a time lapse. Still frames from the timelapses are shown. The leftmost images show whole-cell images (mNG signal shown in white), with stills from the inset regions (orange boxed regions) shown thereafter. The timestamp (t) of imaging is shown in seconds (s). Arrows show individual puncta that undergo fusion.CC BY · PubMed Central
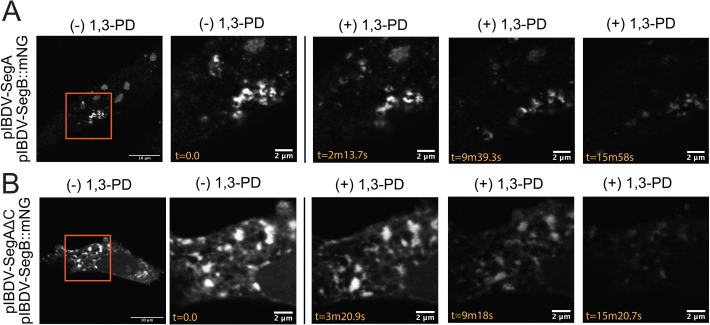
Fig 13 Puncta formed in the presence or absence of the VP3 C-terminal IDR are sensitive to aliphatic diol treatment. DF-1 cells were transfected with a mixture of SegA and SegB::mNG (A), or DF-1 cells were transfected with a mixture of SegAΔC and SegB::mNG (B). Transfected cells were treated with 1,3-Propanediol (1,3-PD) while capturing time-lapse images. Briefly, cells were initially maintained in media for acquisition, and at time (t) = 0 seconds (s), 1,3-PD was added to achieve a final concentration of 4% (vol/vol). The leftmost images show whole cells (mNG signal shown in white), with stills from the inset regions (orange boxed regions) shown thereafter. The timestamp (t) of imaging is shown in seconds (s).
Fig 13 Puncta formed in the presence or absence of the VP3 C-terminal IDR are sensitive to aliphatic diol treatment. DF-1 cells were transfected with a mixture of SegA and SegB::mNG (A), or DF-1 cells were transfected with a mixture of SegAΔC and SegB::mNG (B). Transfected cells were treated with 1,3-Propanediol (1,3-PD) while capturing time-lapse images. Briefly, cells were initially maintained in media for acquisition, and at time (t) = 0 seconds (s), 1,3-PD was added to achieve a final concentration of 4% (vol/vol). The leftmost images show whole cells (mNG signal shown in white), with stills from the inset regions (orange boxed regions) shown thereafter. The timestamp (t) of imaging is shown in seconds (s).CC BY · PubMed Central
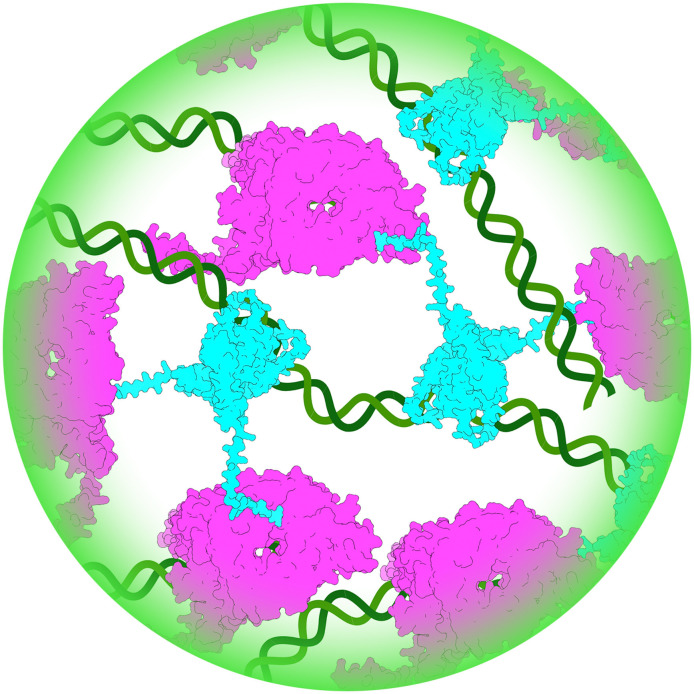
Fig 14 Schematic of the model for how VP1, VP3, and vRNA interact in a phase-separated biomolecular condensate. VP3 (blue) interacts with RNA (green) via the core domain, and with VP1 (magenta) via the C-terminus. Interaction of VP3 with VP1 increases the synthesis of dsRNA by the polymerase, which contributes to the growing condensate.
Fig 14 Schematic of the model for how VP1, VP3, and vRNA interact in a phase-separated biomolecular condensate. VP3 (blue) interacts with RNA (green) via the core domain, and with VP1 (magenta) via the C-terminus. Interaction of VP3 with VP1 increases the synthesis of dsRNA by the polymerase, which contributes to the growing condensate.CC BY · PubMed Central

Verification

Claims the paper makes

The claims and statistics of this paper haven’t been checked yet.

Run the check — free, no account needed. It reads the open-access text and checks the sources it cites.

A few free checks a day · papers already verified open instantly · results are public

Self-check

Percentages, sums and reported differences re-computed from the paper’s own numbers.

The self-check needs the paper’s full text.

Citations

Cites

Research works printed but not linked: 36

  1. Brodrick AJ , Broadbent AJ . 2023. The Formation and Function of Birnaviridae Virus Factories. Int J Mol Sci 24. · DOI
  2. 10.1038/s41467-020-19843-1 · DOI · Paper page
  3. Hidalgo P , Pimentel A , Mojica-Santamaria D , von Stromberg K , Hofmann-Sieber H , Lona-Arrona C , Dobner T , Gonzalez RA . 2021. Evidence That the Adenovirus Single-Stranded DNA Binding Protein Mediates the Assembly of Biomolecular Condensates to Form Viral Replication Compartments. Viruses 13. · DOI
  4. 10.1038/s41467-017-00102-9 · DOI
  5. 10.1080/22221751.2023.2223727 · DOI
  6. Guseva S , Milles S , Jensen MR , Salvi N , Kleman JP , Maurin D , Ruigrok RWH , Blackledge M . 2020. Measles virus nucleo- and phosphoproteins form liquid-like phase-separated compartments that promote nucleocapsid assembly. Sci Adv 6:eaaz7095. · DOI
  7. 10.1038/s41467-019-09549-4 · DOI
  8. 10.1016/bs.aivir.2023.06.002 · DOI
  9. 10.15252/embj.2021107711 · DOI · Paper page
  10. 10.1128/jvi.02024-21 · DOI
  11. 10.1038/nrm.2017.7 · DOI
  12. 10.1016/j.cell.2016.05.026 · DOI · Paper page
  13. 10.1016/bs.mie.2018.09.035 · DOI
  14. 10.1016/j.sbi.2017.12.007 · DOI
  15. Barkley RJR , Crowley JC , Brodrick AJ , Zipfel WR , Parker JSL . 2024. Fluorescent protein tags affect the condensation properties of a phase-separating viral protein. Mol Biol Cell 35:ar100. · DOI
  16. 10.1016/j.jmb.2011.08.008 · DOI
  17. 10.1128/jvi.00039-23 · DOI
  18. 10.1371/journal.pone.0087790 · DOI
  19. Gimenez MC , Issa M , Sheth J , Colombo MI , Terebiznik MR , Delgui LR . 2021. Phosphatidylinositol 3-Phosphate Mediates the Establishment of Infectious Bursal Disease Virus Replication Complexes in Association with Early Endosomes. J Virol 95. · DOI
  20. 10.1016/j.str.2007.10.023 · DOI
  21. 10.1093/nar/gkab408 · DOI · Paper page
  22. Pritisanac I , Vernon RM , Moses AM , Forman Kay JD . 2019. Entropy and Information within Intrinsically Disordered Protein Regions. Entropy (Basel) 21. · DOI
  23. 10.1073/pnas.0408930102 · DOI · Paper page
  24. Ferrero DS , Gimenez MC , Sagar A , Rodriguez JM , Caston JR , Terebiznik MR , Bernado P , Verdaguer N . 2024. Structure of the aminoterminal domain of the birnaviral multifunctional VP3 protein and its unexplored critical role. PNAS Nexus 3:pgae521. · DOI
  25. Yang H , Wang Y , Ye C . 2020. Rapid Generation of Attenuated Infectious Bursal Disease Virus from Dual-Promoter Plasmids by Reduction of Viral Ribonucleoprotein Activity. J Virol 94. · DOI
  26. 10.1038/nmeth.2413 · DOI · Paper page
  27. Nazki S, Asfor A, Broadbent AJ, 2023, An Infectious Bursal Disease Virus (IBDV) Reverse Genetics Rescue System and Neutralization Assay in Chicken B Cells. Curr Protoc, 3, e639
  28. 10.1016/j.cell.2018.12.035 · DOI · Paper page
  29. 10.1093/nar/gky508 · DOI
  30. Campbell EA , Reddy V , Gray AG , Wells J , Simpson J , Skinner MA , Hawes PC , Broadbent AJ . 2020. Discrete Virus Factories Form in the Cytoplasm of Cells Coinfected with Two Replication-Competent Tagged Reporter Birnaviruses That Subsequently Coalesce over Time. J Virol 94. · DOI
  31. 10.1038/nature10879 · DOI
  32. 10.1128/JVI.76.22.11301-11311.2002 · DOI
  33. 10.1002/PRO.4792 · DOI · Paper page
  34. 10.1006/viro.1998.9290 · DOI · Paper page
  35. Reed LJ , Muench H . 1938. A simple method of estimating fifty per cent endpoints. · DOI · Paper page
  36. 10.1038/s41592-019-0686-2 · DOI · Paper page

Metadata

Authors
Brodrick, A. J., & Broadbent, A. J.
Affiliations
University of Maryland, College Park (US)
Corresponding author
Broadbent, A. J.
Venue
mBio
Publisher
openRxiv
Published
2025-01-18
Volume
17
Issue
2
Pages
e0310725-e0310725
ISSN
2150-7511 (ISSN-L)
OpenAlex
W7122837825
Cited by
1
References
1
Citations by year
2026: 1
FWCI
3.87
Type
journal article
Language
en
Open access
Locations
  • mBio (publishedVersion, cc-by)
  • bioRxiv (Cold Spring Harbor Laboratory) (acceptedVersion, cc-by-nc-nd)
  • Europe PMC (PubMed Central) (publishedVersion, cc-by)
  • PubMed (publishedVersion)
  • PubMed Central (publishedVersion, cc-by)
  • DOAJ (DOAJ: Directory of Open Access Journals) (submittedVersion, cc-by-sa)
Funders
National Institutes of Health (1s10od034260-01, 1s10od025223-01a1)
Topics
  • Life Sciences › Agricultural and Biological Sciences › Animal Science and Zoology › Animal Virus Infections Studies
  • Life Sciences › Biochemistry, Genetics and Molecular Biology › Molecular Biology › RNA Research and Splicing
  • Life Sciences › Biochemistry, Genetics and Molecular Biology › Molecular Biology › Protein Structure and Dynamics
Keywords
infectious bursal disease virus, VP3, intrinsically disordered regions, liquid-liquid phase separation, biomolecular condensates, virus factories, VP1, viral RNA, viral replication, birnavirus, molecular dynamics simulation, FRAP, live-cell imaging, protein-protein interaction
MeSH terms
Biomolecular Condensates, Phase Separation, Animals, Cell Line, Cytoplasm, Infectious bursal disease virus, RNA, Viral, Virus Replication, Viral Structural Proteins, Viral Nonstructural Proteins, Molecular Dynamics Simulation, Intrinsically Disordered Proteins

About these checks

Registry, retraction, Cites and statistics results are computed, not judged, with one exception: a printed reference that no index lists is read once by a model before it counts as a citation error. Claims are extracted by a model and kept only when their quote appears verbatim in the text; each cited source is then checked, with a model’s help, for whether it says what the claim relies on. Those verdicts can be wrong — read the claim’s quote and the cited source before relying on one.

Statistics and arithmetic are recomputed, not judged.

Confidence bands are shown only for fields calibrated on our annotated test set. None is calibrated yet, so no band is shown.

What counts as a claim ›How we measure confidence ›How we check this ›

Are you an author, or do you see a problem with this page? Request a review

Data sources

Bibliographic data: Semantic Scholar, OpenAlex, Crossref.

Contains information from the Semantic Scholar Academic Graph Datasets, made available under the ODC Attribution License (ODC-BY 1.0).

Semantic Scholar’s data is described in: Kinney, R., et al. (2023). The Semantic Scholar Open Data Platform. arXiv:2301.10140.