

The DOI matches its Crossref record; 1 of the 1 references it cites were found in a registry or an index.
Predicting gene expression using millions of yeast promoters reveals cis -regulatory logic
Open accessPreprint — published as 10.1093/bioadv/vbaf130 · Paper page
Abstract
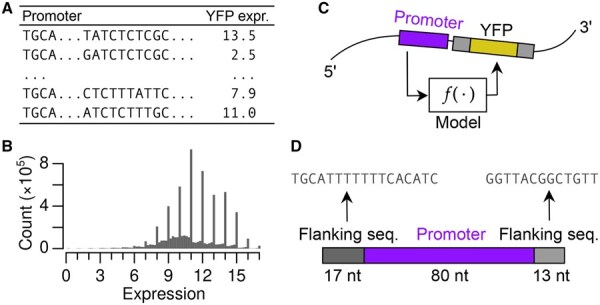
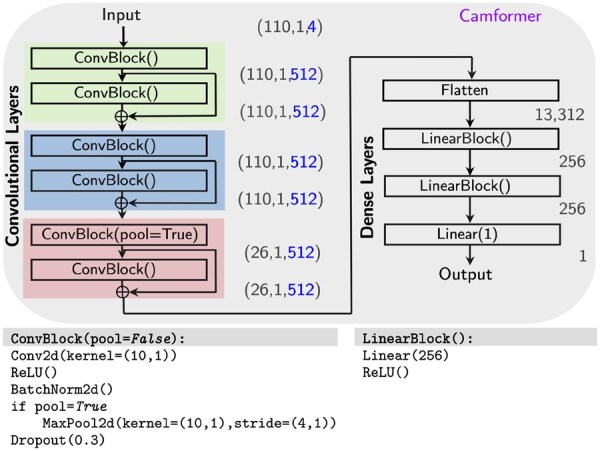
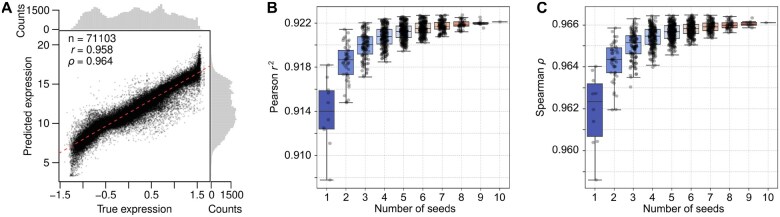
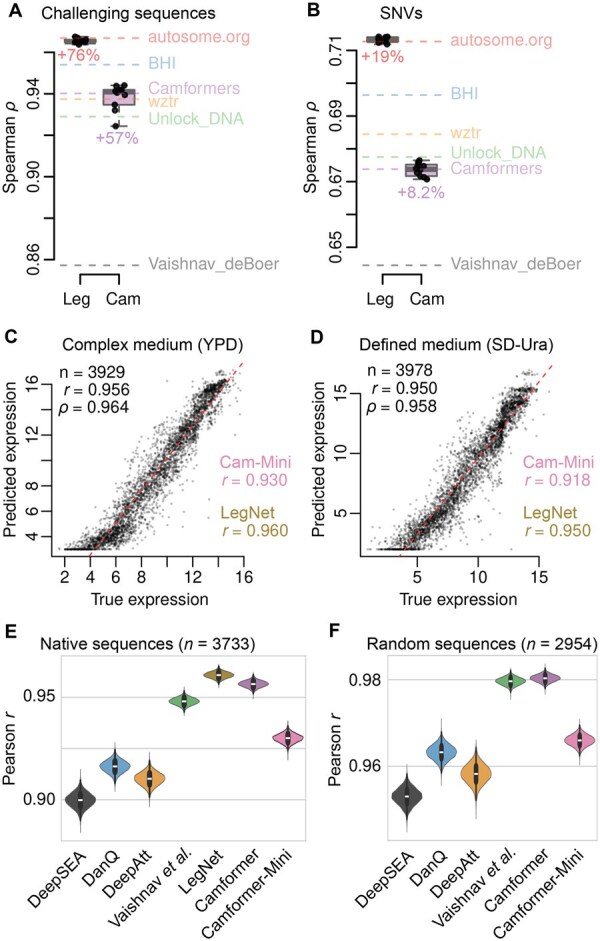
Motivation: Gene regulation involves complex interactions between multiple transcription factors. While early attempts to train deep neural networks to predict gene expression were limited to naturally occurring promoter sequences, the advent of gigantic parallel reporter assays has expanded available training data by orders of magnitude. Despite these advances, a clear understanding of how to use deep learning to study gene regulation is still lacking. Method: Here we investigate the complex association between gene promoters and expression in S. cerevisiae using Camformer, a residual convolutional neural network that ranked 4th in the Random Promoter DREAM Challenge 2022. We present the original model trained on 6.7 million random promoter sequences and investigate 270 alternative models to determine what factors contribute most to model performance. Finally, we use explainable AI to uncover regulatory signals. Results: We show that Camformer accurately decodes the association between promoters and gene expression ( r 2 = 0.914 ± 0.003, ρ = 0.962 ± 0.002) and provides a substantial improvement over previous state of the art. Furthermore, we show that a much smaller model with approximately 90% fewer parameters than the original model can achieve a high predictive performance. Using Grad-CAM and in silico mutagenesis, we demonstrate that the model learns both individual motifs and their hierarchy. For example, while an IME1 motif on its own increases gene expression, the co-occurrence of a UME6 motif provides a switch to strongly reduce gene expression. Thus, deep learning models such as Camformer can provide detailed insights into cis -regulatory logic. Availability and Implementation: The data and code used and developed in our experiments are publicly available at: https://github.com/Bornelov-lab/Camformer .
Overview
The claims and statistics of this paper haven’t been checked yet.
Run the check — free, no account needed. It reads the open-access text and checks the sources it cites.
Integrity signals
Registry
Cites
Statistics
Figures
Verification
Claims the paper makes
The claims and statistics of this paper haven’t been checked yet.
Run the check — free, no account needed. It reads the open-access text and checks the sources it cites.
Self-check
Percentages, sums and reported differences re-computed from the paper’s own numbers.
The self-check needs the paper’s full text.
Citations
Cites
Highly accurate protein structure prediction with AlphaFold
Jumper, J., Evans, R., Pritzel, A., Green, T., Figurnov, M., Ronneberger, O., Tunyasuvunakool, K., Bates, R., Žídek, A., Potapenko, A., et al. (2021) · Nature · doi:10.1038/s41586-021-03819-2 · Cited by 43,764
Research works printed but not linked: 27
- Takuya Akiba , Shotaro Sano , Toshihiko Yanase , et al. Optuna: A next-generation hyperparameter optimization framework. In Proc 25th ACM SIGKDD Int Conf Knowl Discov Data Min, pages 2623–2631, 2019. · DOI
- 10.1038/s41592-021-01252-x · DOI · Paper page
- 10.1038/S41588-021-00782-6 · DOI · Paper page
- 10.1038/s41587-019-0315-8 · DOI · Paper page
- 10.3389/fdata.2023.1113402 · DOI
- 10.1038/nature11245 · DOI
- 10.1371/journal.pcbi.1002592 · DOI
- 10.1093/genetics/iyad123 · DOI
- 10.1016/j.cell.2009.02.043 · DOI
- 10.1016/j.patrec.2021.06.030 · DOI
- 10.1186/s12859-024-05645-5 · DOI
- 2020, DeepATT: a hybrid category attention neural network for identifying functional effects of DNA sequences, Brief Bioinform, 22, bbaa159
- 10.1016/j.aiopen.2022.10.001 · DOI · Paper page
- 10.1016/j.cels.2021.05.015 · DOI
- 10.1038/nbt.1589 · DOI · Paper page
- 10.1093/bioinformatics/btad457 · DOI
- 10.1093/nar/gkw226 · DOI
- Abdul Muntakim Rafi , Daria Nogina , Dmitry Penzar , et al. A community effort to optimize sequence-based deep learning models of gene regulation. Nat Biotechnol, pages 1–11, 2024.
- Ramprasaath R Selvaraju , Michael Cogswell , Abhishek Das , et al. Grad-CAM: Visual explanations from deep networks via gradient-based localization. In Proc IEEE Int Conf Comput Vis, pages 618–626, 2017. · DOI · Paper page
- 2021, Efficientnetv2: Smaller models and faster training, arXiv preprint
- 10.1038/s41586-022-04506-6 · DOI
- Ashish Vaswani , Noam Shazeer , Niki Parmar , et al. Attention is all you need. Adv Neural Inf Process Syst, 30, 2017.
- Olivia Wiles , Sven Gowal , Florian Stimberg , et al. A fine-grained analysis on distribution shift. In International Conference on Learning Representations, 2022.
- 10.1038/s42256-021-00316-z · DOI
- 10.1038/nmeth.3547 · DOI · Paper page
- 2023, Xai meets biology: A comprehensive review of explainable ai in bioinformatics applications, arXiv preprint
- 10.1038/s41467-020-19921-4 · DOI · Paper page
Metadata
- Authors
- Dash, T., & Bornelöv, S.
- Affiliations
- University of Cambridge (GB)
- Corresponding author
- Bornelöv, Susanne
- Venue
- Bioinformatics Advances
- Publisher
- openRxiv
- Published
- 2025-01-27
- Volume
- 5
- Issue
- 1
- Pages
- vbaf130-vbaf130
- ISSN
- 2635-0041 (ISSN-L)
- PMC
- PMC12188188
- OpenAlex
- W4410942367
- Cited by
- 4
- References
- 1
- Citations by year
- 2026: 3 · 2025: 1
- FWCI
- 0.54
- Type
- journal article
- Language
- en
- Open access
- gold
- doi.org
- Licence
- Locations
- Bioinformatics Advances (publishedVersion, cc-by)
- bioRxiv (Cold Spring Harbor Laboratory) (acceptedVersion, cc-by)
- PubMed Central (publishedVersion, cc-by)
- PubMed (publishedVersion)
- Apollo (University of Cambridge) (submittedVersion, cc-by)
- Apollo (cc-by)
- Funders
- Wellcome Trust (226518/Z/22/Z, 226518)
- Dell EMC
- Engineering and Physical Sciences Research Council (EP/T022159/, EP/T022159/1)
- Science and Technology Facilities Council
- Topics
- Life Sciences › Biochemistry, Genetics and Molecular Biology › Molecular Biology › Genomics and Chromatin Dynamics
- Life Sciences › Biochemistry, Genetics and Molecular Biology › Molecular Biology › Gene Regulatory Network Analysis
- Life Sciences › Biochemistry, Genetics and Molecular Biology › Molecular Biology › Fungal and yeast genetics research
- Keywords
- gene expression prediction, promoter, deep learning, transcription factor binding motifs, motif co-occurrence, explainable AI, Grad-CAM, in silico mutagenesis, Saccharomyces cerevisiae
About these checks
Registry, retraction, Cites and statistics results are computed, not judged, with one exception: a printed reference that no index lists is read once by a model before it counts as a citation error. Claims are extracted by a model and kept only when their quote appears verbatim in the text; each cited source is then checked, with a model’s help, for whether it says what the claim relies on. Those verdicts can be wrong — read the claim’s quote and the cited source before relying on one.
Statistics and arithmetic are recomputed, not judged.
Confidence bands are shown only for fields calibrated on our annotated test set. None is calibrated yet, so no band is shown.
What counts as a claim ›How we measure confidence ›How we check this ›
Are you an author, or do you see a problem with this page? Request a review
How to cite
Cite CoChat for the checks on this page, and the paper for its own findings.
- This page
- CoChat. (2026). Citation check: Predicting gene expression using millions of yeast promoters reveals cis -regulatory logic. https://app.cochat.ai/papers/10.1101/2025.01.25.634853
- The paper
- Dash, T., & Bornelöv, S. (2025). Predicting gene expression using millions of yeast promoters reveals cis -regulatory logic. Bioinformatics Advances. https://doi.org/10.1101/2025.01.25.634853
