

The DOI matches its Crossref record; 1 of the 1 references it cites were found in a registry or an index.
Exploring the structural diversity and evolution of the D1 subunit of photosystem II using AlphaFold and Foldtree
Open accessPreprint — published as 10.1111/ppl.70284 · Paper page
Abstract
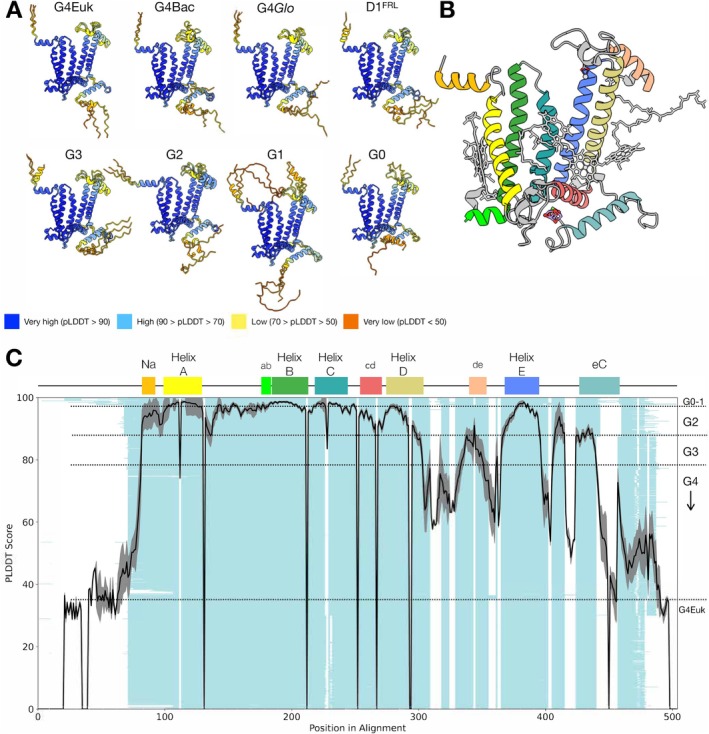
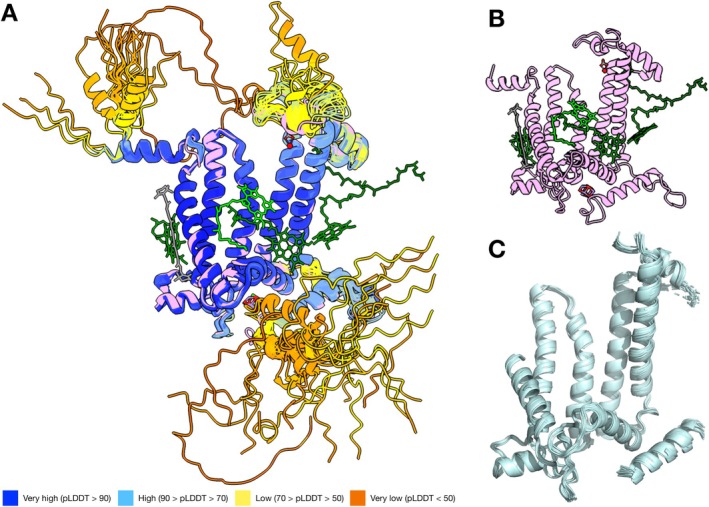
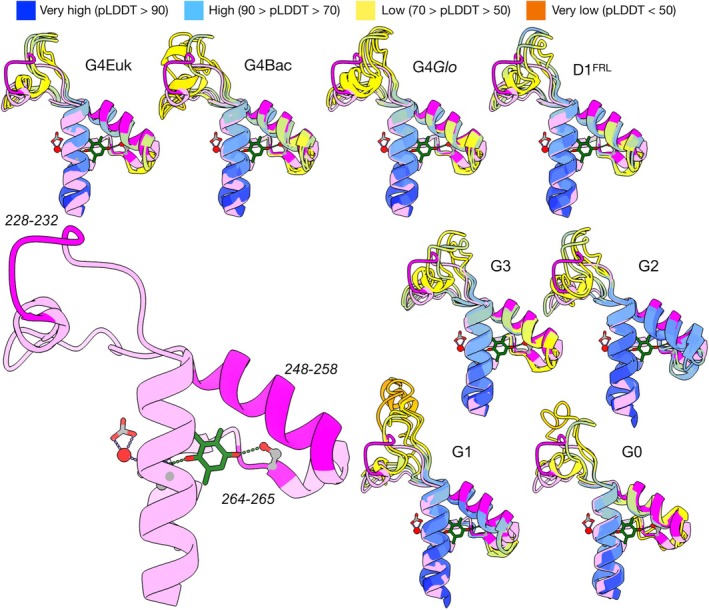
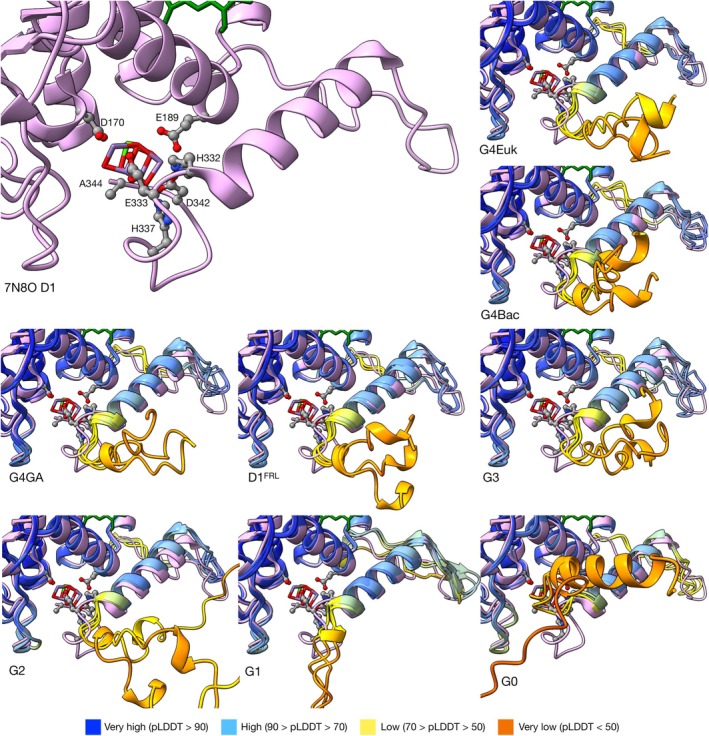
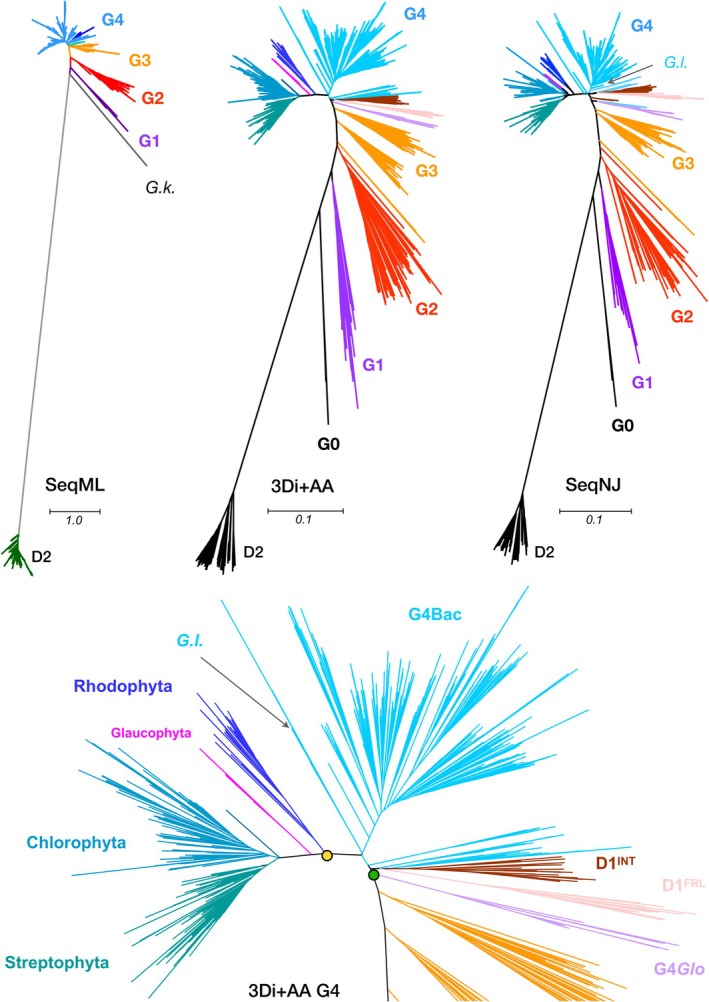
While our knowledge of photosystem II has expanded to time-resolved atomic details, the diversity of experimental structures of the enzyme remains limited. Recent advances in protein structure prediction with AlphaFold offer a promising approach to fill this gap in structural diversity in non-model systems. This study used AlphaFold to predict the structures of the D1 protein, the core subunit of photosystem II, across a broad range of photosynthetic organisms. The prediction produced high-confidence structures, and structural alignment analyses highlighted conserved regions across the different D1 groups, which were in line with high pLDDT scoring regions. In contrast, varying pLDDT in the DE loop and terminal regions appear to correlate with different degrees of structural flexibility or disorder. Subsequent structural phylogenetic analysis provided a phylogeny that is in good agreement with previous sequence-based studies. Moreover, the phylogeny supports a parsimonious scenario in which far-red D1 and D1 INT evolved from the ancestral form of G4 D1. This study demonstrates the potential of AlphaFold in studies on structural diversity and the evolution of photosynthesis.
Overview
The claims and statistics of this paper haven’t been checked yet.
Run the check — free, no account needed. It reads the open-access text and checks the sources it cites.
Integrity signals
Registry
Cites
Statistics
Figures
Verification
Claims the paper makes
The claims and statistics of this paper haven’t been checked yet.
Run the check — free, no account needed. It reads the open-access text and checks the sources it cites.
Self-check
Percentages, sums and reported differences re-computed from the paper’s own numbers.
The self-check needs the paper’s full text.
Citations
Cites
Highly accurate protein structure prediction with AlphaFold
Jumper, J., Evans, R., Pritzel, A., Green, T., Figurnov, M., Ronneberger, O., Tunyasuvunakool, K., Bates, R., Žídek, A., Potapenko, A., et al. (2021) · Nature · doi:10.1038/s41586-021-03819-2 · Cited by 43,764
Research works printed but not linked: 56
- 10.1038/S41586-024-07487-W · DOI · Paper page
- 10.1073/pnas.91.17.8082 · DOI
- 10.1038/s41467-024-55264-0 · DOI
- 10.1038/s41586-023-06510-w · DOI · Paper page
- 10.1093/nar/28.1.235 · DOI · Paper page
- Bowles, A. M. C. , Williamson, C. J. , Williams, T. A. & Donoghue, P. C. J. 2024. Cryogenian Origins of Multicellularity in Archaeplastida. Genome Biol Evol, 16. · DOI
- 10.1093/molbev/msv024 · DOI
- 10.1016/j.bbabio.2011.07.012 · DOI
- 10.1093/bioinformatics/btx828 · DOI
- 10.1126/science.1093087 · DOI
- 10.1016/j.bbabio.2024.149032 · DOI
- 10.3390/microorganisms10071270 · DOI
- 10.1073/pnas.2116765118 · DOI
- 10.1093/molbev/msp259 · DOI
- 10.1038/s41598-022-14382-9 · DOI · Paper page
- 10.1093/bioinformatics/18.11.1546 · DOI
- 10.1002/prot.22458 · DOI
- Karelina, M. , Noh, J. J. & Dror, R. O. 2023. How accurately can one predict drug binding modes using AlphaFold models? Elife, 12. · DOI
- 10.1093/plcell/koae082 · DOI
- 10.1105/tpc.107.053868 · DOI
- 10.1093/bioinformatics/bts480 · DOI · Paper page
- 10.1002/prot.26471 · DOI
- 10.1093/bioadv/vbad134 · DOI
- 10.1093/molbev/msaa100 · DOI
- 10.1093/bioinformatics/btt473 · DOI · Paper page
- 10.1002/PRO.4792 · DOI
- 10.1038/S41592-022-01488-1 · DOI · Paper page
- Moi, D. , Bernard, C. , Steinegger, M. , Nevers, Y. , Langleib, M. & Dessimoz, C. 2023. Structural phylogenetics unravels the evolutionary diversification of communication systems in gram-positive bacteria and their viruses. BioRxiv. · DOI
- Moore, K. R. , Magnabosco, C. , Momper, L. , Gold, D. A. , Bosak, T. & Fournier, G. P. 2019. An Expanded Ribosomal Phylogeny of Cyanobacteria Supports a Deep Placement of Plastids. Frontiers in Microbiology, 10. · DOI
- 10.1023/A:1005765305956 · DOI
- 10.1007/s11120-011-9714-5 · DOI
- Oliver, T. , Kim, T. D. , Trinugroho, J. P. , Cordon-Preciado, V. , Wijayatilake, N. , Bhatia, A. , Rutherford, A. W. & Cardona, T. 2023. The Evolution and Evolvability of Photosystem II. Annu Rev Plant Biol, 74. · DOI · Paper page
- 10.1002/prot.22616 · DOI
- 10.1016/j.cub.2016.11.056 · DOI
- 10.1016/j.febslet.2011.12.039 · DOI
- 10.1073/pnas.1212957110 · DOI
- 10.1093/bioinformatics/btac202 · DOI · Paper page
- 10.1073/pnas.1620089114 · DOI
- 10.1007/s11120-007-9191-z · DOI
- Saw, J. H. , Cardona, T. & Montejano, G. 2021. Complete Genome Sequencing of a Novel Gloeobacter Species from a Waterfall Cave in Mexico. Genome Biol Evol, 13. · DOI
- 10.1007/s11120-020-00762-7 · DOI
- 10.1038/msb.2011.75 · DOI
- 10.1038/nbt.3988 · DOI · Paper page
- 10.1107/S205979832300102X · DOI · Paper page
- 10.1038/s41592-023-02087-4 · DOI · Paper page
- 10.1038/s41559-017-0193 · DOI
- 10.1038/s41477-020-0616-4 · DOI
- 10.1038/nature09913 · DOI
- Vishwanathan, S. & Garnett, R. (eds.) Advances in Neural Information Processing Systems.
- 10.1038/s41587-023-01773-0 · DOI · Paper page
- 10.1126/science.add1964 · DOI · Paper page
- 10.1038/s41477-021-00961-7 · DOI
- 10.1146/annurev-biophys-071723-102519 · DOI
- Yu, D. , Chojnowski, G. , Rosenthal, M. & Kosinski, J. 2023. AlphaPulldown-a python package for protein-protein interaction screens using AlphaFold-Multimer. Bioinformatics, 39. · DOI · Paper page
- Zabret, J. , Bohn, S. , Schuller, S. K. , Arnolds, O. , Moller, M. , Meier-Credo, J. , Liauw, P. , Chan, A. , Tajkhorshid, E. , Langer, J. D. , Stoll, R. , Krieger-Liszkay, A. , Engel, B. D. , Rudack, T. , Schuller, J. M. & Nowaczyk, M. M. 2021. Structural insights into photosystem II assembly. Nat Plants. · DOI
- 10.1038/s41467-023-40388-6 · DOI
Metadata
- Authors
- Kim, T. D., Pretorius, D., Murray, J. W., & Cardona, T.
- Affiliations
- Queen Mary University of London (GB)
- Imperial College London (GB)
- Venue
- Physiologia Plantarum
- Publisher
- openRxiv
- Published
- 2025-03-07
- Volume
- 177
- Issue
- 3
- Pages
- e70284-e70284
- ISSN
- 0031-9317 (ISSN-L)
- PMC
- PMC12096807
- OpenAlex
- W4410589506
- Cited by
- 4
- References
- 1
- Citations by year
- 2026: 3 · 2025: 1
- FWCI
- 1.20
- Type
- journal article
- Language
- en
- Open access
- hybrid
- doi.org
- Licence
- Locations
- Physiologia Plantarum (publishedVersion, cc-by)
- bioRxiv (Cold Spring Harbor Laboratory) (acceptedVersion)
- PubMed Central (publishedVersion, cc-by)
- PubMed (publishedVersion)
- Spiral (Imperial College London) (submittedVersion)
- Funders
- UK Research and Innovation (MR/Y011635/1, MR/T017546/1, MR/T017546/2)
- Engineering and Physical Sciences Research Council (EP/S022856/1)
- Topics
- Life Sciences › Biochemistry, Genetics and Molecular Biology › Molecular Biology › Photosynthetic Processes and Mechanisms
- Life Sciences › Biochemistry, Genetics and Molecular Biology › Molecular Biology › Protein Structure and Dynamics
- Life Sciences › Biochemistry, Genetics and Molecular Biology › Structural Biology › Enzyme Structure and Function
- Keywords
- photosystem II, protein structure prediction, structural diversity, DE loop, structural flexibility, intrinsically disordered regions, photosynthetic organisms
- MeSH terms
- Models, Molecular, Photosynthesis, Phylogeny, Evolution, Molecular, Photosystem II Protein Complex
About these checks
Registry, retraction, Cites and statistics results are computed, not judged, with one exception: a printed reference that no index lists is read once by a model before it counts as a citation error. Claims are extracted by a model and kept only when their quote appears verbatim in the text; each cited source is then checked, with a model’s help, for whether it says what the claim relies on. Those verdicts can be wrong — read the claim’s quote and the cited source before relying on one.
Statistics and arithmetic are recomputed, not judged.
Confidence bands are shown only for fields calibrated on our annotated test set. None is calibrated yet, so no band is shown.
What counts as a claim ›How we measure confidence ›How we check this ›
Are you an author, or do you see a problem with this page? Request a review
