PreprintCited by 4Photosynthetic Processes and MechanismsPhotoreceptor and optogenetics researchMetalloenzymes and iron-sulfur proteins

The DOI matches its Crossref record; 2 of the 2 references it cites were found in a registry or an index.

Light-induced structural adaptation of the bundle-shaped phycobilisome from thylakoid-lacking cyanobacterium Gloeobacter violaceus

Open access
Ma, Jianfei, You, Xin, Sun, Shan, Sui, Sen-Fang·2025·Nature Communications

Preprint — published as 10.1038/s41467-025-60673-w

Abstract

Summary: Gloeobacter diverged from other lineages early in cyanobacterial evolution, preferentially growing under low light intensity conditions. Among cyanobacteria, G. violaceus exhibits unique features, including lack of a thylakoid membrane and bundle-shaped antenna phycobilisomes (PBSs), densely packed and well-organized on the plasma membrane. However, without high-resolution structures, it has remained unclear how G. violaceus PBSs assemble into a bundle-shaped configuration. Here we solved the cryo-EM structures of PBSs from G. violaceus cells cultured under low (Sr-PBS) or moderate (Lr-PBS) light intensity. These structures revealed two unique linker proteins, L RC 91kDa and L RC 81kDa , that play a key role in the PBS architecture. Analysis of the bilin arrangement indicated that the bundle-shaped structure allows efficient energy transfer among rods. Moreover, comparison between Lr-PBS and Sr-PBS uncovered a distinct mode of adaption to increased light intensity wherein the ApcA 2 -ApcB 3 -ApcD layer can be blocked from binding to the core by altering structural elements exclusively found in the G. violaceus L CM . This study illustrates previously unrecognized mechanisms of assembly and adaptation to varying light intensity in the bundle-shaped PBS of G. violaceus .

Overview

The claims and statistics of this paper haven’t been checked yet.

Run the check — free, no account needed. It reads the open-access text and checks the sources it cites.

A few free checks a day · papers already verified open instantly · results are public

Integrity signals

Registry

Crossref · 10.1101/2025.05.12.653420

Cites

2 of 2 references verified0 citation errors · 0 not checkable

Statistics

Figures

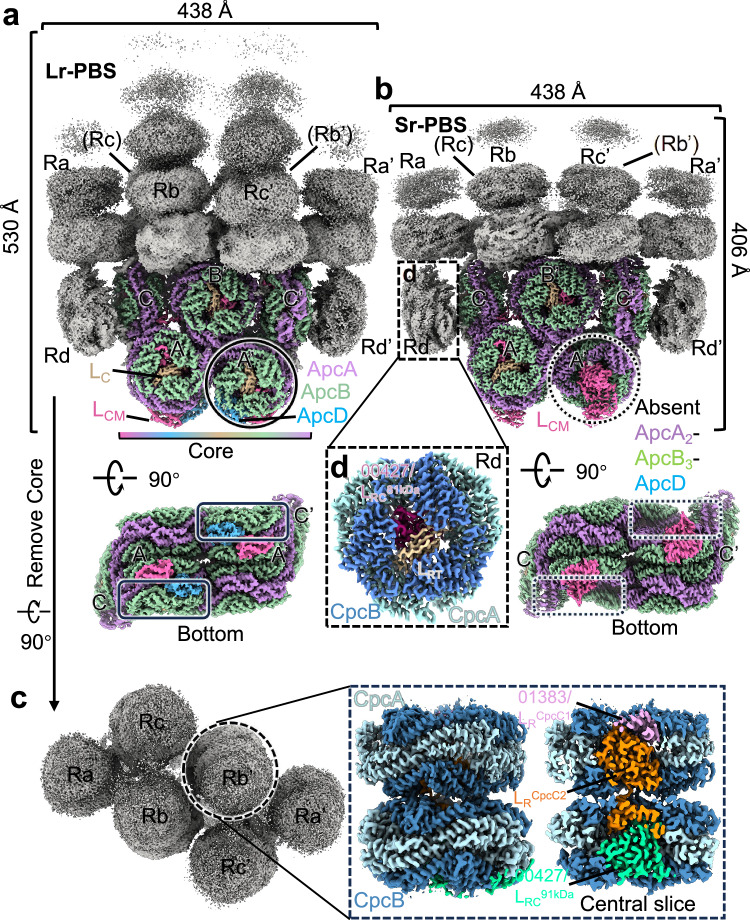
Fig. 1 Overall structures of PBS from G. violaceus 7421. a, b Cryo-EM maps of two types of assemblies of PBS (Lr-PBS and Sr-PBS) from face and bottom views. The rods are colored gray. PBS core is presented in different colors. The solid and dashed black circles are represented whether ApcA2-ApcB3-ApcD layer is bond with the core or not in Lr-PBS and Sr-PBS. c Top view of rods. Enlarged view of the boxed area on the right side of (c) shows the cryo-EM map of Rod b after local refinement. The LRCpcC1, LRCpcC2, and LRC91kDa are colored as pink, orange, and lime green. d Enlarged view of the boxed area of (b) shows the cryo-EM map of Rod d after local refinement. The LRT and LRC81kDa are colored as wheat and warm pink.
Fig. 1 Overall structures of PBS from G. violaceus 7421. a, b Cryo-EM maps of two types of assemblies of PBS (Lr-PBS and Sr-PBS) from face and bottom views. The rods are colored gray. PBS core is presented in different colors. The solid and dashed black circles are represented whether ApcA2-ApcB3-ApcD layer is bond with the core or not in Lr-PBS and Sr-PBS. c Top view of rods. Enlarged view of the boxed area on the right side of (c) shows the cryo-EM map of Rod b after local refinement. The LRCpcC1, LRCpcC2, and LRC91kDa are colored as pink, orange, and lime green. d Enlarged view of the boxed area of (b) shows the cryo-EM map of Rod d after local refinement. The LRT and LRC81kDa are colored as wheat and warm pink.CC BY-NC-ND · PubMed Central
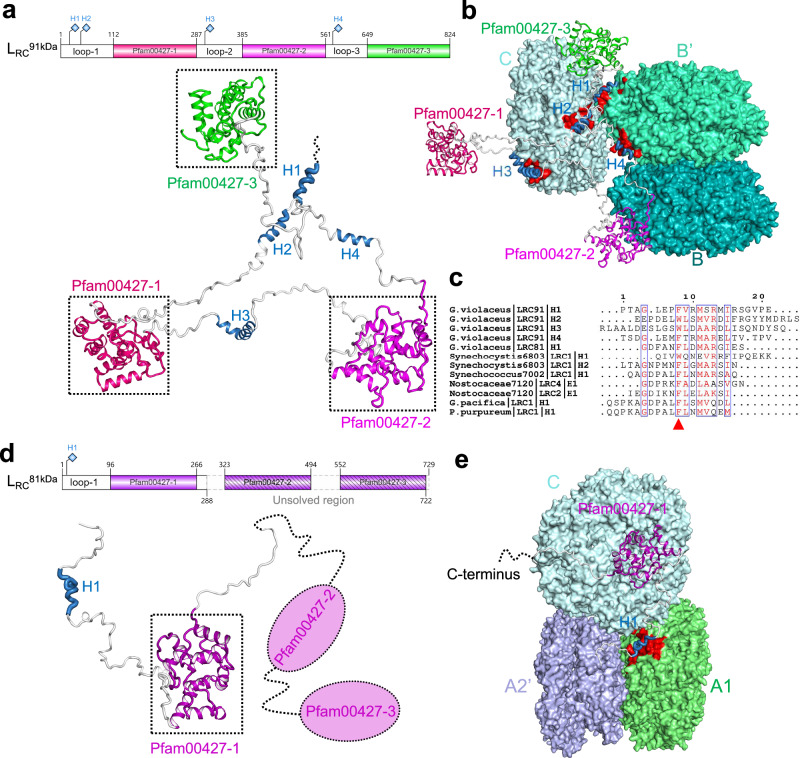
Fig. 2 Rod-core linker proteins, LRC91kDa and LRC81kDa. a Top, diagram of the structural elements of LRC91kDa. Bottom, the structure of LRC91kDa is represented as a cartoon. Three Pfam00427 domains are presented in different colors. Four helices are highlighted in sky blue. b Interactions between LRC91kDa and core. The grooves on the α-subunits that contact the helices are shown in red. c Sequence alignment of the helices of LRC91kDa with LRC from Synechocystis sp. PCC 6803, Synechococcus sp. strain PCC 7002, Nostocaceae PCC 7120, G.pacifica and P.purpureum. The conserved Phenylalanine or Tryptophan is marked as a red triangle. d Top, diagram of the structural elements of LRC81kDa. Bottom, the structure of LRC91kDa is represented as a cartoon. The Pfam00427-1 domain we solved is presented in megenta. The Pfam00427-2 and -3 are presented in a dashed ellipse. The helix is highlighted in sky blue. e Interactions between LRC81kDa and core. The groove on the α-subunit that contacts the helix is shown in red.
Fig. 2 Rod-core linker proteins, LRC91kDa and LRC81kDa. a Top, diagram of the structural elements of LRC91kDa. Bottom, the structure of LRC91kDa is represented as a cartoon. Three Pfam00427 domains are presented in different colors. Four helices are highlighted in sky blue. b Interactions between LRC91kDa and core. The grooves on the α-subunits that contact the helices are shown in red. c Sequence alignment of the helices of LRC91kDa with LRC from Synechocystis sp. PCC 6803, Synechococcus sp. strain PCC 7002, Nostocaceae PCC 7120, G.pacifica and P.purpureum. The conserved Phenylalanine or Tryptophan is marked as a red triangle. d Top, diagram of the structural elements of LRC81kDa. Bottom, the structure of LRC91kDa is represented as a cartoon. The Pfam00427-1 domain we solved is presented in megenta. The Pfam00427-2 and -3 are presented in a dashed ellipse. The helix is highlighted in sky blue. e Interactions between LRC81kDa and core. The groove on the α-subunit that contacts the helix is shown in red.CC BY-NC-ND · PubMed Central
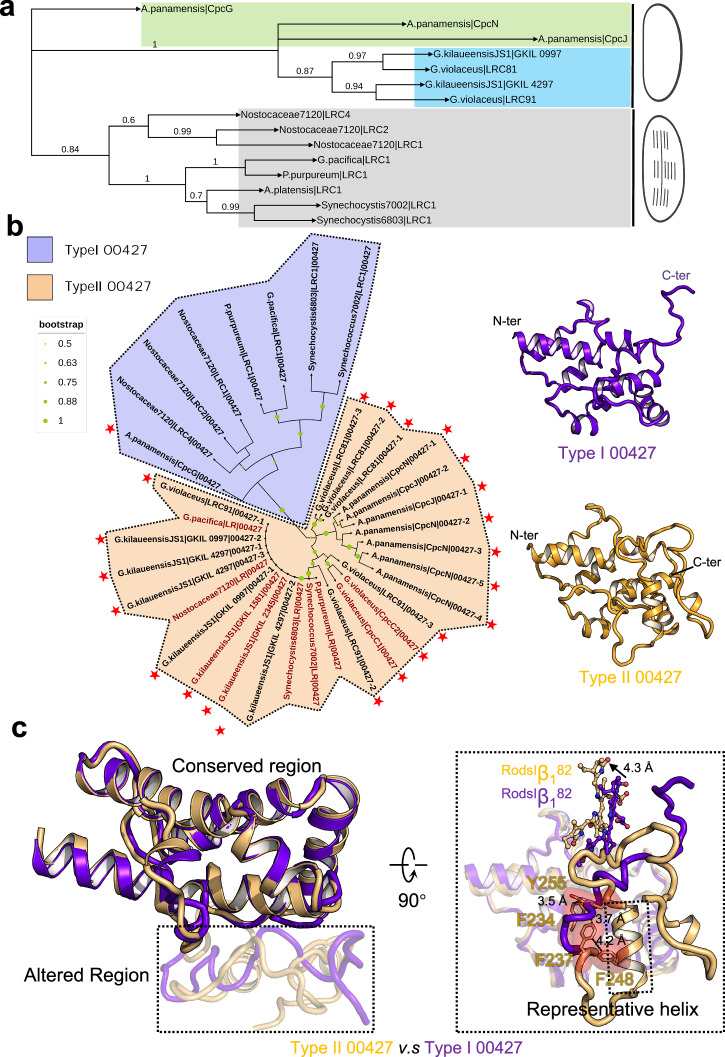
Fig. 3 Phylogenetic relationship of LRC and classifications of Pfam00427. a The maximum likelihood phylogenetic trees constructed using the full-length protein sequences of LRC from thylakoid-lacking cyanobacterium G. violaceus 7421, G. kilaueensis JS1, A. panamensis, and crown cyanobacteria Nostocaceae PCC 7120, Synechocystis sp. PCC 6803, Synechococcus sp. strain PCC 7002, A. platensis, and red algae G.pacifica and P.purpureum. Bootstrap values are presented on the tree nodes, and the values higher than 0.6 are shown. b Left, phylogenetic trees constructed using the separated Pfam00427 domains, Pfam00427 domains of LR and LRC are labeled in firebrick and black, respectively. The Pfam00427 domains are classified into two types: Type I and II 00427 domains are shown on the purple and light orange background, respectively. The Pfam00427 domains belong to thylakoid-free cyanobacteria are marked with a red star. Right, the structures of type I and II 00427 domains are shown as a cartoon. c Structural alignment of the type I and II 00427 domains. Region of structural change is shown with 70% transparency. Enlarged view of the boxed area of c shows the altered structures including key aromatic residues, representative helix of type II 00427 domain, as well as the shift of bilins.
Fig. 3 Phylogenetic relationship of LRC and classifications of Pfam00427. a The maximum likelihood phylogenetic trees constructed using the full-length protein sequences of LRC from thylakoid-lacking cyanobacterium G. violaceus 7421, G. kilaueensis JS1, A. panamensis, and crown cyanobacteria Nostocaceae PCC 7120, Synechocystis sp. PCC 6803, Synechococcus sp. strain PCC 7002, A. platensis, and red algae G.pacifica and P.purpureum. Bootstrap values are presented on the tree nodes, and the values higher than 0.6 are shown. b Left, phylogenetic trees constructed using the separated Pfam00427 domains, Pfam00427 domains of LR and LRC are labeled in firebrick and black, respectively. The Pfam00427 domains are classified into two types: Type I and II 00427 domains are shown on the purple and light orange background, respectively. The Pfam00427 domains belong to thylakoid-free cyanobacteria are marked with a red star. Right, the structures of type I and II 00427 domains are shown as a cartoon. c Structural alignment of the type I and II 00427 domains. Region of structural change is shown with 70% transparency. Enlarged view of the boxed area of c shows the altered structures including key aromatic residues, representative helix of type II 00427 domain, as well as the shift of bilins.CC BY-NC-ND · PubMed Central
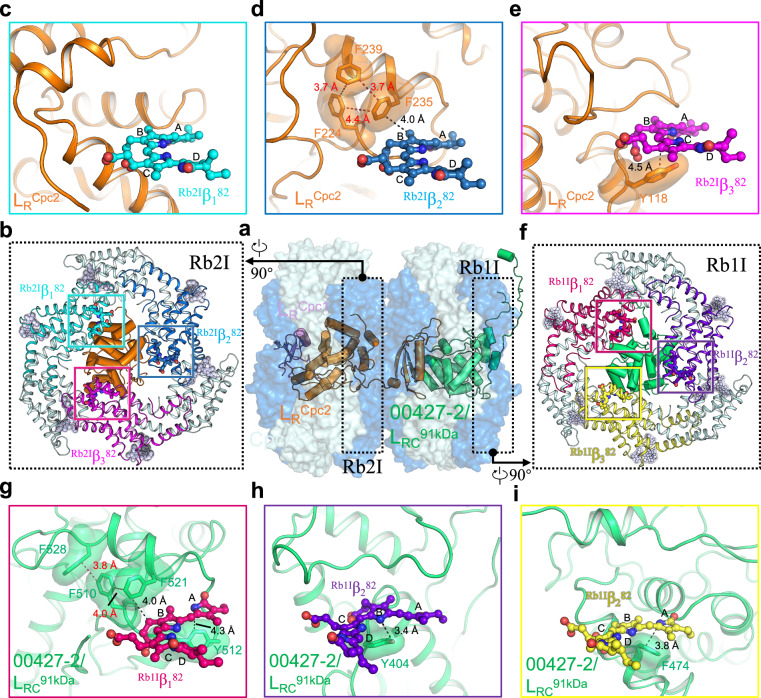
Fig. 4 Interactions of the linker proteins LRCpcC2 and LRC91kDa with chromophores in the rod Rb. a Overall structure of the rod Rb with the hexamers shown in surface representation and the linker proteins shown in cartoon representation. b Structure of the layer Rb2I. Proteins and bilins are shown in cartoon and sticks representations, respectively. Three β subunits are colored differently, and the β82 PCBs are boxed and analyzed in (c–e). c No interactions between the LRCpcC2 and the bilin Rb2Iβ182. d The interactions between F224, F235 and F239 and the bilin Rb2Iβ282. e The interactions between Y118 and Rb2Iβ382. f Structure of the layer Rb1I. Proteins and bilins are shown in cartoon and sticks representations, respectively. Three β subunits are colored differently, and the β82 PCBs are boxed and analyzed in (g–i). g The interactions between F510, F512, F521 and F528 and the bilin Rb1Iβ182. h The interactions between Y404 and the bilin Rb1Iβ282. i The interactions between F474 and the bilin Rb1Iβ382.
Fig. 4 Interactions of the linker proteins LRCpcC2 and LRC91kDa with chromophores in the rod Rb. a Overall structure of the rod Rb with the hexamers shown in surface representation and the linker proteins shown in cartoon representation. b Structure of the layer Rb2I. Proteins and bilins are shown in cartoon and sticks representations, respectively. Three β subunits are colored differently, and the β82 PCBs are boxed and analyzed in (c–e). c No interactions between the LRCpcC2 and the bilin Rb2Iβ182. d The interactions between F224, F235 and F239 and the bilin Rb2Iβ282. e The interactions between Y118 and Rb2Iβ382. f Structure of the layer Rb1I. Proteins and bilins are shown in cartoon and sticks representations, respectively. Three β subunits are colored differently, and the β82 PCBs are boxed and analyzed in (g–i). g The interactions between F510, F512, F521 and F528 and the bilin Rb1Iβ182. h The interactions between Y404 and the bilin Rb1Iβ282. i The interactions between F474 and the bilin Rb1Iβ382.CC BY-NC-ND · PubMed Central
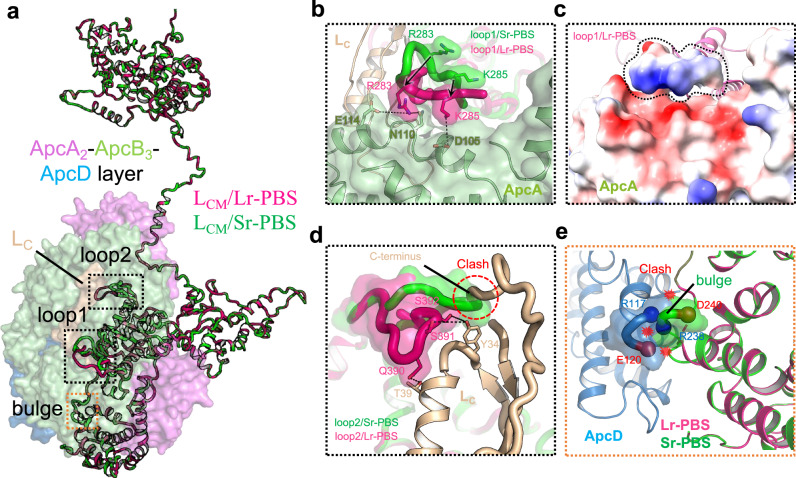
Fig. 5 Structural differences between LCM/Lr-PBS and LCM/Sr-PBS. a Structural alignment of LCM/Lr-PBS and LCM/Sr-PBS. LCM/Lr-PBS and LCM/Sr-PBS are presented in hot pink and green colors. ApcA2-ApcB3-ApcD layer attached with LCM/Lr-PBS is shown as a surface view. The altered structures (loop1, loop2, and bulge) are highlighted in dashed rectangles. b Enlarged view of the boxed area of (a) shows that the structural change of loop1 reduces the interactions between loop1 and ApcA. c Electrostatic interaction between loop1/Lr-PBS and ApcA. d Enlarged view of the structural change of loop2 shows the absence of the interactions between loop2/Sr-PBS and LC. loop2/Sr-PBS could form a steric hindrance to prevent LC binding with the core. e Three successive residues (R238-S239-D240) of αLCM could form a “bulge” that would occupy the position of the ApcD.
Fig. 5 Structural differences between LCM/Lr-PBS and LCM/Sr-PBS. a Structural alignment of LCM/Lr-PBS and LCM/Sr-PBS. LCM/Lr-PBS and LCM/Sr-PBS are presented in hot pink and green colors. ApcA2-ApcB3-ApcD layer attached with LCM/Lr-PBS is shown as a surface view. The altered structures (loop1, loop2, and bulge) are highlighted in dashed rectangles. b Enlarged view of the boxed area of (a) shows that the structural change of loop1 reduces the interactions between loop1 and ApcA. c Electrostatic interaction between loop1/Lr-PBS and ApcA. d Enlarged view of the structural change of loop2 shows the absence of the interactions between loop2/Sr-PBS and LC. loop2/Sr-PBS could form a steric hindrance to prevent LC binding with the core. e Three successive residues (R238-S239-D240) of αLCM could form a “bulge” that would occupy the position of the ApcD.CC BY-NC-ND · PubMed Central
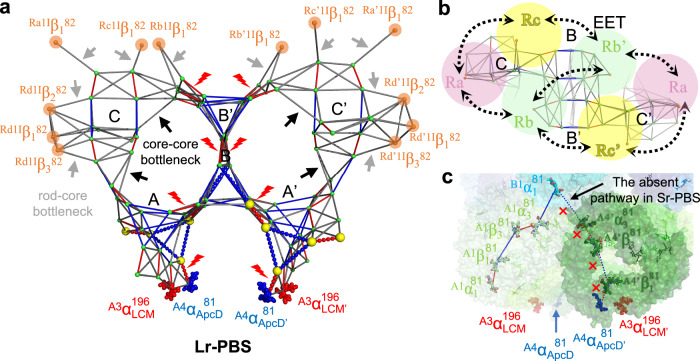
Fig. 6 Possible excitation energy transfer (EET) pathways. a Estimated maps of the energy transfer pathways among bilins based on orientation factor (κ2) and distances (d). The colors correspond to higher (red), middle (blue), and lower (gray) κ2/d6 values, which are used to represent the EET rates. The key bilins of rods are shown as spheres in orange color. Bilins that are more than 44 Å are omitted. The gray and black arrows are represented as the rod-core and inner-core bottleneck, respectively. The energy transfer from top B/B’ to bottom A/A’ is high, represented as red lightning. The absent bilins and pathways in Sr-PBS are shown as yellow spheres and dashes, respectively. The terminal emitters A3αLCM196 (A3αLCM’196) and A4αApcD81 (A4αApcD’81) are shown in sphere representation. b Top view of the energy transfer pathways. The rods are represented as circles in different colors. EET exchange among the rods is represented by black dashed arrows. c The absence of ApcA2-ApcB3-ApcD layer and EET pathways in Sr-PBS is shown as a surface representation. The corresponding bilins are shown as sticks.
Fig. 6 Possible excitation energy transfer (EET) pathways. a Estimated maps of the energy transfer pathways among bilins based on orientation factor (κ2) and distances (d). The colors correspond to higher (red), middle (blue), and lower (gray) κ2/d6 values, which are used to represent the EET rates. The key bilins of rods are shown as spheres in orange color. Bilins that are more than 44 Å are omitted. The gray and black arrows are represented as the rod-core and inner-core bottleneck, respectively. The energy transfer from top B/B’ to bottom A/A’ is high, represented as red lightning. The absent bilins and pathways in Sr-PBS are shown as yellow spheres and dashes, respectively. The terminal emitters A3αLCM196 (A3αLCM’196) and A4αApcD81 (A4αApcD’81) are shown in sphere representation. b Top view of the energy transfer pathways. The rods are represented as circles in different colors. EET exchange among the rods is represented by black dashed arrows. c The absence of ApcA2-ApcB3-ApcD layer and EET pathways in Sr-PBS is shown as a surface representation. The corresponding bilins are shown as sticks.CC BY-NC-ND · PubMed Central

Verification

Claims the paper makes

The claims and statistics of this paper haven’t been checked yet.

Run the check — free, no account needed. It reads the open-access text and checks the sources it cites.

A few free checks a day · papers already verified open instantly · results are public

Self-check

Percentages, sums and reported differences re-computed from the paper’s own numbers.

The self-check needs the paper’s full text.

Citations

Cites

Research works printed but not linked: 66

  1. 1995, An early origin of plastids within the cyanobacterial divergence is suggested by evolutionary trees based on complete 16S rRNA sequences, Mol Biol Evol, 12, 1166
  2. 10.1111/j.1472-4669.2009.00220.x · DOI · Paper page
  3. 10.1111/j.1472-4669.2005.00050.x · DOI
  4. 10.1105/tpc.111.085779 · DOI · Paper page
  5. 10.3389/fmicb.2019.00277 · DOI
  6. 10.1111/j.1529-8817.1968.tb04667.x · DOI
  7. 2021, Novel Gloeobacterales spp. from diverse environments across the globe, Msphere, 0, e00021
  8. 10.1371/journal.pone.0066323 · DOI
  9. 10.1007/s002030050367 · DOI
  10. 10.1093/dnares/10.4.137 · DOI
  11. 10.1007/BF00446333 · DOI
  12. 10.1016/j.bbabio.2008.01.009 · DOI
  13. 10.1016/j.cub.2021.04.042 · DOI
  14. 10.1016/j.febslet.2004.11.013 · DOI
  15. 10.1007/s00203-005-0004-5 · DOI
  16. 10.1016/S1011-1344(99)00094-9 · DOI
  17. 10.1007/BF00425248 · DOI
  18. Gantt, E. , in International Review of Cytology, edited by J. F. Danielli G . H. Bourne and K. W. Jeon (Academic Press, 1980), Vol. Volume 66, pp. 45.
  19. 10.1006/jsbi.1998.4062 · DOI
  20. Adir, N. , Dines, M. , Klartag, M. , McGregor, A. & Melamed-Frank, M. , in Complex Intracellular Structures in Prokaryotes, edited by Jessup M. Shively (Springer Berlin Heidelberg, Berlin, Heidelberg, 2006), pp. 47. · DOI
  21. 10.1038/nature24278 · DOI
  22. 10.1038/s41586-020-2020-7 · DOI
  23. 10.1038/s41467-021-25813-y · DOI
  24. 10.1038/s41467-022-30962-9 · DOI
  25. 10.1038/s41586-022-05156-4 · DOI
  26. 10.1146/annurev-biophys-062920-063657 · DOI · Paper page
  27. 10.1007/s11120-007-9133-9 · DOI
  28. 10.1007/BF00425249 · DOI
  29. 10.1016/j.febslet.2006.04.098 · DOI
  30. 10.1007/s11120-010-9601-5 · DOI
  31. 10.1007/s11120-023-01003-3 · DOI
  32. 2000, Model for the phycobilisome rod with interlocking disks based on domain-weighted linker-polypeptide sequence homologies of Mastigocladus laminosus, Int J Photoenergy, 2000, 31
  33. 2004, Allophycocyanin and energy transfer, Biochim Biophys Acta, 1657, 73, 10.1016/j.bbabio.2004.04.005 · DOI
  34. 2005, Reconstitution of phycobilisome core-membrane linker, LCM, by autocatalytic chromophore binding to ApcE, Biochim Biophys Acta, 1706, 81, 10.1016/j.bbabio.2004.09.008 · DOI
  35. 10.1016/j.jmb.2010.10.036 · DOI
  36. 10.1111/j.1365-2958.2011.07844.x · DOI
  37. 10.1073/pnas.96.4.1363 · DOI
  38. 10.1016/j.bbabio.2005.04.001 · DOI
  39. 10.1038/s41467-023-43646-9 · DOI
  40. 10.1016/j.bbabio.2019.07.002 · DOI
  41. 10.1002/2211-5463.13038 · DOI
  42. 2022, Redshifting and blueshifting of beta82 chromophores in the phycocyanin hexamer of Porphyridium purpureum phycobilisomes due to linker proteins, Life-Basel, 12, 1833, 10.3390/life12111833 · DOI
  43. 10.1021/ja049434a · DOI
  44. 10.1126/science.1242321 · DOI
  45. 1993, Core substructure in phycobilisomes of red algae. II. The central part of the tricylindrical core—APCM—a constituent of hemidiscoidal phycobilisomes of Rhodella violacea, Eur J Cell Biol, 60, 203
  46. 10.1111/php.13197 · DOI
  47. 10.1016/j.bbabio.2019.04.004 · DOI
  48. 10.1016/0005-2728(94)90174-0 · DOI
  49. 10.7554/eLife.73990 · DOI
  50. 10.1038/nmeth1139 · DOI
  51. 10.1016/j.jsb.2005.01.002 · DOI
  52. 10.1038/nmeth.2472 · DOI
  53. 10.1016/S1047-8477(03)00069-8 · DOI
  54. 10.1016/j.jsb.2012.09.006 · DOI · Paper page
  55. 10.1016/j.jmb.2011.11.010 · DOI
  56. 10.1038/nmeth.4169 · DOI · Paper page
  57. 10.1002/jcc.20084 · DOI
  58. 10.1038/s41592-019-0575-8 · DOI
  59. 10.1107/S0907444904019158 · DOI · Paper page
  60. 10.1107/S0907444909052925 · DOI · Paper page
  61. 10.1002/PRO.3235 · DOI · Paper page
  62. 10.1093/bioinformatics/btm404 · DOI
  63. 10.1093/nar/gku316 · DOI · Paper page
  64. 10.1093/MOLBEV/MSAB120 · DOI
  65. 10.1093/nar/gkae268 · DOI
  66. 2014, Active and silent chromophore isoforms for phytochrome Pr photoisomerization: An alternative evolutionary strategy to optimize photoreaction quantum yields, Struct Dyanm-US, 1, 14701, 10.1063/1.4865233 · DOI

Metadata

Authors
Ma, J., You, X., Sun, S., & Sui, S.-F.
Affiliations
  • Nankai University (CN)
  • State Key Laboratory of Membrane Biology (CN)
  • Southern University of Science and Technology (CN)
Corresponding author
  • Ma, Jianfei
  • Sui, Sen-Fang
Venue
Nature Communications
Publisher
openRxiv
Published
2025-05-15
Volume
16
Issue
1
Pages
5956-5956
ISSN
2041-1723 (ISSN-L)
OpenAlex
W4411882060
Cited by
4
References
2
Citations by year
2026: 3 · 2025: 1
FWCI
1.20
Type
journal article
Language
en
Open access
Locations
  • Nature Communications (publishedVersion, cc-by-nc-nd)
  • bioRxiv (Cold Spring Harbor Laboratory) (acceptedVersion)
  • PubMed Central (publishedVersion, cc-by-nc-nd)
  • PubMed (publishedVersion)
  • DOAJ (DOAJ: Directory of Open Access Journals) (submittedVersion, cc-by-sa)
Funders
  • National Natural Science Foundation of China (2023QNRC001, 32000848, 32271245)
  • Chinese Academy of Sciences (2023QNRC001)
  • China Postdoctoral Science Foundation (2023QNRC001)
  • Tsinghua University
  • Nankai University (63243138, BB042412)
  • Institute of Hydrobiology
  • Fundamental Research Funds for the Central Universities (2023QNRC001)
Topics
  • Life Sciences › Biochemistry, Genetics and Molecular Biology › Molecular Biology › Photosynthetic Processes and Mechanisms
  • Life Sciences › Neuroscience › Cellular and Molecular Neuroscience › Photoreceptor and optogenetics research
  • Life Sciences › Biochemistry, Genetics and Molecular Biology › Biochemistry › Metalloenzymes and iron-sulfur proteins
Keywords
Gloeobacter violaceus, phycobilisomes, light intensity adaptation, linker proteins, energy transfer, light-harvesting complexes, cryo-EM structure
MeSH terms
Adaptation, Physiological, Cyanobacteria, Bacterial Proteins, Light, Cryoelectron Microscopy, Thylakoids, Phycobilisomes

About these checks

Registry, retraction, Cites and statistics results are computed, not judged, with one exception: a printed reference that no index lists is read once by a model before it counts as a citation error. Claims are extracted by a model and kept only when their quote appears verbatim in the text; each cited source is then checked, with a model’s help, for whether it says what the claim relies on. Those verdicts can be wrong — read the claim’s quote and the cited source before relying on one.

Statistics and arithmetic are recomputed, not judged.

Confidence bands are shown only for fields calibrated on our annotated test set. None is calibrated yet, so no band is shown.

What counts as a claim ›How we measure confidence ›How we check this ›

Are you an author, or do you see a problem with this page? Request a review