PreprintCited by 2Genomics and Chromatin DynamicsNuclear Structure and FunctionChromatin Remodeling and Cancer

The DOI matches its Crossref record; 1 of the 1 references it cites were found in a registry or an index.

Nucleosome Positioning Shapes Cryptic Antisense Transcription

Open access

Preprint — published as 10.1371/journal.pgen.1012078

Abstract

SUMMARY: Maintaining transcriptional fidelity is essential for precise gene regulation and genome stability. Despite this, cryptic antisense transcription, occurring opposite to canonical coding sequences, is a pervasive feature across all domains of life. How such potentially harmful cryptic sites are regulated remains incompletely understood. Here, we show that nucleosome arrays within gene bodies play a key role in suppressing cryptic transcription. Using the fission yeast Schizosaccharomyces pombe as a model, we demonstrate that CHD1-family chromatin remodelers coordinate with the transcription elongation machinery, specifically the PAF complex, to position nucleosomes at sites of cryptic transcription initiation within gene bodies. In the absence of CHD1, AT-rich sequences within gene bodies lose nucleosome occupancy, exposing promoter-like sequences that drive cryptic initiation. While cryptic transcription is generally detrimental, we identify a subset of antisense transcripts that encode critical meiotic genes, suggesting that cryptic transcription can also serve as a source of regulatory innovation. These findings underscore the essential role of nucleosome remodelers in maintaining transcriptional fidelity and reveal their broader contributions to cellular homeostasis and evolutionary adaptability.

Overview

The claims and statistics of this paper haven’t been checked yet.

Run the check — free, no account needed. It reads the open-access text and checks the sources it cites.

A few free checks a day · papers already verified open instantly · results are public

Integrity signals

Registry

Crossref · 10.1101/2025.07.14.664753

Cites

1 of 1 references verified0 citation errors · 0 not checkable

Statistics

Figures

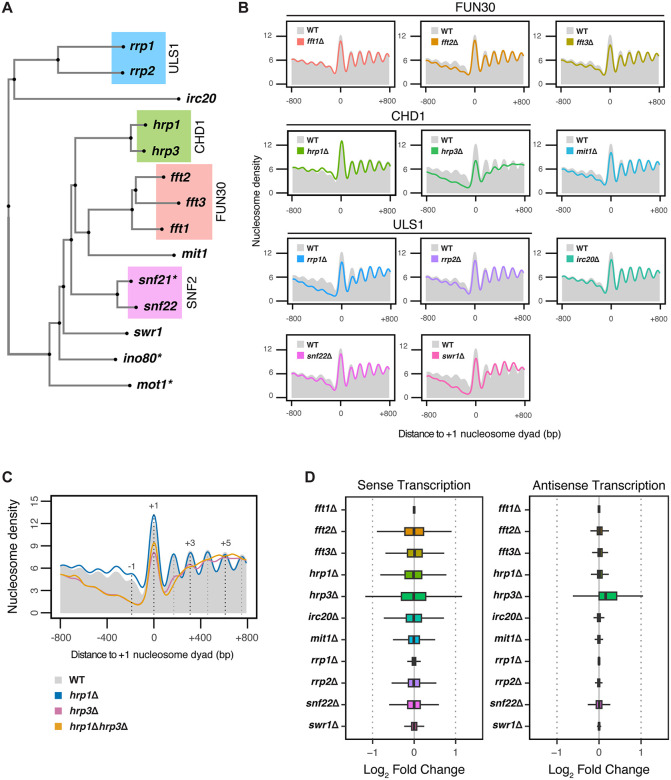
Fig 1 The Impact of Nucleosome Remodelers on Nucleosome Phasing and Transcription. (A) Unrooted tree generated from multiple sequence alignment of 14 nucleosome remodelers in S. pombe. Groupings of paralogs are indicated by coloring, with each group corresponding to the ortholog of a nucleosome remodeler in S. cerevisiae. Asterisks (*) indicate the remodelers that are essential in S. pombe. (B) Metaplots of normalized nucleosome density from MNase-seq centered on the + 1 nucleosome dyad for fft1Δ, fft2Δ, and fft3Δ, hrp1Δ, hrp3Δ, irc20Δ, mit1Δ, rrp1Δ, rrp2Δ, snf22Δ, and swr1Δ mutants. Profiles include 800 bp upstream and downstream of the + 1 nucleosome dyad for all protein-coding genes. The WT profile is shown in solid grey. The plotted data represents the average signal from two biological replicates. (C) Metaplots of normalized nucleosome density from MNase-seq centered on the + 1 nucleosome dyad for WT, hrp1Δ, hrp3Δ, and hrp1Δhrp3Δ. The WT nucleosome profile is shown in solid grey, with dotted lines indicating the positions of select nucleosome maxima (-1, + 1, + 3 and +5). Profiles include 800 bp upstream and downstream of the + 1 nucleosome dyad for all protein-coding genes. The plotted data represents the average signal from two biological replicates. (D) Differential expression analysis of mRNA-seq data showing the boxplots of log2fold-change values of all S. pombe protein-coding genes in both sense and antisense orientations across fft1Δ, fft2Δ, and fft3Δ, hrp1Δ, hrp3Δ, irc20Δ, mit1Δ, rrp1Δ, rrp2Δ, snf22Δ, and swr1Δ mutants compared to WT. Data are calculated from three biological replicates.
Fig 1 The Impact of Nucleosome Remodelers on Nucleosome Phasing and Transcription. (A) Unrooted tree generated from multiple sequence alignment of 14 nucleosome remodelers in S. pombe. Groupings of paralogs are indicated by coloring, with each group corresponding to the ortholog of a nucleosome remodeler in S. cerevisiae. Asterisks (*) indicate the remodelers that are essential in S. pombe. (B) Metaplots of normalized nucleosome density from MNase-seq centered on the + 1 nucleosome dyad for fft1Δ, fft2Δ, and fft3Δ, hrp1Δ, hrp3Δ, irc20Δ, mit1Δ, rrp1Δ, rrp2Δ, snf22Δ, and swr1Δ mutants. Profiles include 800 bp upstream and downstream of the + 1 nucleosome dyad for all protein-coding genes. The WT profile is shown in solid grey. The plotted data represents the average signal from two biological replicates. (C) Metaplots of normalized nucleosome density from MNase-seq centered on the + 1 nucleosome dyad for WT, hrp1Δ, hrp3Δ, and hrp1Δhrp3Δ. The WT nucleosome profile is shown in solid grey, with dotted lines indicating the positions of select nucleosome maxima (-1, + 1, + 3 and +5). Profiles include 800 bp upstream and downstream of the + 1 nucleosome dyad for all protein-coding genes. The plotted data represents the average signal from two biological replicates. (D) Differential expression analysis of mRNA-seq data showing the boxplots of log2fold-change values of all S. pombe protein-coding genes in both sense and antisense orientations across fft1Δ, fft2Δ, and fft3Δ, hrp1Δ, hrp3Δ, irc20Δ, mit1Δ, rrp1Δ, rrp2Δ, snf22Δ, and swr1Δ mutants compared to WT. Data are calculated from three biological replicates.CC BY · PubMed Central
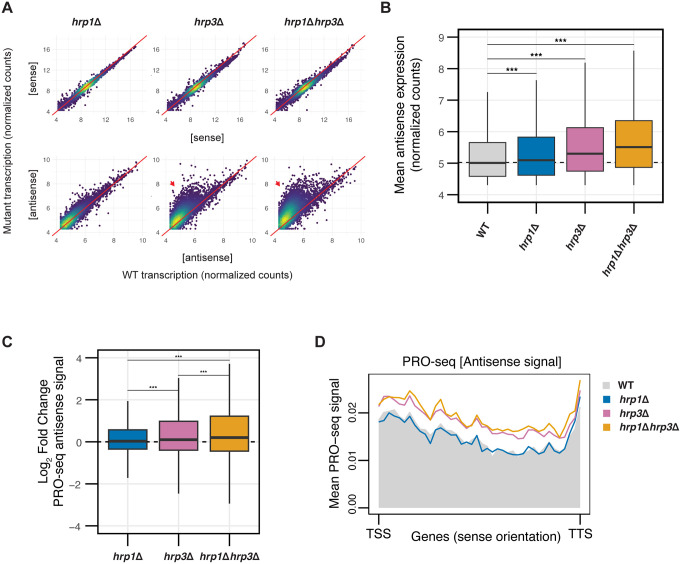
Fig 2 Hrp3 is the Predominant CHD-family Remodeler Regulating Nucleosome Phasing and Antisense Transcription. (A) Density-colored scatterplots comparing mutant (hrp1Δ, hrp3Δ or hrp1Δhrp3Δ) transcription to WT for sense transcripts (top row) and antisense transcripts (bottom row) for all protein-coding genes. Count data is derived from variance-stabilizing transformation (vst) of raw mRNA-seq counts. Red arrows indicate elevated antisense transcription in mutants relative to WT. (B) Boxplot of normalized antisense expression counts for all antisense genes for WT, hrp1Δ, hrp3Δ and hrp1Δhrp3Δ. The dotted line represents the median antisense expression in WT. Statistical analysis was performed using ANOVA with Tukey’s Honestly Significant Difference (HSD) test. Asterisks indicate statistical significance: p < 0.05 (*), p < 0.01 (**), p < 0.001 (***), n.s. (not significant). (C) Boxplot of log2fold-change values of antisense expression measured by PRO-seq for hrp1Δ, hrp3Δ and hrp1Δhrp3Δ relative to WT. The dotted line represents a log2fold-change value of 0. Statistical analysis was performed using ANOVA with Tukey’s HSD test. Asterisks indicate statistical significance: p < 0.05 (*), p < 0.01 (**), p < 0.001 (***), n.s. (not significant). Data are calculated from two biological replicates. (D) Metaplots of mean antisense PRO-seq signal for hrp1Δ, hrp3Δ, and hrp1Δhrp3Δ versus WT, plotted relative to the sense orientation of the transcription start sites (TSS) and transcription termination sites (TTS) of all genes.
Fig 2 Hrp3 is the Predominant CHD-family Remodeler Regulating Nucleosome Phasing and Antisense Transcription. (A) Density-colored scatterplots comparing mutant (hrp1Δ, hrp3Δ or hrp1Δhrp3Δ) transcription to WT for sense transcripts (top row) and antisense transcripts (bottom row) for all protein-coding genes. Count data is derived from variance-stabilizing transformation (vst) of raw mRNA-seq counts. Red arrows indicate elevated antisense transcription in mutants relative to WT. (B) Boxplot of normalized antisense expression counts for all antisense genes for WT, hrp1Δ, hrp3Δ and hrp1Δhrp3Δ. The dotted line represents the median antisense expression in WT. Statistical analysis was performed using ANOVA with Tukey’s Honestly Significant Difference (HSD) test. Asterisks indicate statistical significance: p < 0.05 (*), p < 0.01 (**), p < 0.001 (***), n.s. (not significant). (C) Boxplot of log2fold-change values of antisense expression measured by PRO-seq for hrp1Δ, hrp3Δ and hrp1Δhrp3Δ relative to WT. The dotted line represents a log2fold-change value of 0. Statistical analysis was performed using ANOVA with Tukey’s HSD test. Asterisks indicate statistical significance: p < 0.05 (*), p < 0.01 (**), p < 0.001 (***), n.s. (not significant). Data are calculated from two biological replicates. (D) Metaplots of mean antisense PRO-seq signal for hrp1Δ, hrp3Δ, and hrp1Δhrp3Δ versus WT, plotted relative to the sense orientation of the transcription start sites (TSS) and transcription termination sites (TTS) of all genes.CC BY · PubMed Central
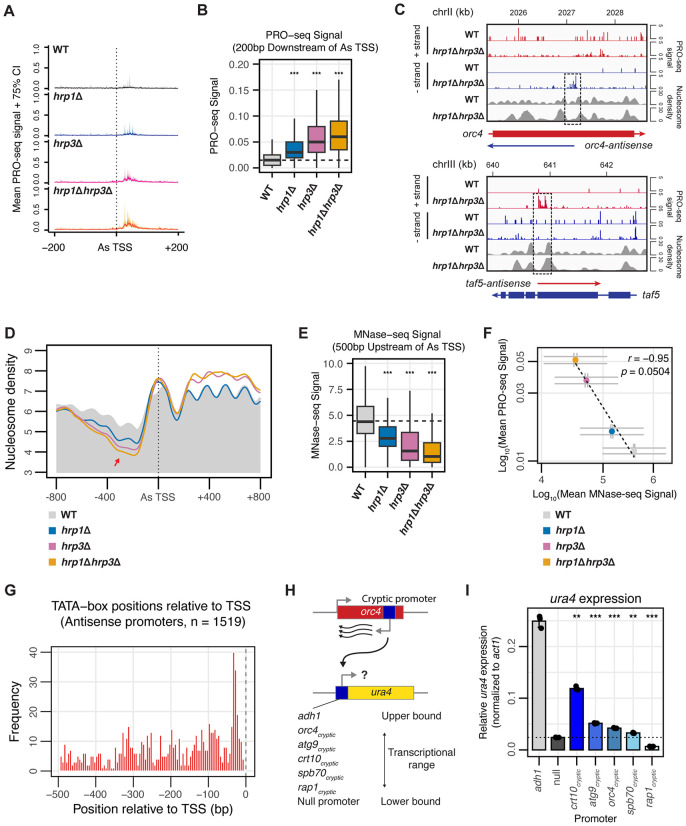
Fig 3 Hrp3 Blocks Cryptic Promoters to Suppress Antisense Transcription. (A) Metagene representation of mean PRO-seq signals (solid lines) with 75% confidence intervals (shaded regions) for WT, hrp1Δ, hrp3Δ, and hrp1Δhrp3Δ mutants across the antisense (As) TSS of 4,678 differentially expressed antisense transcripts. Profiles include 200 bp upstream and downstream of the As-TSS. Data represent the mean signal from two biological replicates. (B) Boxplot of the mean PRO-seq signal in the 200 bp region downstream of the As-TSS of 4,678 differentially expressed antisense transcripts in WT, hrp1Δ, hrp3Δ, and hrp1Δhrp3Δ. The dotted line represents the median PRO-seq signal in WT. Statistical analysis was performed using ANOVA with Tukey’s Honestly Significant Difference (HSD) test. Asterisks indicate statistical significance: p < 0.05 (*), p < 0.01 (**), p < 0.001 (***), n.s. (not significant). (C) Genome browser track of PRO-seq and MNase-seq data for orc4 (top) and taf5 (bottom), representatives of genes with increased antisense transcription in hrp1Δhrp3Δ mutants. PRO-seq signals for the + strand (red) and – strand (blue) are displayed. In the gene schematic, solid boxes represent exons, whereas solid lines represent the entire transcript. The dotted box highlights the region where antisense transcription initiates in the hrp1Δhrp3Δ mutant, coinciding with disrupted nucleosome positioning. (D) Metaplots of normalized nucleosome density from MNase-seq centered on the As-TSS of 4,678 differentially expressed antisense transcripts in WT, hrp1Δ, hrp3Δ, and hrp1Δhrp3Δ. The WT profile is shown in solid grey. The red arrow indicates a loss of nucleosome occupancy preceding the As-TSS. Profiles include 800 bp upstream and downstream of the As-TSS. (E) Boxplot of the mean MNase-seq signal in the 500 bp region upstream of the As-TSS of 4,678 differentially expressed antisense transcripts in WT, hrp1Δ, hrp3Δ, and hrp1Δhrp3Δ. The dotted line represents the median MNase-seq signal in WT. Statistical analysis was performed using ANOVA with Tukey’s Honestly Significant Difference (HSD) test. Asterisks indicate statistical significance: p < 0.05 (*), p < 0.01 (**), p < 0.001 (***), n.s. (not significant). (F) Scatterplot of mean PRO-seq signal in the 200 bp region downstream of the antisense TSS versus mean MNase-seq signal in the 500 bp region upstream of the antisense TSS for WT, hrp1Δ, hrp3Δ, and hrp1Δhrp3Δ. Data is plotted for all 4,678 differentially expressed antisense transcripts between WT and hrp1Δhrp3Δ. Spearman’s correlation and linear regression analysis were performed. Error bars represent the standard error of the mean (SEM). (G) Genomic positions of TATA-box hits relative to the antisense TSS for antisense promoters. Histogram shows the distribution of TATA position weight matrix (PWM) match centers (5 bp bins) within −500 to −1 bp upstream of the TSS (FIMO, p ≤ 1e-4). The dashed vertical line marks the TSS (0 bp). (H) Schematic of the ura4 + reporter system, where the ura4 promoter is replaced with antisense transcription promoters from five different genes, alongside the normal adh1 promoter (positive control) and no promoter (negative control). Constructs were tested for their ability to drive ura4 expression via RT-qPCR. (I) Bar plot showing expression of the ura4 gene relative to the act1 gene by RT-qPCR (2 ⁻ ΔCq) under five different antisense promoters (from H). The adh1 promoter serves as a positive control, while a promoter-deletion strain (null) serves as a negative control. Bars represent mean values from three biological replicates; points indicate individual replicates. The dotted line denotes the mean expression level of the promoter-deletion negative control. Statistical significance was determined using Welch’s t-tests comparing each promoter construct to the promoter-deletion negative control, with Holm correction for multiple testing. Asterisks indicate statistical significance: p < 0.05 (*), p < 0.01 (**), p < 0.001 (***), n.s. (not significant).
Fig 3 Hrp3 Blocks Cryptic Promoters to Suppress Antisense Transcription. (A) Metagene representation of mean PRO-seq signals (solid lines) with 75% confidence intervals (shaded regions) for WT, hrp1Δ, hrp3Δ, and hrp1Δhrp3Δ mutants across the antisense (As) TSS of 4,678 differentially expressed antisense transcripts. Profiles include 200 bp upstream and downstream of the As-TSS. Data represent the mean signal from two biological replicates. (B) Boxplot of the mean PRO-seq signal in the 200 bp region downstream of the As-TSS of 4,678 differentially expressed antisense transcripts in WT, hrp1Δ, hrp3Δ, and hrp1Δhrp3Δ. The dotted line represents the median PRO-seq signal in WT. Statistical analysis was performed using ANOVA with Tukey’s Honestly Significant Difference (HSD) test. Asterisks indicate statistical significance: p < 0.05 (*), p < 0.01 (**), p < 0.001 (***), n.s. (not significant). (C) Genome browser track of PRO-seq and MNase-seq data for orc4 (top) and taf5 (bottom), representatives of genes with increased antisense transcription in hrp1Δhrp3Δ mutants. PRO-seq signals for the + strand (red) and – strand (blue) are displayed. In the gene schematic, solid boxes represent exons, whereas solid lines represent the entire transcript. The dotted box highlights the region where antisense transcription initiates in the hrp1Δhrp3Δ mutant, coinciding with disrupted nucleosome positioning. (D) Metaplots of normalized nucleosome density from MNase-seq centered on the As-TSS of 4,678 differentially expressed antisense transcripts in WT, hrp1Δ, hrp3Δ, and hrp1Δhrp3Δ. The WT profile is shown in solid grey. The red arrow indicates a loss of nucleosome occupancy preceding the As-TSS. Profiles include 800 bp upstream and downstream of the As-TSS. (E) Boxplot of the mean MNase-seq signal in the 500 bp region upstream of the As-TSS of 4,678 differentially expressed antisense transcripts in WT, hrp1Δ, hrp3Δ, and hrp1Δhrp3Δ. The dotted line represents the median MNase-seq signal in WT. Statistical analysis was performed using ANOVA with Tukey’s Honestly Significant Difference (HSD) test. Asterisks indicate statistical significance: p < 0.05 (*), p < 0.01 (**), p < 0.001 (***), n.s. (not significant). (F) Scatterplot of mean PRO-seq signal in the 200 bp region downstream of the antisense TSS versus mean MNase-seq signal in the 500 bp region upstream of the antisense TSS for WT, hrp1Δ, hrp3Δ, and hrp1Δhrp3Δ. Data is plotted for all 4,678 differentially expressed antisense transcripts between WT and hrp1Δhrp3Δ. Spearman’s correlation and linear regression analysis were performed. Error bars represent the standard error of the mean (SEM). (G) Genomic positions of TATA-box hits relative to the antisense TSS for antisense promoters. Histogram shows the distribution of TATA position weight matrix (PWM) match centers (5 bp bins) within −500 to −1 bp upstream of the TSS (FIMO, p ≤ 1e-4). The dashed vertical line marks the TSS (0 bp). (H) Schematic of the ura4 + reporter system, where the ura4 promoter is replaced with antisense transcription promoters from five different genes, alongside the normal adh1 promoter (positive control) and no promoter (negative control). Constructs were tested for their ability to drive ura4 expression via RT-qPCR. (I) Bar plot showing expression of the ura4 gene relative to the act1 gene by RT-qPCR (2 ⁻ ΔCq) under five different antisense promoters (from H). The adh1 promoter serves as a positive control, while a promoter-deletion strain (null) serves as a negative control. Bars represent mean values from three biological replicates; points indicate individual replicates. The dotted line denotes the mean expression level of the promoter-deletion negative control. Statistical significance was determined using Welch’s t-tests comparing each promoter construct to the promoter-deletion negative control, with Holm correction for multiple testing. Asterisks indicate statistical significance: p < 0.05 (*), p < 0.01 (**), p < 0.001 (***), n.s. (not significant).CC BY · PubMed Central
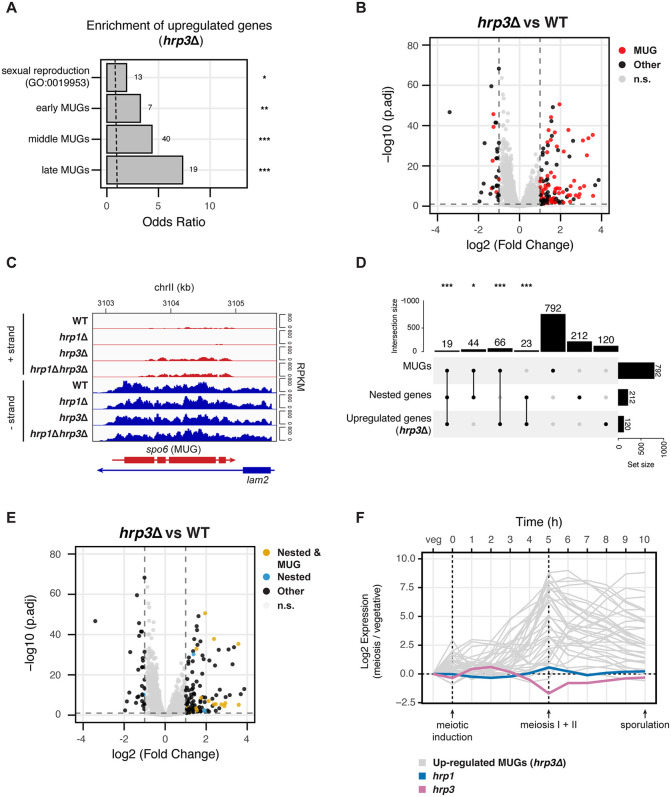
Fig 4 Hrp3-Mediated Antisense Repression Links Nested Gene Architecture to Meiotic Gene Expression in S. pombe. (A) Enrichment analysis of upregulated genes in the hrp3Δ mutant for the sexual reproduction GO term (GO:0019953) and early, middle, and late meiotically upregulated genes (MUGs) as reported by Mata et al. The dashed line indicates an odds ratio of 1. Statistical analysis was performed using Fisher’s exact test. Asterisks indicate statistical significance: p < 0.05 (*), p < 0.01 (**), p < 0.001 (***), n.s. (not significant). (B) Volcano plot representing the differentially expressed genes in hrp3Δ versus WT. MUGs are highlighted in red, while all other genes are in black. Genes in grey do not meet the thresholds for both significance (-log10(p.adj) > 1) and effect size (-1 < log2FC < 1). (C) Genome browser track of mRNA-seq data for the spo6 and lam2 genes in WT, hrp1Δ, hrp3Δ and hrp1Δhrp3Δ. Tracks are separated into the + strand (red) and – strand (blue), with values shown in RPKM. The MUG within the pair is denoted in brackets. (D) UpSet plot showing the overlap between MUGs, convergent nested genes and upregulated genes in hrp3Δ. Statistical analysis was performed using the hypergeometric test. Asterisks indicate statistical significance: p < 0.05 (*), p < 0.01 (**), p < 0.001 (***), n.s. (not significant). (E) Volcano plot representing the differentially expressed genes in hrp3Δ versus WT. Genes which are both convergently nested and MUGs (n = 19) are highlighted in gold, other convergent nested genes (n = 193) are highlighted in blue, and all other genes are in black. Genes in grey do not meet the thresholds for both significance (-log10(p.adj) > 1) and effect size (-1 < log2FC < 1). (F) Line plot showing the temporal expression of hrp1, hrp3, and 35 MUGs upregulated in hrp3Δ at 1-hour intervals during meiosis in S. pombe. Data were obtained from Mata et al. [81].
Fig 4 Hrp3-Mediated Antisense Repression Links Nested Gene Architecture to Meiotic Gene Expression in S. pombe. (A) Enrichment analysis of upregulated genes in the hrp3Δ mutant for the sexual reproduction GO term (GO:0019953) and early, middle, and late meiotically upregulated genes (MUGs) as reported by Mata et al. The dashed line indicates an odds ratio of 1. Statistical analysis was performed using Fisher’s exact test. Asterisks indicate statistical significance: p < 0.05 (*), p < 0.01 (**), p < 0.001 (***), n.s. (not significant). (B) Volcano plot representing the differentially expressed genes in hrp3Δ versus WT. MUGs are highlighted in red, while all other genes are in black. Genes in grey do not meet the thresholds for both significance (-log10(p.adj) > 1) and effect size (-1 < log2FC < 1). (C) Genome browser track of mRNA-seq data for the spo6 and lam2 genes in WT, hrp1Δ, hrp3Δ and hrp1Δhrp3Δ. Tracks are separated into the + strand (red) and – strand (blue), with values shown in RPKM. The MUG within the pair is denoted in brackets. (D) UpSet plot showing the overlap between MUGs, convergent nested genes and upregulated genes in hrp3Δ. Statistical analysis was performed using the hypergeometric test. Asterisks indicate statistical significance: p < 0.05 (*), p < 0.01 (**), p < 0.001 (***), n.s. (not significant). (E) Volcano plot representing the differentially expressed genes in hrp3Δ versus WT. Genes which are both convergently nested and MUGs (n = 19) are highlighted in gold, other convergent nested genes (n = 193) are highlighted in blue, and all other genes are in black. Genes in grey do not meet the thresholds for both significance (-log10(p.adj) > 1) and effect size (-1 < log2FC < 1). (F) Line plot showing the temporal expression of hrp1, hrp3, and 35 MUGs upregulated in hrp3Δ at 1-hour intervals during meiosis in S. pombe. Data were obtained from Mata et al. [81].CC BY · PubMed Central
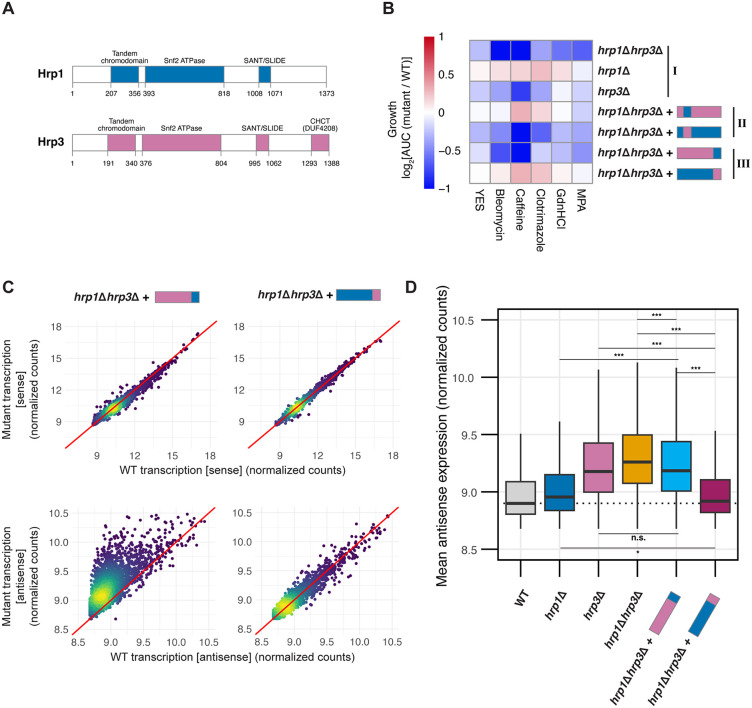
Fig 5 The CHCT Domain of Hrp3 Prevents Antisense Transcription. (A) Heatmap of growth phenotypes across four biological replicates when grown in YES medium alone or supplemented with 25 ng/μl bleomycin, 14 mM caffeine, 200 ng/ml clotrimazole, 5 mM guanidine hydrochloride (GHCl), or 25 μg/ml mycophenolic acid (MPA), represented by log2AUC values of mutants relative to WT. Roman numerals indicate mutant groups: (I) deletion mutants (II) chromodomain-swapped chimeras in the hrp1Δhrp3Δ mutant background, and (III) C-terminus-swapped chimeras in the hrp1Δhrp3Δ mutant background. Data represent the mean growth from four biological replicates. (B) Schematic representation of the protein structures of Hrp1 and Hrp3, including domain annotations with residue start and end positions. (C) Density-colored scatterplots representing mutant (hrp1Δhrp3Δ::hrp3-CThrp1 or hrp1Δhrp3Δ::hrp1-CThrp3) transcription against WT transcription for either sense transcripts (top row) or antisense transcripts (bottom row) for all protein-coding genes. Count data is derived from variance-stabilizing transformation (vst) of raw mRNA-seq counts from three biological replicates. (D) Boxplot of normalized antisense expression counts (as calculated in C) for WT, hrp1Δ, hrp3Δ, hrp1Δhrp3Δ, hrp1Δhrp3Δ::hrp3-CThrp1 and hrp1Δhrp3Δ::hrp1-CThrp3. The dotted line represents the median antisense expression in WT. Statistical analysis was performed using ANOVA with Tukey’s Honestly Significant Difference (HSD) test. Asterisks indicate statistical significance: p < 0.05 (*), p < 0.01 (**), p < 0.001 (***), n.s. (not significant).
Fig 5 The CHCT Domain of Hrp3 Prevents Antisense Transcription. (A) Heatmap of growth phenotypes across four biological replicates when grown in YES medium alone or supplemented with 25 ng/μl bleomycin, 14 mM caffeine, 200 ng/ml clotrimazole, 5 mM guanidine hydrochloride (GHCl), or 25 μg/ml mycophenolic acid (MPA), represented by log2AUC values of mutants relative to WT. Roman numerals indicate mutant groups: (I) deletion mutants (II) chromodomain-swapped chimeras in the hrp1Δhrp3Δ mutant background, and (III) C-terminus-swapped chimeras in the hrp1Δhrp3Δ mutant background. Data represent the mean growth from four biological replicates. (B) Schematic representation of the protein structures of Hrp1 and Hrp3, including domain annotations with residue start and end positions. (C) Density-colored scatterplots representing mutant (hrp1Δhrp3Δ::hrp3-CThrp1 or hrp1Δhrp3Δ::hrp1-CThrp3) transcription against WT transcription for either sense transcripts (top row) or antisense transcripts (bottom row) for all protein-coding genes. Count data is derived from variance-stabilizing transformation (vst) of raw mRNA-seq counts from three biological replicates. (D) Boxplot of normalized antisense expression counts (as calculated in C) for WT, hrp1Δ, hrp3Δ, hrp1Δhrp3Δ, hrp1Δhrp3Δ::hrp3-CThrp1 and hrp1Δhrp3Δ::hrp1-CThrp3. The dotted line represents the median antisense expression in WT. Statistical analysis was performed using ANOVA with Tukey’s Honestly Significant Difference (HSD) test. Asterisks indicate statistical significance: p < 0.05 (*), p < 0.01 (**), p < 0.001 (***), n.s. (not significant).CC BY · PubMed Central
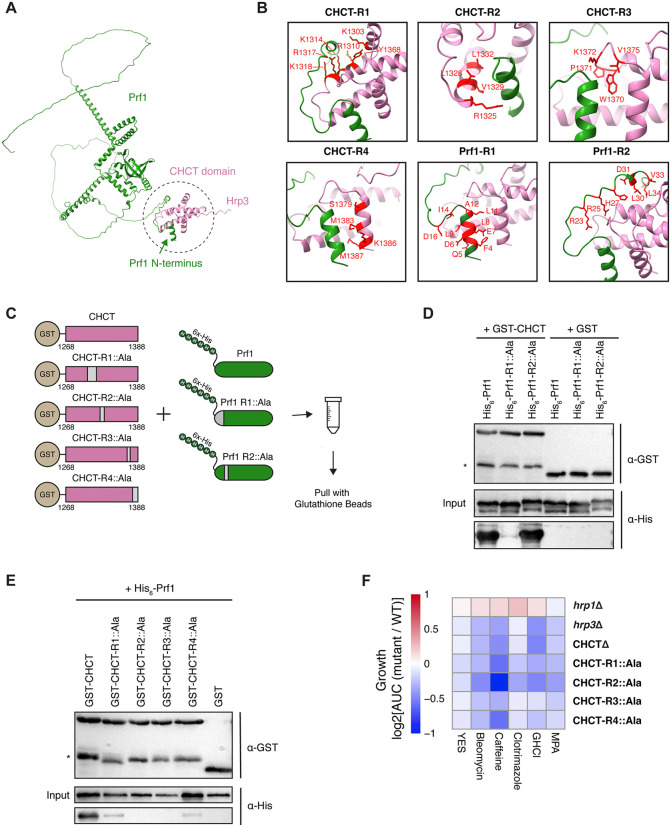
Fig 6 The CHCT Domain of Hrp3 Interacts with the Transcriptional Regulator Prf1. (A) AlphaFold2-predicted structure of the interaction between the N-terminus of Prf1 and the CHCT domain of Hrp3. The predicted binding interface is highlighted with a dotted circle. (B) Close-up views across six AlphaFold2-predicted binding regions between Prf1 (green) and the CHCT domain (pink). Residues involved in the interaction are highlighted in red for each region. (C) Schematic of the in vitro interaction assay. Binding was tested between GST-tagged CHCT (wild-type and alanine mutants) and His-tagged Prf1 (wild-type and alanine mutants). Regions of the proteins with residues mutated to alanine are shown in grey. (D) Western blot showing anti-GST and anti-His signals for GST-pulldowns of GST-CHCT (wild-type or mutated) and wild-type His-Prf1. Asterisk (*) denotes truncated GST-CHCT constructs. (E) Western blot showing anti-GST and anti-His signals for GST-pulldowns for wild- type GST-CHCT with His-Prf1 (wild-type or mutated). Asterisk (*) denotes truncated GST-CHCT constructs. (F) Heatmap of growth phenotypes of hrp1Δ, hrp3Δ, hrp3-CHCTΔ, and in vivo alanine-swapped CHCT mutants (as in panel C) when grown in YES medium alone or supplemented with 25 ng/μl bleomycin, 14 mM caffeine, 200 ng/ml clotrimazole, 5 mM guanidine hydrochloride (GHCl), or 25 μg/ml mycophenolic acid (MPA). Data represent the log2AUC values of mutant growth relative to WT under various stress conditions across four biological replicates.
Fig 6 The CHCT Domain of Hrp3 Interacts with the Transcriptional Regulator Prf1. (A) AlphaFold2-predicted structure of the interaction between the N-terminus of Prf1 and the CHCT domain of Hrp3. The predicted binding interface is highlighted with a dotted circle. (B) Close-up views across six AlphaFold2-predicted binding regions between Prf1 (green) and the CHCT domain (pink). Residues involved in the interaction are highlighted in red for each region. (C) Schematic of the in vitro interaction assay. Binding was tested between GST-tagged CHCT (wild-type and alanine mutants) and His-tagged Prf1 (wild-type and alanine mutants). Regions of the proteins with residues mutated to alanine are shown in grey. (D) Western blot showing anti-GST and anti-His signals for GST-pulldowns of GST-CHCT (wild-type or mutated) and wild-type His-Prf1. Asterisk (*) denotes truncated GST-CHCT constructs. (E) Western blot showing anti-GST and anti-His signals for GST-pulldowns for wild- type GST-CHCT with His-Prf1 (wild-type or mutated). Asterisk (*) denotes truncated GST-CHCT constructs. (F) Heatmap of growth phenotypes of hrp1Δ, hrp3Δ, hrp3-CHCTΔ, and in vivo alanine-swapped CHCT mutants (as in panel C) when grown in YES medium alone or supplemented with 25 ng/μl bleomycin, 14 mM caffeine, 200 ng/ml clotrimazole, 5 mM guanidine hydrochloride (GHCl), or 25 μg/ml mycophenolic acid (MPA). Data represent the log2AUC values of mutant growth relative to WT under various stress conditions across four biological replicates.CC BY · PubMed Central
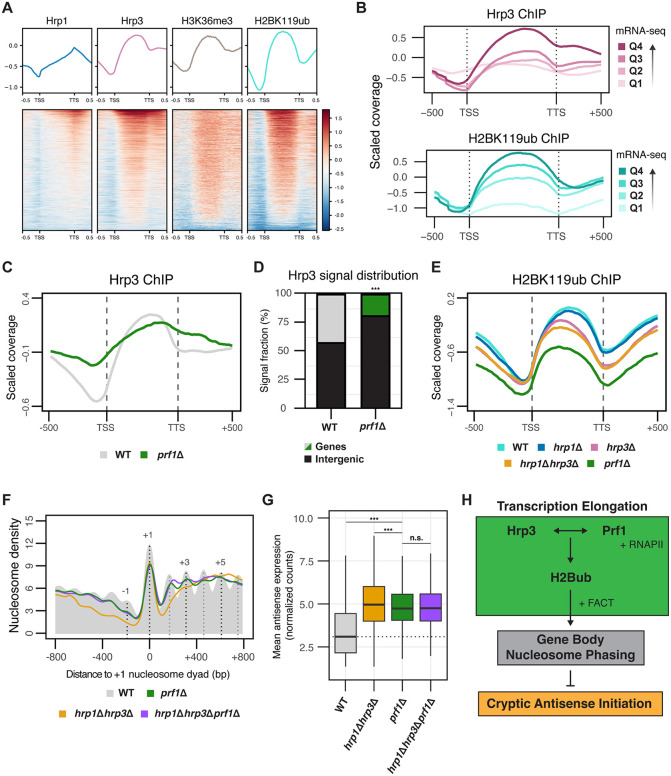
Fig 7 Prf1‑dependent Recruitment of Hrp3 Establishes H2Bub and Nucleosome Phasing to Suppress Antisense Transcription. (A) Metagene profiles and heatmaps showing ChIP-seq enrichment over input for Hrp1, Hrp3, H3K36me3 and H2BK119ub across all protein-coding genes. For Hrp1 and Hrp3, data were obtained using an anti-myc antibody in WT strains carrying myc-tagged Hrp1 and Hrp3. (B) Metagene plot of the ChIP-seq coverage relative to input for Hrp3-myc and H2BK119ub in WT across all protein coding genes. Genes were divided into four quartiles based on expression in WT. Quartiles are numbered by expression level, with Q1 being the lowest and Q4 being the highest. (C) Metagene profiles showing Hrp3 ChIP-seq enrichment over input for WT and prf1Δ across all protein-coding genes. For both strains, data were obtained using an anti-myc antibody in strains carrying myc-tagged Hrp3. (D) Stacked bar plot showing genome‑wide partitioning of Hrp3 ChIP signal between annotated genes and intergenic regions in WT and prf1Δ. Bars show the fraction of total mapped ChIP signal assigned to each category. Statistical analysis was performed using Fisher’s exact test on ChIP-seq counts. Asterisks indicate statistical significance: p < 0.05 (*), p < 0.01 (**), p < 0.001 (***), n.s. (not significant). (E) Metagene plot of H2BK119ub ChIP-seq coverage relative to input for WT, hrp1Δ, hrp3Δ, hrp1Δhrp3Δ and prf1Δ across all protein coding genes. (F) Metaplots of normalized nucleosome density from MNase-seq centered on the + 1 nucleosome dyad for WT, prf1Δ, hrp1Δhrp3Δ and hrp1Δhrp3Δprf1Δ. The WT nucleosome profile is shown in solid grey, with dotted lines indicating the positions of select nucleosome maxima (-1, + 1, + 3 and +5). Profiles include 800 bp upstream and downstream of the + 1 nucleosome dyad for all protein-coding genes. The plotted data represents the average signal from two biological replicates. (G) Boxplot of normalized antisense expression counts for all antisense genes (calculated using vst-normalized raw mRNA-seq counts) for WT, hrp1Δhrp3Δ, prf1Δ and hrp1Δhrp3Δprf1Δ. The dotted line represents the median antisense expression in WT. Data are calculated from three biological replicates. Statistical analysis was performed using ANOVA with Tukey’s Honestly Significant Difference (HSD) test. Asterisks indicate statistical significance: p < 0.05 (*), p < 0.01 (**), p < 0.001 (***), n.s. (not significant). (H) Schematic illustrating the relationship between Hrp3 and Prf1 in the context of H2Bub deposition and nucleosome phasing, and its impact on antisense transcription.
Fig 7 Prf1‑dependent Recruitment of Hrp3 Establishes H2Bub and Nucleosome Phasing to Suppress Antisense Transcription. (A) Metagene profiles and heatmaps showing ChIP-seq enrichment over input for Hrp1, Hrp3, H3K36me3 and H2BK119ub across all protein-coding genes. For Hrp1 and Hrp3, data were obtained using an anti-myc antibody in WT strains carrying myc-tagged Hrp1 and Hrp3. (B) Metagene plot of the ChIP-seq coverage relative to input for Hrp3-myc and H2BK119ub in WT across all protein coding genes. Genes were divided into four quartiles based on expression in WT. Quartiles are numbered by expression level, with Q1 being the lowest and Q4 being the highest. (C) Metagene profiles showing Hrp3 ChIP-seq enrichment over input for WT and prf1Δ across all protein-coding genes. For both strains, data were obtained using an anti-myc antibody in strains carrying myc-tagged Hrp3. (D) Stacked bar plot showing genome‑wide partitioning of Hrp3 ChIP signal between annotated genes and intergenic regions in WT and prf1Δ. Bars show the fraction of total mapped ChIP signal assigned to each category. Statistical analysis was performed using Fisher’s exact test on ChIP-seq counts. Asterisks indicate statistical significance: p < 0.05 (*), p < 0.01 (**), p < 0.001 (***), n.s. (not significant). (E) Metagene plot of H2BK119ub ChIP-seq coverage relative to input for WT, hrp1Δ, hrp3Δ, hrp1Δhrp3Δ and prf1Δ across all protein coding genes. (F) Metaplots of normalized nucleosome density from MNase-seq centered on the + 1 nucleosome dyad for WT, prf1Δ, hrp1Δhrp3Δ and hrp1Δhrp3Δprf1Δ. The WT nucleosome profile is shown in solid grey, with dotted lines indicating the positions of select nucleosome maxima (-1, + 1, + 3 and +5). Profiles include 800 bp upstream and downstream of the + 1 nucleosome dyad for all protein-coding genes. The plotted data represents the average signal from two biological replicates. (G) Boxplot of normalized antisense expression counts for all antisense genes (calculated using vst-normalized raw mRNA-seq counts) for WT, hrp1Δhrp3Δ, prf1Δ and hrp1Δhrp3Δprf1Δ. The dotted line represents the median antisense expression in WT. Data are calculated from three biological replicates. Statistical analysis was performed using ANOVA with Tukey’s Honestly Significant Difference (HSD) test. Asterisks indicate statistical significance: p < 0.05 (*), p < 0.01 (**), p < 0.001 (***), n.s. (not significant). (H) Schematic illustrating the relationship between Hrp3 and Prf1 in the context of H2Bub deposition and nucleosome phasing, and its impact on antisense transcription.CC BY · PubMed Central

Verification

Claims the paper makes

The claims and statistics of this paper haven’t been checked yet.

Run the check — free, no account needed. It reads the open-access text and checks the sources it cites.

A few free checks a day · papers already verified open instantly · results are public

Self-check

Percentages, sums and reported differences re-computed from the paper’s own numbers.

The self-check needs the paper’s full text.

Citations

Cites

Research works printed but not linked: 131

  1. 10.1016/j.molcel.2013.10.032 · DOI
  2. 10.1093/hmg/ddu207 · DOI
  3. 10.1146/annurev.mi.48.100194.003433 · DOI
  4. 10.1038/nrmicro2934 · DOI
  5. Georg, J. & Hess, W. R . Widespread Antisense Transcription in Prokaryotes. Microbiol. Spectr. 6, 6.4.12 (2018). · DOI
  6. 10.1016/j.molbiopara.2004.02.007 · DOI
  7. 2021, Making sense of the natural antisense transcript puzzle, Trends Plant Sci, 26, 1104, 10.1016/j.tplants.2021.07.004 · DOI
  8. 10.1126/science.1112009 · DOI
  9. 10.1101/gr.5210006 · DOI
  10. 10.1038/nrg3594 · DOI
  11. Brown, T. et al. Antisense transcription-dependent chromatin signature modulates sense transcript dynamics. Mol. Syst. Biol. 14, (2018). · DOI
  12. 10.1038/s41576-024-00723-z · DOI
  13. 10.1126/science.1228110 · DOI
  14. 10.1016/j.ygeno.2005.12.006 · DOI
  15. 10.1101/gr.262964.120 · DOI
  16. 10.1101/gr.265603.120 · DOI
  17. 10.1242/jcs.007633 · DOI
  18. 10.1038/nrg3152 · DOI
  19. 10.1038/ng1157 · DOI · Paper page
  20. 10.1101/gr.180596.114 · DOI
  21. 2021, Long non-coding RNAs in motor neuron development and disease, J. Neurochem, 156, 777, 10.1111/jnc.15198 · DOI
  22. 2023, A sense-antisense RNA interaction promotes breast cancer metastasis via regulation of NQO1 expression, Nat. Cancer, 4, 682, 10.1038/s43018-023-00554-7 · DOI
  23. 10.1038/38444 · DOI · Paper page
  24. 10.1016/S0092-8674(00)81958-3 · DOI
  25. 10.1016/j.molcel.2020.07.020 · DOI
  26. 10.1016/0092-8674(87)90561-7 · DOI
  27. 10.1038/nature10799 · DOI · Paper page
  28. 10.1093/nar/gkv149 · DOI
  29. 10.1038/ng1400 · DOI · Paper page
  30. 10.1126/science.1112178 · DOI
  31. 10.1101/gr.242032.118 · DOI
  32. 10.1371/journal.pbio.0060277 · DOI
  33. Tirosh, I. , Sigal, N. & Barkai, N . Widespread remodeling of mid-coding sequence nucleosomes by Isw1. Genome Biol. 11, R49 (2010). · DOI
  34. 10.1093/nar/gku704 · DOI
  35. 10.1038/s41467-021-27285-6 · DOI
  36. 10.1038/ng1046 · DOI
  37. 10.1101/gad.13.6.686 · DOI
  38. 10.1038/nsmb884 · DOI
  39. 10.1074/jbc.M600682200 · DOI
  40. 10.1146/annurev.biochem.77.062706.153223 · DOI
  41. 10.1126/science.1206097 · DOI
  42. 10.1093/nar/gkw068 · DOI
  43. 10.1038/nrm.2017.26 · DOI · Paper page
  44. 10.1038/sj.onc.1210611 · DOI
  45. 10.1111/jipb.12069 · DOI
  46. 10.1111/j.1742-4658.2011.08282.x · DOI
  47. 10.1128/MCB.01035-10 · DOI
  48. 10.1016/j.cell.2012.04.036 · DOI
  49. 10.1371/journal.pgen.1003479 · DOI
  50. 10.1016/j.cell.2016.09.045 · DOI
  51. 10.7554/elife.34100 · DOI
  52. 10.1371/journal.pcbi.1006512 · DOI
  53. 10.1016/j.tibs.2020.08.010 · DOI
  54. 10.1038/nature04290 · DOI
  55. 10.1038/nsmb.2486 · DOI
  56. 10.1042/BST20130145 · DOI
  57. 10.1126/science.1090701 · DOI
  58. 10.1038/nrm3941 · DOI
  59. 2020, The roles of histone variants in fine-tuning chromatin organization and function, Nat. Rev. Mol. Cell Biol, 21, 522, 10.1038/s41580-020-0262-8 · DOI · Paper page
  60. 10.1016/j.cell.2010.10.019 · DOI
  61. 10.1038/embor.2012.146 · DOI
  62. 10.1038/emboj.2012.289 · DOI
  63. 10.1038/emboj.2012.267 · DOI
  64. 10.1101/2020.05.18.102277 · DOI
  65. 10.1016/j.gpb.2015.08.002 · DOI · Paper page
  66. Tillo, D. & Hughes, T. R . G+C content dominates intrinsic nucleosome occupancy. BMC Bioinformatics 10, 442 (2009). · DOI
  67. Neipel, J. , Brandani, G. & Schiessel, H . Translational nucleosome positioning: A computational study. Phys. Rev. E 101, 022405 (2020). · DOI
  68. 10.1002/yea.3701 · DOI
  69. 10.1073/pnas.1315809110 · DOI
  70. 10.1038/nsmb.2392 · DOI
  71. 10.1038/ng951 · DOI
  72. 2018, DNA and chromosome damage induced by bleomycin in mammalian cells: An update, Mutat. Res. Mutat. Res, 775, 51, 10.1016/j.mrrev.2018.02.003 · DOI
  73. 10.1038/S41586-020-2706-X · DOI
  74. 10.1111/jam.12554 · DOI
  75. 10.1126/science.7754373 · DOI
  76. 1995, Mechanism of Action of Mycophenolate Mofetil: Ther, Drug Monit, 17, 681, 10.1097/00007691-199512000-00023 · DOI
  77. 10.1016/j.jmb.2016.08.028 · DOI
  78. 10.1093/gbe/evac066 · DOI
  79. 10.1038/nature24046 · DOI
  80. 10.1038/s41594-021-00578-6 · DOI
  81. 10.1038/nbt1222 · DOI
  82. 10.1093/emboj/cdg179 · DOI
  83. 10.1128/MCB.00772-07 · DOI
  84. 10.1016/j.molcel.2016.10.008 · DOI
  85. 10.1073/pnas.0907862106 · DOI
  86. 10.1534/genetics.112.141713 · DOI
  87. Ardern, Z. , Neuhaus, K. & Scherer, S . Are Antisense Proteins in Prokaryotes Functional? Front. Mol. Biosci. 7, 187 (2020). · DOI
  88. 10.1093/nar/gkv666 · DOI
  89. 10.1371/journal.pgen.0020047 · DOI
  90. 10.1126/science.1163853 · DOI · Paper page
  91. 10.1016/j.cell.2010.11.020 · DOI
  92. 10.1073/pnas.132270899 · DOI
  93. 10.1038/nature13671 · DOI
  94. Ohno, S . Evolution by Gene Duplication. (Springer-Verlag, Berlin, Heidelberg, 1970). · DOI · Paper page
  95. 10.1126/science.290.5494.1151 · DOI · Paper page
  96. 10.1101/gr.101386.109 · DOI
  97. 10.1038/nrg2689 · DOI
  98. 10.1101/2024.12.06.627179 · DOI
  99. Luo, A. et al. H2B ubiquitination recruits FACT to maintain a stable altered nucleosome state for transcriptional activation. Nat. Commun. 14, 741 (2023). · DOI
  100. 10.1016/j.cell.2006.04.029 · DOI
  101. 10.1016/j.molcel.2017.11.015 · DOI
  102. 10.1016/j.molcel.2019.11.016 · DOI
  103. 10.1126/science.abp9466 · DOI
  104. 10.1126/science.adn6319 · DOI
  105. 2020, Timing the origin of eukaryotic cellular complexity with ancient duplications, Nat. Ecol. Evol, 5, 92, 10.1038/s41559-020-01320-z · DOI · Paper page
  106. 10.1016/S0092-8674(04)00127-8 · DOI · Paper page
  107. 10.1002/iub.146 · DOI · Paper page
  108. 2015, Dissecting the contributions of GC content and codon usage to gene expression in the model alga Chlamydomonas reinhardtii, Plant J. Cell Mol. Biol, 84, 704, 10.1111/tpj.13033 · DOI
  109. 10.1016/S0021-9258(19)38525-4 · DOI
  110. 10.1101/pdb.rec091355 · DOI
  111. 10.1002/(SICI)1097-0061(199807)14:10<943::AID-YEA292>3.0.CO;2-Y · DOI
  112. Torres-Garcia, S. et al. SpEDIT: A fast and efficient CRISPR/Cas9 method for fission yeast. Wellcome Open Res. 5, 274 (2020). · DOI
  113. 10.1101/pdb.prot090969 · DOI
  114. 10.1038/nmeth.1318 · DOI
  115. 1988, Genetic engineering of Schizosaccharomyces pombe: A system for gene disruption and replacement using the ura4 gene as a selectable marker, Mol. Gen. Genet. MGG, 215, 81, 10.1007/BF00331307 · DOI
  116. 10.1093/nar/23.22.4742 · DOI
  117. 10.1038/nbt.3519 · DOI · Paper page
  118. Love, M. I. , Huber, W. & Anders, S . Moderated estimation of fold change and dispersion for RNA-seq data with DESeq2. Genome Biol. 15, 550 (2014). · DOI · Paper page
  119. 10.1101/gr.204578.116 · DOI
  120. 10.1093/bioinformatics/bty191 · DOI · Paper page
  121. Kuo, R. I. et al. Illuminating the dark side of the human transcriptome with long read transcript sequencing. BMC Genomics 21, 751 (2020). · DOI
  122. Pertea, G. & Pertea, M. GFF Utilities: GffRead and GffCompare. F1000Research 9, ISCB Comm J-304 (2020). · DOI · Paper page
  123. 10.1016/j.ymeth.2009.02.004 · DOI
  124. 10.1093/nar/gkw257 · DOI · Paper page
  125. 10.1101/2021.10.04.463034 · DOI · Paper page
  126. 10.1038/S41586-024-07487-W · DOI · Paper page
  127. 10.1002/pro.3235 · DOI · Paper page
  128. 10.1101/2024.03.24.586400 · DOI
  129. 10.1038/S41592-022-01488-1 · DOI · Paper page
  130. 10.1093/nar/gkf436 · DOI · Paper page
  131. Emms, D. M. & Kelly, S . OrthoFinder: phylogenetic orthology inference for comparative genomics. Genome Biol. 20, 238 (2019). · DOI · Paper page

Metadata

Authors
Kok, J. Y., Harvey, Z. H., Axelsson, E., & Berger, F.
Affiliations
  • University of Vienna (AT)
  • Gregor Mendel Institute of Molecular Plant Biology (AT)
Corresponding author
Berger, Frédéric
Venue
PLoS Genetics
Publisher
openRxiv
Published
2025-07-18
Volume
22
Issue
3
Pages
e1012078-e1012078
ISSN
1553-7390 (ISSN-L)
OpenAlex
W7135176058
Cited by
2
References
1
Citations by year
2026: 2
FWCI
4.13
Type
journal article
Language
en
Open access
Locations
  • PLoS Genetics (publishedVersion, cc-by)
  • bioRxiv (Cold Spring Harbor Laboratory) (acceptedVersion, cc-by)
  • PubMed Central (publishedVersion, cc-by)
  • PubMed (publishedVersion)
  • DOAJ (DOAJ: Directory of Open Access Journals) (submittedVersion)
Funders
  • European Molecular Biology Organization (ALTF169-2020)
  • Österreichischen Akademie der Wissenschaften
  • Austrian Science Fund (TAI 304, PAT6138924, PAT 1104523, ESP 213, P 32054, P36231)
  • Sungkyunkwan University
Topics
  • Life Sciences › Biochemistry, Genetics and Molecular Biology › Molecular Biology › Genomics and Chromatin Dynamics
  • Life Sciences › Biochemistry, Genetics and Molecular Biology › Molecular Biology › Nuclear Structure and Function
  • Life Sciences › Biochemistry, Genetics and Molecular Biology › Molecular Biology › Chromatin Remodeling and Cancer
Keywords
nucleosome positioning, nucleosome remodeling, transcription elongation, gene body, transcriptional fidelity, AT-rich sequences, meiotic genes, Schizosaccharomyces pombe, transcriptional regulation
MeSH terms
Chromatin, Meiosis, Nucleosomes, Promoter Regions, Genetic, Schizosaccharomyces, Transcription Factors, Transcription, Genetic, Gene Expression Regulation, Fungal, RNA, Antisense, Schizosaccharomyces pombe Proteins, Chromatin Assembly and Disassembly, Genomic Instability

About these checks

Registry, retraction, Cites and statistics results are computed, not judged, with one exception: a printed reference that no index lists is read once by a model before it counts as a citation error. Claims are extracted by a model and kept only when their quote appears verbatim in the text; each cited source is then checked, with a model’s help, for whether it says what the claim relies on. Those verdicts can be wrong — read the claim’s quote and the cited source before relying on one.

Statistics and arithmetic are recomputed, not judged.

Confidence bands are shown only for fields calibrated on our annotated test set. None is calibrated yet, so no band is shown.

What counts as a claim ›How we measure confidence ›How we check this ›

Are you an author, or do you see a problem with this page? Request a review