PreprintCited by 0MicroRNA in disease regulationAutophagy in Disease and TherapyPI3K/AKT/mTOR signaling in cancer

The DOI matches its Crossref record; 1 of the 1 references it cites were found in a registry or an index.

Drosophila melanogaster miPEP8 regulates cell size through its interaction with ref(2)P/p62

Open access

Preprint — published as 10.1016/j.mcpro.2026.101544

Abstract

MiPEPs are microproteins encoded by primary transcripts of microRNAs (pri-miRNAs). Initially identified in plants, we recently characterized a miPEP in Drosophila melanogaster , named miPEP8, which is involved in the regulation of wing size. However, mechanisms at play are unknown. In the present study, we take advantage of the drosophila cell line Schneider 2 (S2) to further investigate miPEP8 function at the molecular level. Overexpressing miPEP8 in S2 cells induced a reduction of cell size as well as an increase of the proportion of cells in the G1 phase of the cell cycle and an increase of the autophagic flux. A proteomics analysis revealed that miPEP8 overexpression in S2 cells induces the upregulation of several proteins including the autophagosome cargo protein ref(2)P (the orthologue of the human p62/Sequestosome 1 protein). The interactome of miPEP8 was generated and revealed interactions between this miPEP8 and the mTORC1/autophagy pathway. Bioinformatics analysis identified a short linear motif (SLiM) on miPEP8 sequence. Mutation of this SLiM prevented the interaction between ref(2)P/p62 and miPEP8. Mutation of the SLiM also reverted the smaller cell size phenotype observed when overexpressing miPEP8 in S2 cells. Finally, the cell size phenotype was reversed when cells were treated with RNA interference targeting ref(2)P/p62, suggesting that this protein plays a role in regulating the cell size in Drosophila.

Overview

The claims and statistics of this paper haven’t been checked yet.

Run the check — free, no account needed. It reads the open-access text and checks the sources it cites.

A few free checks a day · papers already verified open instantly · results are public

Integrity signals

Registry

Crossref · 10.1101/2025.07.17.665293

Cites

1 of 1 references verified0 citation errors · 0 not checkable

Statistics

Figures

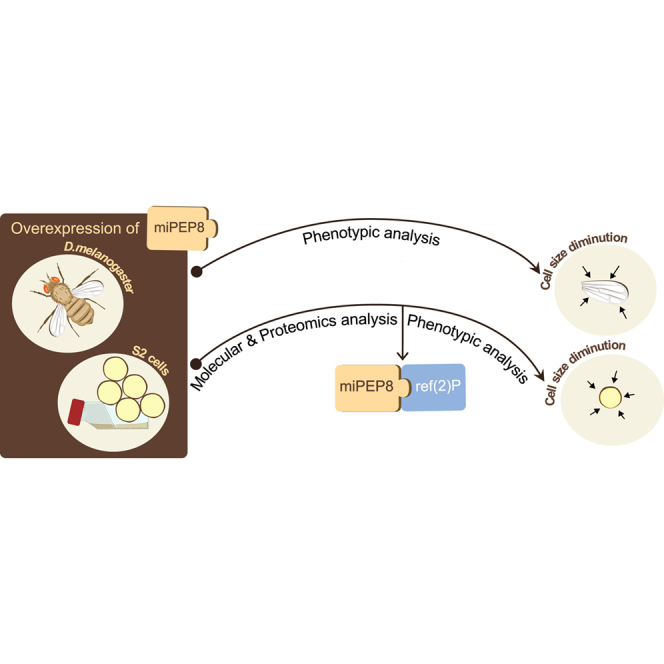
Graphical abstract
Graphical abstract CC BY · PubMed Central
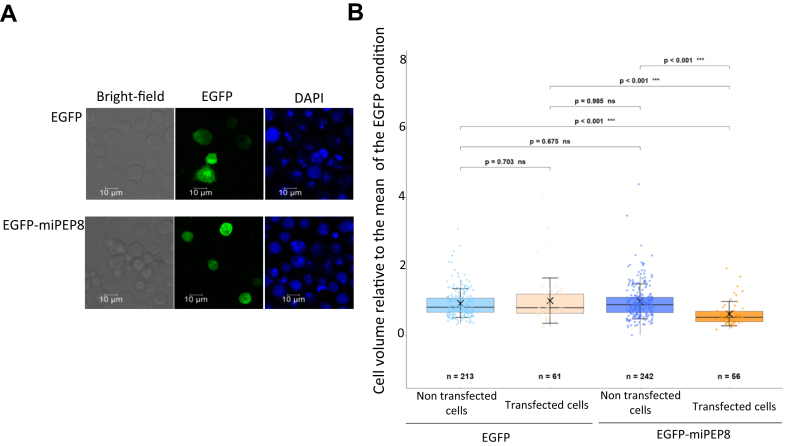
Fig. 1 Overexpression of miPEP8 decreases S2 cell size.A, 2 cells were transfected with a plasmid encoding either the EGFP or EGFP fused to miPEP8 (EGFP-miPEP8). Cells were stained with DAPI and observed by confocal microscopy. B, the size of the S2 cells expressing either EGFP or EGFP-miPEP8 was measured and normalized to the mean of the measured EGFP cell size. The p-values were calculated using a one-way ANOVA (Analysis of Variance), and for groups comparison, a Tukey's HSD (Honestly Significant Difference) test was performed (n = 213, 61, 242 and 56 for EGFP non-transfected, EGFP-transfected, EGFP-miPEP8 non-transfected, and EGFP-miPEP8-transfected cells, respectively, from 3 independent experiments).
Fig. 1 Overexpression of miPEP8 decreases S2 cell size.A, 2 cells were transfected with a plasmid encoding either the EGFP or EGFP fused to miPEP8 (EGFP-miPEP8). Cells were stained with DAPI and observed by confocal microscopy. B, the size of the S2 cells expressing either EGFP or EGFP-miPEP8 was measured and normalized to the mean of the measured EGFP cell size. The p-values were calculated using a one-way ANOVA (Analysis of Variance), and for groups comparison, a Tukey's HSD (Honestly Significant Difference) test was performed (n = 213, 61, 242 and 56 for EGFP non-transfected, EGFP-transfected, EGFP-miPEP8 non-transfected, and EGFP-miPEP8-transfected cells, respectively, from 3 independent experiments).CC BY · PubMed Central
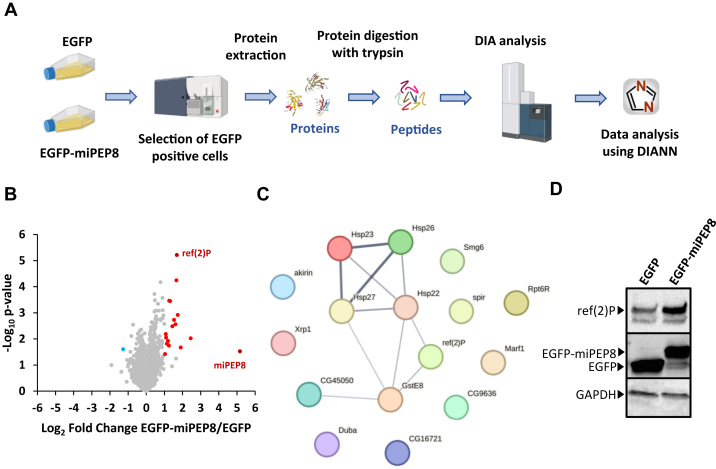
Fig. 2 Data independent analysis proteomics workflow to identify proteins differentially regulated in S2 cells upon overexpression of miPEP8.A, S2 cells were transfected with EGFP or EGFP-miPEP8 (n = 3 each) and the cells expressing the fluorescent protein were selected by fluorescence-activated cell sorting. Proteins were extracted and digested with trypsin and resulting peptides were run in data-independent acquisition mode on a TIMS-TOF SCP mass spectrometer (Bruker). The resulting.d files were analyzed with DIANN. B, Volcano plot representing the log2 ratio (EGFP-miPEP8/EGFP) for each protein quantified and the corresponding p-value obtained from a Welch's t test. The blue, red, and gray dots represent the proteins more abundant in the cells expressing EGFP, more abundant in the cells expressing EGFP-miPEP8, or not differentially expressed between the two conditions, respectively. The protein ref(2)P/p62 is displayed in black on the volcano plot. C, STRING network of the proteins more abundant in the EGFP-miPEP8 condition. The line thickness between two proteins indicates the strength of data support. D, Western blot analysis for ref(2)P/p62, GFP and GAPDH were performed on the lysates of S2 cells expressing EGFP or EGFP-miPEP8.
Fig. 2 Data independent analysis proteomics workflow to identify proteins differentially regulated in S2 cells upon overexpression of miPEP8.A, S2 cells were transfected with EGFP or EGFP-miPEP8 (n = 3 each) and the cells expressing the fluorescent protein were selected by fluorescence-activated cell sorting. Proteins were extracted and digested with trypsin and resulting peptides were run in data-independent acquisition mode on a TIMS-TOF SCP mass spectrometer (Bruker). The resulting.d files were analyzed with DIANN. B, Volcano plot representing the log2 ratio (EGFP-miPEP8/EGFP) for each protein quantified and the corresponding p-value obtained from a Welch's t test. The blue, red, and gray dots represent the proteins more abundant in the cells expressing EGFP, more abundant in the cells expressing EGFP-miPEP8, or not differentially expressed between the two conditions, respectively. The protein ref(2)P/p62 is displayed in black on the volcano plot. C, STRING network of the proteins more abundant in the EGFP-miPEP8 condition. The line thickness between two proteins indicates the strength of data support. D, Western blot analysis for ref(2)P/p62, GFP and GAPDH were performed on the lysates of S2 cells expressing EGFP or EGFP-miPEP8.CC BY · PubMed Central
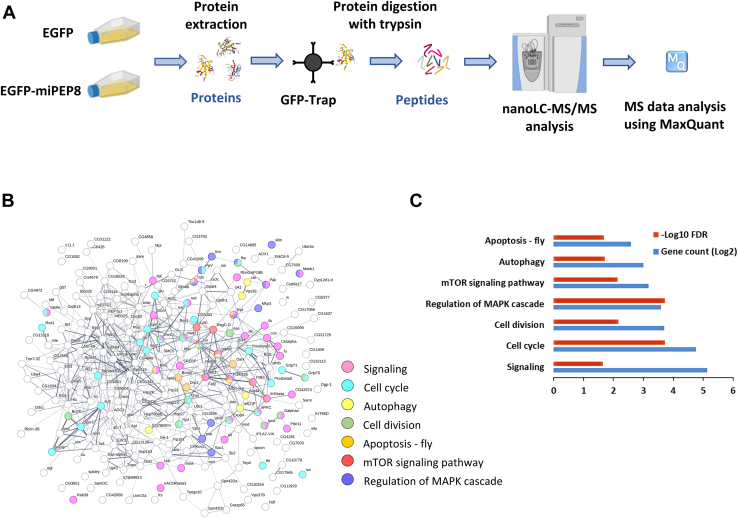
Fig. 3 The interactome of miPEP8 reveals its interaction with a wide range of cellular pathways.A, S2 cells were transfected with EGFP or EGFP-miPEP8 (n = 3 for EGFP-miPEP8 and n = 4 for EGFP) and proteins were extracted and subjected to a GFP-Trap agarose beads (Chromotek) precipitation. After elution, proteins were concentrated in one band on SDS-PAGE and digested with trypsin and resulting peptides were run in data-dependent acquisition mode on a Q Exactive plus mass spectrometer (Thermofisher). The resulting raw files were analyzed with MaxQuant. B, STRING network of the proteins found as interacting with EGFP-miPEP8. The proteins belonging to the pathways found enriched by STRING were displayed with different colors. The line thickness between two proteins indicates the strength of data support. C, GO term analysis using STRING for the proteins interacting with miPEP8. The number of proteins identified in each pathway (gene count, log2 transformed) and the corresponding p-value (−log10 transformed) are represented on the graphs.
Fig. 3 The interactome of miPEP8 reveals its interaction with a wide range of cellular pathways.A, S2 cells were transfected with EGFP or EGFP-miPEP8 (n = 3 for EGFP-miPEP8 and n = 4 for EGFP) and proteins were extracted and subjected to a GFP-Trap agarose beads (Chromotek) precipitation. After elution, proteins were concentrated in one band on SDS-PAGE and digested with trypsin and resulting peptides were run in data-dependent acquisition mode on a Q Exactive plus mass spectrometer (Thermofisher). The resulting raw files were analyzed with MaxQuant. B, STRING network of the proteins found as interacting with EGFP-miPEP8. The proteins belonging to the pathways found enriched by STRING were displayed with different colors. The line thickness between two proteins indicates the strength of data support. C, GO term analysis using STRING for the proteins interacting with miPEP8. The number of proteins identified in each pathway (gene count, log2 transformed) and the corresponding p-value (−log10 transformed) are represented on the graphs.CC BY · PubMed Central
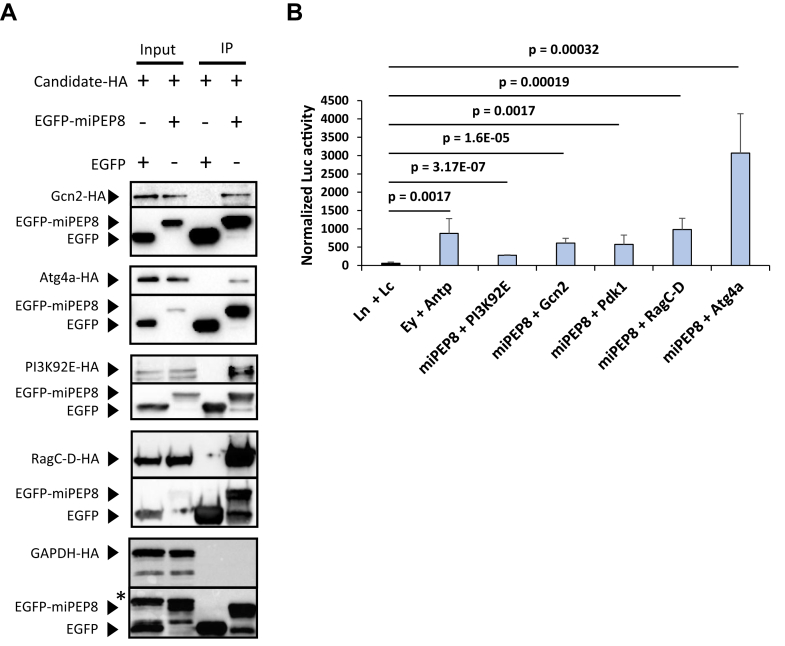
Fig. 4 Validation of the interaction between miPEP8 and proteins involved in the autophagy and intracellular signaling pathways.A, co-immunoprecipitation experiments were performed after lysis of S2 cells transfected with plasmids encoding miPEP8 interacting candidates fused with a HA tag and plasmids encoding either EGFP or EGFP-miPEP8 (n = 3 for each candidate). Western blot analysis for HA and GFP were performed. B, S2 cells were transfected with plasmids expressing miPEP8 fused with the N-terminal fragment of the luciferase and each protein candidate fused with the C-terminal fragment of the luciferase. In the case of addition of a competitor (Comp), S2 cells were also transfected with a plasmid encoding the corresponding candidate fused with a HA tag (and not fused to the C-terminal fragment of the luciferase). The N-terminal (Ln) and C-terminal (Lc) of the luciferase not fused to any proteins were used as negative control. The proteins eyeless (Ey) and Antenapedia (Antp) were used as positive control of interacting proteins. The p-value was calculated using a Welch's t test (n = 7 for each candidate except PI3K92 E for which n = 3).
Fig. 4 Validation of the interaction between miPEP8 and proteins involved in the autophagy and intracellular signaling pathways.A, co-immunoprecipitation experiments were performed after lysis of S2 cells transfected with plasmids encoding miPEP8 interacting candidates fused with a HA tag and plasmids encoding either EGFP or EGFP-miPEP8 (n = 3 for each candidate). Western blot analysis for HA and GFP were performed. B, S2 cells were transfected with plasmids expressing miPEP8 fused with the N-terminal fragment of the luciferase and each protein candidate fused with the C-terminal fragment of the luciferase. In the case of addition of a competitor (Comp), S2 cells were also transfected with a plasmid encoding the corresponding candidate fused with a HA tag (and not fused to the C-terminal fragment of the luciferase). The N-terminal (Ln) and C-terminal (Lc) of the luciferase not fused to any proteins were used as negative control. The proteins eyeless (Ey) and Antenapedia (Antp) were used as positive control of interacting proteins. The p-value was calculated using a Welch's t test (n = 7 for each candidate except PI3K92 E for which n = 3).CC BY · PubMed Central
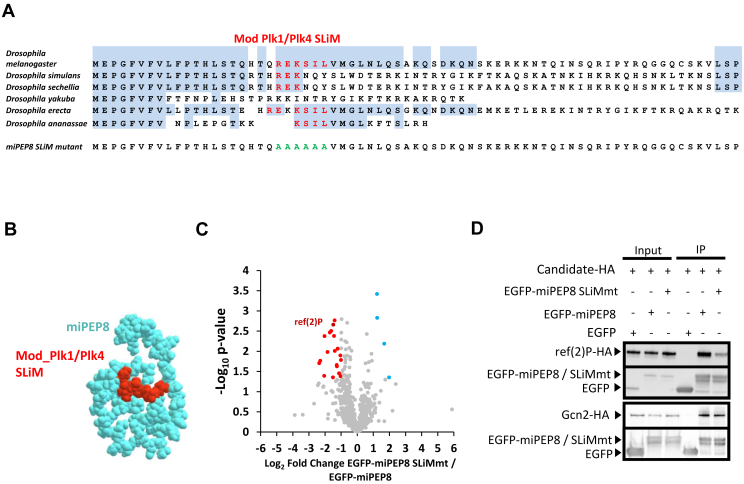
Fig. 5 A MOD_Plk1/MOD_Plk4 SLiM on miPEP8 is involved in its interaction with the protein ref(2)P/p62.A, amino acid sequence of miPEP8 and its mutant. The sequences corresponding to the MOD_Plk1/MOD_Plk4 SLiM and the resulting sequence in the mutant (miPEP8 SLiMmt) are shown in red. B, predicted structure of miPEP8 generated using RoseTTAFold2. C, volcano plot representing the log2 ratio (EGFP-miPEP8 SLiMmt/EGFP-miPEP8) for each protein quantified in the EGFP-miPEP8 SLiMmt or EGFP-miPEP8 immunoprecipitations (IPs) and the corresponding p-value obtained from a Welch's t test (n = 4). The blue, red, and gray dots represent the proteins more abundant in the EGFP-miPEP8 IP, more abundant in EGFP-miPEP8 SLiMmt IP, or not differentially associated between the two conditions, respectively. The proteins ref(2)P/p62 and Gcn2 are displayed in dark blue on the volcano plot. D, co-immunoprecipitation experiments were performed after lysis of S2 cells transfected with plasmids encoding ref(2)P-HA or Gcn2-HA and plasmids encoding either EGFP, EGFP-miPEP8 or EGFP-miPEP8 SLiMmt (n = 3). Western blot analysis for HA and GFP were performed.
Fig. 5 A MOD_Plk1/MOD_Plk4 SLiM on miPEP8 is involved in its interaction with the protein ref(2)P/p62.A, amino acid sequence of miPEP8 and its mutant. The sequences corresponding to the MOD_Plk1/MOD_Plk4 SLiM and the resulting sequence in the mutant (miPEP8 SLiMmt) are shown in red. B, predicted structure of miPEP8 generated using RoseTTAFold2. C, volcano plot representing the log2 ratio (EGFP-miPEP8 SLiMmt/EGFP-miPEP8) for each protein quantified in the EGFP-miPEP8 SLiMmt or EGFP-miPEP8 immunoprecipitations (IPs) and the corresponding p-value obtained from a Welch's t test (n = 4). The blue, red, and gray dots represent the proteins more abundant in the EGFP-miPEP8 IP, more abundant in EGFP-miPEP8 SLiMmt IP, or not differentially associated between the two conditions, respectively. The proteins ref(2)P/p62 and Gcn2 are displayed in dark blue on the volcano plot. D, co-immunoprecipitation experiments were performed after lysis of S2 cells transfected with plasmids encoding ref(2)P-HA or Gcn2-HA and plasmids encoding either EGFP, EGFP-miPEP8 or EGFP-miPEP8 SLiMmt (n = 3). Western blot analysis for HA and GFP were performed.CC BY · PubMed Central
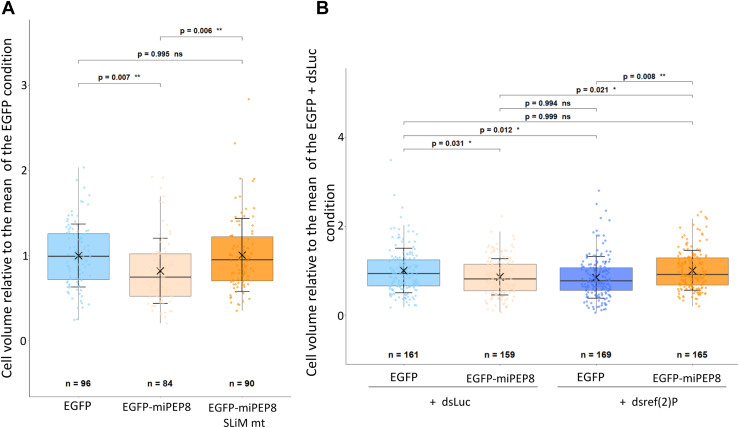
Fig. 6 Mutation of the MOD_Plk1/MOD_Plk4 SLiM on miPEP8 or knocking down ref(2)P expression reverse the reduction of S2 cell size observed upon overexpression of miPEP8.A, the size of the S2 cells expressing either EGFP, EGFP-miPEP8 or EGFP-miPEP8 SLiMmt was measured and normalized to the mean of the measured EGFP cell size (n = 96, 84 and 90 for EGFP, EGFP-miPEP8 and EGFP-miPEP8 SLiMmt expressing cells, respectively, from 3 independent experiments). B, the size of the S2 cells expressing either EGFP or EGFP-miPEP8 and treated with either Luciferase (dsLuc) or ref(2)P (dsref(2)P) dsRNAs (RNA interference) was measured and normalized to the mean of the measured EGFP dsLuc cell size. The p-values for (A and B) were calculated using a one-way ANOVA (Analysis of Variance) and for groups comparison a Tukey's HSD (Honestly Significant Difference) test was performed (n = 161, 159, 169 and 165 for EGFP dsLuc, EGFP-miPEP8 dsLuc, EGFP dsref(2)P and EGFP-miPEP8 dsref(2)P expressing cells, respectively, from 3 independent experiments).
Fig. 6 Mutation of the MOD_Plk1/MOD_Plk4 SLiM on miPEP8 or knocking down ref(2)P expression reverse the reduction of S2 cell size observed upon overexpression of miPEP8.A, the size of the S2 cells expressing either EGFP, EGFP-miPEP8 or EGFP-miPEP8 SLiMmt was measured and normalized to the mean of the measured EGFP cell size (n = 96, 84 and 90 for EGFP, EGFP-miPEP8 and EGFP-miPEP8 SLiMmt expressing cells, respectively, from 3 independent experiments). B, the size of the S2 cells expressing either EGFP or EGFP-miPEP8 and treated with either Luciferase (dsLuc) or ref(2)P (dsref(2)P) dsRNAs (RNA interference) was measured and normalized to the mean of the measured EGFP dsLuc cell size. The p-values for (A and B) were calculated using a one-way ANOVA (Analysis of Variance) and for groups comparison a Tukey's HSD (Honestly Significant Difference) test was performed (n = 161, 159, 169 and 165 for EGFP dsLuc, EGFP-miPEP8 dsLuc, EGFP dsref(2)P and EGFP-miPEP8 dsref(2)P expressing cells, respectively, from 3 independent experiments).CC BY · PubMed Central
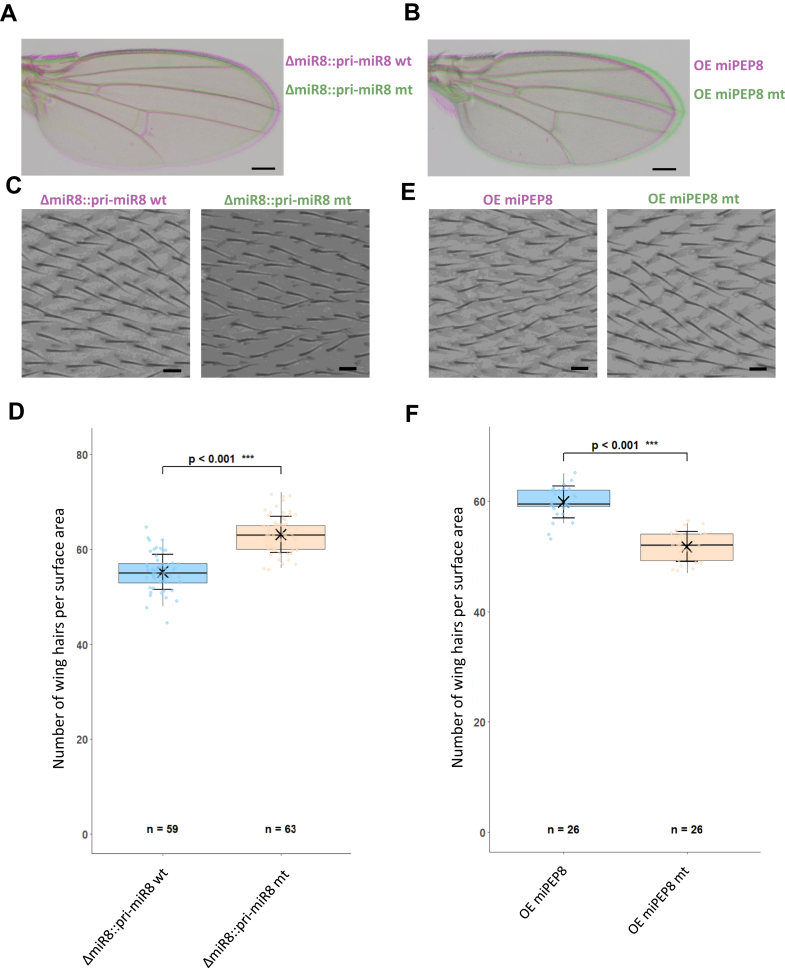
Fig. 7 Mutation or overexpression of miPEP8 in flies decreases wing cell size.A, representative pictures of wing from flies expressing either a wt primiR8 rescued construct (ΔmiR8::pri-miR8 wt, pink) or a miPEP8 mutated primiR8 rescue construct (ΔmiR8::pri-miR8 mt, green) (bar = 200 μm). The pri-miR-8 miPEP-8 mutated (untranslatable miPEP8) shows a reduced wing compared to the wild type pri-miR-8 (n = 3). B, representative pictures of wing of flies overexpressing either miPEP8 (OE miPEP8, pink) and an untranslatable miPEP8 mutated line (OE miPEP8 mt, green) fly (bar = 200 μm). Overexpression of miPEP8 induced a reduced wing compared to the control line expressing the same construct unable to translate miPEP8 (n = 3). Expression of miPEP8 in wing was directed by the MS1096-GAL4 driver (27). C, magnification of the wing L3-L4 intervein region showing wing hairs (one hair/cell) from flies expressing either a wt primiR8 rescued construct (ΔmiR8::pri-miR8 wt) or a miPEP8 mutated primiR8 rescue construct (ΔmiR8::pri-miR8 mt) (bar = 10 μm). D, quantification of the number of hair/cells in 0.01 mm2 wing areas from flies from flies expressing either a wt primiR8 rescued construct (ΔmiR8::pri-miR8 wt) or a miPEP8 mutated primiR8 rescue construct (ΔmiR8::pri-miR8 mt). The statistical significance was calculated using a student's t test. E, magnification of the wing L3-L4 intervein region showing wing hairs (one hair/cell) from flies overexpressing either miPEP8 (OE miPEP8) and an untranslatable miPEP8 mutated line (OE miPEP8 mt) (bar = 10 μm). Expression of miPEP8 in wing was directed by the MS1096-GAL4 driver (27). F, quantification of the number of hair/cells in 0.01 mm2 wing areas from flies from flies overexpressing either miPEP8 (OE miPEP8) and an untranslatable miPEP8 mutated line (OE miPEP8 mt). The statistical significance was calculated using a student's t test (n for each condition is indicated on the graph).
Fig. 7 Mutation or overexpression of miPEP8 in flies decreases wing cell size.A, representative pictures of wing from flies expressing either a wt primiR8 rescued construct (ΔmiR8::pri-miR8 wt, pink) or a miPEP8 mutated primiR8 rescue construct (ΔmiR8::pri-miR8 mt, green) (bar = 200 μm). The pri-miR-8 miPEP-8 mutated (untranslatable miPEP8) shows a reduced wing compared to the wild type pri-miR-8 (n = 3). B, representative pictures of wing of flies overexpressing either miPEP8 (OE miPEP8, pink) and an untranslatable miPEP8 mutated line (OE miPEP8 mt, green) fly (bar = 200 μm). Overexpression of miPEP8 induced a reduced wing compared to the control line expressing the same construct unable to translate miPEP8 (n = 3). Expression of miPEP8 in wing was directed by the MS1096-GAL4 driver (27). C, magnification of the wing L3-L4 intervein region showing wing hairs (one hair/cell) from flies expressing either a wt primiR8 rescued construct (ΔmiR8::pri-miR8 wt) or a miPEP8 mutated primiR8 rescue construct (ΔmiR8::pri-miR8 mt) (bar = 10 μm). D, quantification of the number of hair/cells in 0.01 mm2 wing areas from flies from flies expressing either a wt primiR8 rescued construct (ΔmiR8::pri-miR8 wt) or a miPEP8 mutated primiR8 rescue construct (ΔmiR8::pri-miR8 mt). The statistical significance was calculated using a student's t test. E, magnification of the wing L3-L4 intervein region showing wing hairs (one hair/cell) from flies overexpressing either miPEP8 (OE miPEP8) and an untranslatable miPEP8 mutated line (OE miPEP8 mt) (bar = 10 μm). Expression of miPEP8 in wing was directed by the MS1096-GAL4 driver (27). F, quantification of the number of hair/cells in 0.01 mm2 wing areas from flies from flies overexpressing either miPEP8 (OE miPEP8) and an untranslatable miPEP8 mutated line (OE miPEP8 mt). The statistical significance was calculated using a student's t test (n for each condition is indicated on the graph).CC BY · PubMed Central

Verification

Claims the paper makes

The claims and statistics of this paper haven’t been checked yet.

Run the check — free, no account needed. It reads the open-access text and checks the sources it cites.

A few free checks a day · papers already verified open instantly · results are public

Self-check

Percentages, sums and reported differences re-computed from the paper’s own numbers.

The self-check needs the paper’s full text.

Citations

Cites

Research works printed but not linked: 55

  1. 10.1016/j.cbpa.2020.12.002 · DOI
  2. Azam, S. , Yang, F. , and Wu, X . (2025) Finding functional microproteins. Trends in Genetics, · DOI
  3. 2022, In Depth Exploration of the Alternative Proteome of Drosophila melanogaster, Front Cell Dev Biol, 10, 1
  4. de Souza, E. V. , Dalberto, P. F. , Miranda, A. C. , Saghatelian, A. , Pinto, A. M. , Basso, L. A. , Machado, P. , and Bizarro, C. V. (2024) Large-scale proteogenomics characterization of microproteins in Mycobacterium tuberculosis. Sci Rep 14, · DOI
  5. Torres, M. D. T. , Brooks, E. F. , Cesaro, A. , Sberro, H. , Gill, M. O. , Nicolaou, C. , Bhatt, A. S. , and de la Fuente-Nunez, C. (2024) Mining human microbiomes reveals an untapped source of peptide antibiotics. Cell, · DOI
  6. 10.1126/science.aba3798 · DOI
  7. 2020, Large-Scale Discovery of Non-conventional Peptides in Maize and Arabidopsis through an Integrated Peptidogenomic Pipeline, Mol Plant, 13, 1078, 10.1016/j.molp.2020.05.012 · DOI
  8. 10.1038/ncb1595 · DOI
  9. 10.1126/science.1188158 · DOI
  10. Chanut-Delalande, H. , and Zanet, J . (2024) Small ORFs, Big Insights: Drosophila as a Model to Unraveling Microprotein Functions. Cells 13, · DOI
  11. 10.1038/nature06498 · DOI
  12. 10.1101/gr.213694.116 · DOI
  13. Becker, K. , Bluhm, A. , Casas-Vila, N. , Dinges, N. , Dejung, M. , Sayols, S. , Kreutz, C. , Roignant, J. Y. , Butter, F. , and Legewie, S . (2018) Quantifying post-transcriptional regulation in the development of Drosophila melanogaster. Nat Commun 9, · DOI
  14. Fabre, B. , Korona, D. , Lees, J. G. , Lazar, I. , Livneh, I. , Brunet, M. , Orengo, C. A. , Russell, S. , and Lilley, K. S . (2019) Comparison of Drosophila melanogaster Embryo and Adult Proteome by SWATH-MS Reveals Differential Regulation of Protein Synthesis, Degradation Machinery, and Metabolism Modules. J Proteome Res 18, · DOI
  15. 10.1002/pmic.201700023 · DOI
  16. 10.1002/pmic.201500482 · DOI
  17. 10.1038/nbt1300 · DOI
  18. Kumar, M. , Has, C. , Lam-Kamath, K. , Ayciriex, S. , Dewett, D. , Bashir, M. , Poupault, C. , Schuhmann, K. , Thomas, H. , Knittelfelder, O. , Raghuraman, B. K. , Ahrends, R. , Rister, J. , and Shevchenko, A . (2024) Eye proteome of Drosophila melanogaster. Proteomics 24, · DOI
  19. Wang, Z. , Pan, N. , Yan, J. , Wan, J. , and Wan, C . (2022) Systematic Identification of Microproteins during the Development of Drosophila melanogaster. J Proteome Res, acs.jproteome.2c-00004 · DOI
  20. Platero, A. I. , Pueyo, J. I. , Bishop, S. A. , Magny, E. G. , and Couso, J. P . (2024) Pervasiveness of Microprotein Function Amongst Drosophila Small Open Reading Frames (SMORFS). Cells 13, · DOI
  21. Bosch, J. A. , Keith, N. , Escobedo, F. , Fisher, W. W. , LaGraff, J. T. , Rabasco, J. , Wan, K. H. , Weiszmann, R. , Hu, Y. , Kondo, S. , Brown, J. B. , Perrimon, N. , and Celniker, S. E . (2023) Molecular and functional characterization of the Drosophila melanogaster conserved smORFome. Cell Rep 42, · DOI
  22. Immarigeon, C. , Frei, Y. , Delbare, S. Y. N. , Gligorov, D. , Almeida, P. M. , Grey, J. , Fabbro, L. , Nagoshi, E. , Billeter, J. C. , Wolfner, M. F. , Karch, F. , and Maeda, R. K . (2021) Identification of a micropeptide and multiple secondary cell genes that modulate Drosophila male reproductive success. Proc Natl Acad Sci U S A 118, · DOI
  23. 10.1186/s13059-020-02238-2 · DOI
  24. 10.1038/nature14346 · DOI
  25. Ormancey, M. , Thuleau, P. , Combier, J. P. , and Plaza, S . (2023) The Essentials on microRNA-Encoded Peptides from Plants to Animals. Biomolecules 13, · DOI
  26. Prel, A. , Dozier, C. , Combier, J. P. , Plaza, S. , and Besson, A . (2021) Evidence that regulation of pri-mirna/mirna expression is not a general rule of mipeps function in humans. Int J Mol Sci 22, · DOI
  27. Dozier, C. , and Plaza, S. (2022) Functions of animal microRNA-encoded peptides: the race is on! EMBO Rep 23 · DOI
  28. 10.1016/j.cell.2009.11.020 · DOI
  29. 10.1016/j.cell.2012.01.019 · DOI
  30. Vakirlis, N. , Acar, O. , Hsu, B. , Castilho Coelho, N. , Van Oss, S. B. , Wacholder, A. , Medetgul-Ernar, K. , Bowman, R. W. , Hines, C. P. , Iannotta, J. , Parikh, S. B. , McLysaght, A. , Camacho, C. J. , O’Donnell, A. F. , Ideker, T. , and Carvunis, A. R. (2020) De novo emergence of adaptive membrane proteins from thymine-rich genomic sequences. Nat Commun 11 · DOI
  31. 10.1038/nmeth.2019 · DOI · Paper page
  32. Fabre, B. , Lambour, T. , Garrigues, L. , Amalric, F. , Vigneron, N. , Menneteau, T. , Stella, A. , Monsarrat, B. , Van den Eynde, B. , Burlet-Schiltz, O. , and Bousquet-Dubouch, M. (2015) Deciphering preferential interactions within supramolecular protein complexes: the proteasome case. Mol Syst Biol 11, · DOI
  33. 10.1038/s41592-019-0638-x · DOI
  34. 10.1093/pcp/pcw137 · DOI
  35. Menneteau, T. , Fabre, B. , Garrigues, L. , Stella, A. , Zivkovic, D. , Roux-Dalvai, F. , Mouton-Barbosa, E. , Beau, M. , Renoud, M.-L. , Amalric, F. , Sensébé, L. , Gonzalez-De-Peredo, A. , Ader, I. , Burlet-Schiltz, O. , and Bousquet, M.-P . (2019) Mass spectrometry-based absolute quantification of 20S proteasome status for controlled ex-vivo expansion of human adipose-derived mesenchymal stromal/stem cells. Molecular and Cellular Proteomics 18, · DOI
  36. 2008, MaxQuant enables high peptide identification rates, individualized p, p.b.-range mass accuracies and proteome-wide protein quantification. Nat Biotechnol, 26, 1367
  37. Lazar, I. , Livneh, I. , Ciechanover, A. , and Fabre, B . (2024) Tryptophanyl-Transfer RNA Synthetase Is Involved in a Negative Feedback Loop Mitigating Interferon-γ-Induced Gene Expression. Cells 13, · DOI
  38. Fabre, B. , Livneh, I. , Ziv, T. , and Ciechanover, A . (2019) Identification of proteins regulated by the proteasome following induction of endoplasmic reticulum stress. Biochem Biophys Res Commun 517, · DOI
  39. 10.1093/NAR/GKAC1000 · DOI · Paper page
  40. 10.1101/gr.269102 · DOI
  41. 10.1038/nprot.2008.73 · DOI · Paper page
  42. 10.1093/nar/gkad1058 · DOI
  43. 2025, mimicINT: A workflow for microbe-host protein interaction inference, F1000Res, 14, 128, 10.12688/f1000research.160063.2 · DOI
  44. 10.1093/nar/gkaa977 · DOI · Paper page
  45. 10.1093/bioinformatics/btu031 · DOI
  46. Jagla, T. , Dubińska-Magiera, M. , Poovathumkadavil, P. , Daczewska, M. , and Jagla, K . (2018) Developmental expression and functions of the small heat shock proteins in drosophila. Int J Mol Sci 19, · DOI
  47. Lőrincz, P. , Mauvezin, C. , and Juhász, G . (2017) Exploring autophagy in Drosophila. Cells 6, · DOI
  48. 10.1146/ANNUREV-CELLBIO-120219-040142/CITE/REFWORKS · DOI
  49. 10.1016/j.cub.2021.09.017 · DOI
  50. Lengefeld, J. , and Zatulovskiy, E. (2023) Editorial: Cell size regulation: molecular mechanisms and physiological importance. Front Cell Dev Biol 11, · DOI
  51. 10.1042/BST20201058 · DOI
  52. 10.1073/pnas.0806106105 · DOI
  53. 10.1021/cr400585q · DOI
  54. Del Caño-Espinel, M. , Acebes, J. R. , Sanchez, D. , and Ganfornina, M. D . (2015) Lazarillo-related Lipocalins confer long-term protection against type i Spinocerebellar Ataxia degeneration contributing to optimize selective autophagy. Mol Neurodegener 10, · DOI
  55. 10.1016/j.febslet.2013.12.012 · DOI

Metadata

Authors
Duboé, C., Guillon, C., Boutet, J., Jariais, N., Pichereaux, C., Chaoui, K., Näser, E., Combier, J.-P., Brun, C., Martineau, Y., Burlet-Schiltz, O., Plaza, S., & Fabre, B.
Affiliations
Centre National de la Recherche Scientifique (FR)
Corresponding author
  • Plaza, Serge
  • Fabre, Bertrand
Venue
Molecular & Cellular Proteomics
Publisher
openRxiv
Published
2025-07-20
Volume
25
Issue
4
Pages
101544-101544
ISSN
1535-9476 (ISSN-L)
OpenAlex
W7132845994
Cited by
0
References
1
FWCI
0.00
Type
journal article
Language
en
Open access
Locations
  • Molecular & Cellular Proteomics (publishedVersion, cc-by)
  • bioRxiv (Cold Spring Harbor Laboratory) (acceptedVersion, cc-by)
  • PubMed Central (publishedVersion, cc-by)
  • PubMed (publishedVersion)
  • HAL (submittedVersion, cc-by-nc)
  • HAL (submittedVersion, cc-by)
Funders
  • Agence Nationale de la Recherche (ANR-23-CE44-0028, ANR-10-INBS-08)
  • Institut National du Cancer (INCa 2021-073)
Topics
  • Life Sciences › Biochemistry, Genetics and Molecular Biology › Cancer Research › MicroRNA in disease regulation
  • Life Sciences › Biochemistry, Genetics and Molecular Biology › Cell Biology › Autophagy in Disease and Therapy
  • Life Sciences › Biochemistry, Genetics and Molecular Biology › Molecular Biology › PI3K/AKT/mTOR signaling in cancer
Keywords
microproteins, pri-miRNA, cell size control, autophagy, mTORC1, short linear motifs, protein-protein interaction, G1 cell cycle arrest, wing size, Drosophila melanogaster, S2 cells, protein-protein interaction network
MeSH terms
Animals, Autophagy, Cell Line, DNA-Binding Proteins, Drosophila melanogaster, Humans, Mutation, Protein Binding, Wings, Animal, Drosophila Proteins, Eukaryotic Initiation Factors, Proteomics, Cell Size, TOR Serine-Threonine Kinases

About these checks

Registry, retraction, Cites and statistics results are computed, not judged, with one exception: a printed reference that no index lists is read once by a model before it counts as a citation error. Claims are extracted by a model and kept only when their quote appears verbatim in the text; each cited source is then checked, with a model’s help, for whether it says what the claim relies on. Those verdicts can be wrong — read the claim’s quote and the cited source before relying on one.

Statistics and arithmetic are recomputed, not judged.

Confidence bands are shown only for fields calibrated on our annotated test set. None is calibrated yet, so no band is shown.

What counts as a claim ›How we measure confidence ›How we check this ›

Are you an author, or do you see a problem with this page? Request a review