PreprintCited by 2Enzyme Catalysis and ImmobilizationMass Spectrometry Techniques and ApplicationsMicrobial Natural Products and Biosynthesis

The DOI matches its Crossref record; 1 of the 1 references it cites were found in a registry or an index.

A High-Throughput Biocatalytic Platform for Screening Isomeric Kainoid Natural Products

Open access

Preprint — published as 10.1016/j.xcrp.2025.103092 · Paper page

Abstract

Random mutagenesis generates large, diverse enzyme libraries, however high-throughput screening is challenging when transformations yield isomeric small molecule products. We developed a matrix-assisted laser desorption/ionization–trapped ion mobility spectrometry–mass spectrometry (MALDI-TIMS-MS) platform for rapid, label-free screening of libraries of kainoid synthases, Fe/αKG-dependent cyclases that produce the isomeric neurotransmitters kainic acid (KA) and kainic acid lactone (KAL). This platform achieves near-baseline separation of KA and KAL directly from microbial biomass, with parallel reaction monitoring–PASEF (PRM-PASEF) enhancing signal-to-noise for isomeric product ratio analysis. Using this workflow, we screened a 318-variant DsKabC/GfKabC DNA shuffle library in under 30 minutes, identifying seven variants with improved KAL conversion. Two variants showed a near-complete shift toward KAL production with greater substrate consumption, while retaining favorable expression profiles compared to GfKabC. These results establish MALDI-TIMS-MS as a generalizable platform for high-throughput isomeric product screening and provides new kainoid synthase variants to probe structure–function relationships for further development as biocatalysts. Importantly, this screening approach can be broadly applied to interrogate enzyme variants acting on small molecules, delivering rapid and accurate quantitative insights without reliance on chromatography, enzyme purification, or substrate derivatization.

Overview

The claims and statistics of this paper haven’t been checked yet.

Run the check — free, no account needed. It reads the open-access text and checks the sources it cites.

A few free checks a day · papers already verified open instantly · results are public

Integrity signals

Registry

Crossref · 10.1101/2025.09.07.674781

Cites

1 of 1 references verified0 citation errors · 0 not checkable

Statistics

Figures

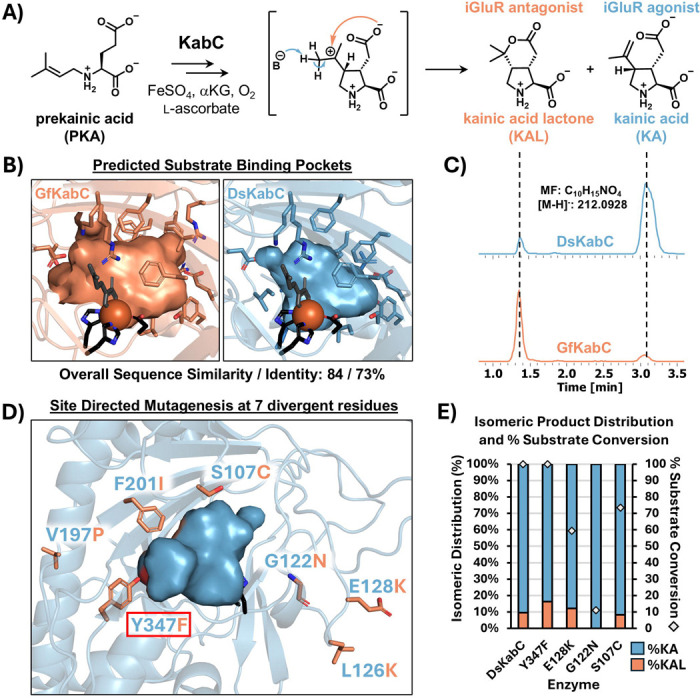
Figure 1. Overview of KabC structure and activity. A) Abbreviated mechanism for the conversion of prekainic acid to both kainic acid (KA) and kainic acid lactone (KAL) by KabC. The mechanistic branch point putatively occurs after pyrrolidine ring formation, with deprotonation resulting in KA formation, and nucleophilic addition of the side chain carboxylate resulting in the formation of KAL. B) The predicted substrate binding pockets of DsKabC and GfKabC are highly similar in composition, reflecting their overall high sequence similarity and identity (84 and 73%, respectively). C) LC-MS extracted ion chromatograms of m/z 212.09 ± 0.2, demonstrating the differing production of KA and KAL between DsKabC and GfKabC. D) Seven sites chosen for rational SDM based on multiple sequence alignment of KabC orthologs. Boxed in red is the Y347F mutant carried forward as an additional positive control for screening development. E) In vitro isomeric distribution and percent substrate conversion (represented by the gray diamonds) for DsKabC and the four prioritized single-point KabC variants via LC-MS (n = 1). The displayed LC-MS data were collected on a Bruker AmaZon SL.
Figure 1. Overview of KabC structure and activity. A) Abbreviated mechanism for the conversion of prekainic acid to both kainic acid (KA) and kainic acid lactone (KAL) by KabC. The mechanistic branch point putatively occurs after pyrrolidine ring formation, with deprotonation resulting in KA formation, and nucleophilic addition of the side chain carboxylate resulting in the formation of KAL. B) The predicted substrate binding pockets of DsKabC and GfKabC are highly similar in composition, reflecting their overall high sequence similarity and identity (84 and 73%, respectively). C) LC-MS extracted ion chromatograms of m/z 212.09 ± 0.2, demonstrating the differing production of KA and KAL between DsKabC and GfKabC. D) Seven sites chosen for rational SDM based on multiple sequence alignment of KabC orthologs. Boxed in red is the Y347F mutant carried forward as an additional positive control for screening development. E) In vitro isomeric distribution and percent substrate conversion (represented by the gray diamonds) for DsKabC and the four prioritized single-point KabC variants via LC-MS (n = 1). The displayed LC-MS data were collected on a Bruker AmaZon SL.CC BY-NC-ND · PubMed Central
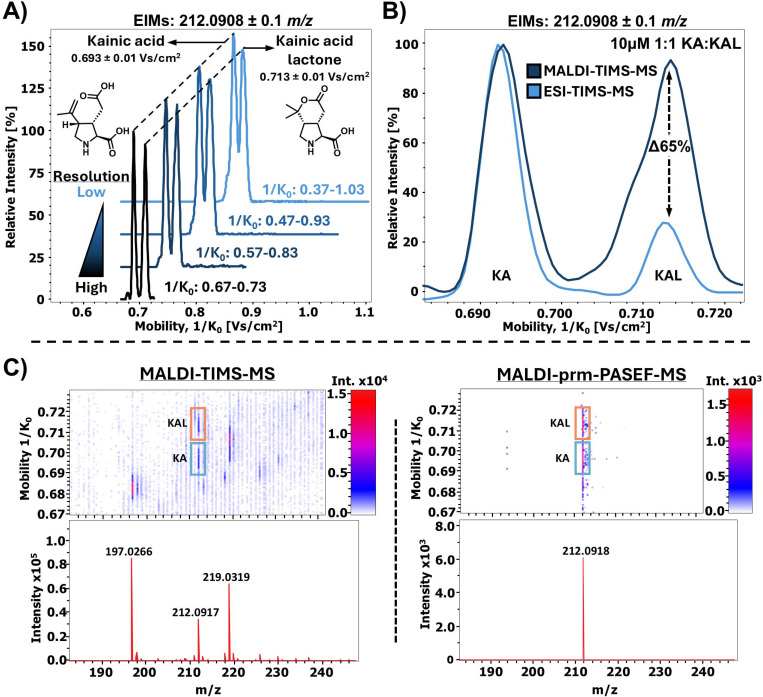
Figure 2. Optimization of TIMS-MS parameters for monitoring KA and KAL. A) Optimization of TIMS resolution for KA and KAL. Increasing the ramp time and decreasing the 1/K0 range of acquisition maximized resolution for our analysis. B) Comparison between MALDI- and ESI-TIMS-MS for measuring the relative abundance of KA and KAL. When measuring the same mixture of standards, it was observed that ESI-TIMS-MS displayed a 65% decrease in the relative intensity of KAL, suggesting that MALDI-TIMS-MS is more reliable for relative kainoid quantitation. C) Employment of PRM-PASEF-MS significantly reduced chemical noise for our MALDI-based analysis, simplifying and increasing confidence in downstream data visualization.
Figure 2. Optimization of TIMS-MS parameters for monitoring KA and KAL. A) Optimization of TIMS resolution for KA and KAL. Increasing the ramp time and decreasing the 1/K0 range of acquisition maximized resolution for our analysis. B) Comparison between MALDI- and ESI-TIMS-MS for measuring the relative abundance of KA and KAL. When measuring the same mixture of standards, it was observed that ESI-TIMS-MS displayed a 65% decrease in the relative intensity of KAL, suggesting that MALDI-TIMS-MS is more reliable for relative kainoid quantitation. C) Employment of PRM-PASEF-MS significantly reduced chemical noise for our MALDI-based analysis, simplifying and increasing confidence in downstream data visualization.CC BY-NC-ND · PubMed Central
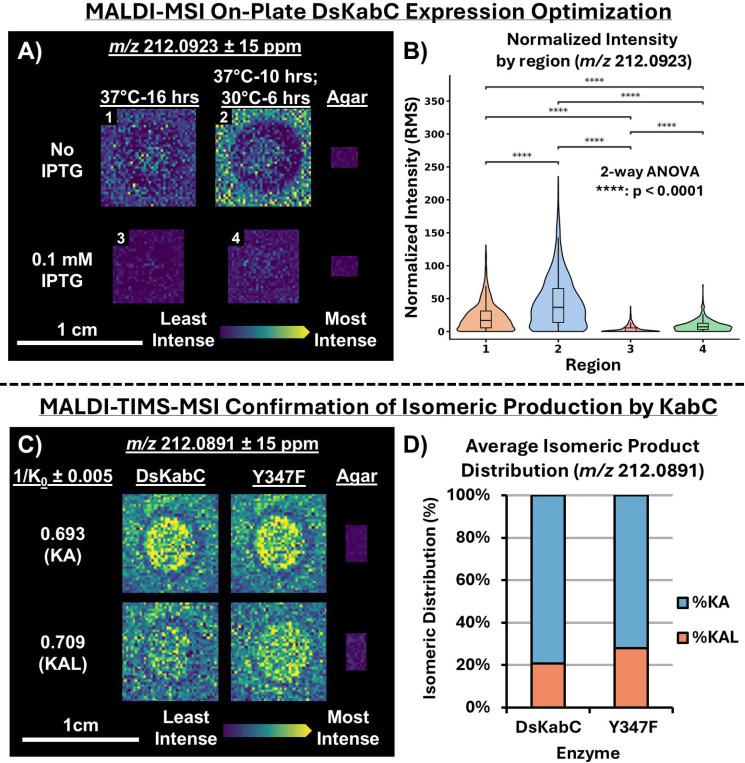
Figure 3. Optimization of on-agar DsKabC expression via MALDI-TIMS-MSI. A) Ion images of BL21 (DE3) E. coli expressing WT DsKabC, grown on LB/KAN agar containing 1 mM PKA substrate. The amount of IPTG and the temperature of incubation is varied between all four biological replicates and all images were collected during the same MALDI-MSI acquisition. B) Box and whisker plots highlighting the distribution of intensity values for m/z 212.0923 normalized by root mean square (RMS). The box and whisker plots are overlaid with violin plots highlighting the density and spread of normalized intensity values within each ion image. Significance was determined using Tukey’s post-hoc test, following a two-way ANOVA with temperature and IPTG presence serving as the independent variables. C) Ion images of BL21 DE3 E. coli expressing either WT DsKabC or DsKabC Y347F, grown on LB/KAN agar containing 1mM PKA substrate (m/z 212.0891). D) The average relative abundance of KA and KAL across all individual spectra for both WT DsKabC (n = 3052) and DsKabC Y347F (n = 3744). Y347F continues to display increased production of KAL relative to WT DsKabC, consistent with the initial in vitro assessment of Y347F activity via LC-MS (Figure 1E).
Figure 3. Optimization of on-agar DsKabC expression via MALDI-TIMS-MSI. A) Ion images of BL21 (DE3) E. coli expressing WT DsKabC, grown on LB/KAN agar containing 1 mM PKA substrate. The amount of IPTG and the temperature of incubation is varied between all four biological replicates and all images were collected during the same MALDI-MSI acquisition. B) Box and whisker plots highlighting the distribution of intensity values for m/z 212.0923 normalized by root mean square (RMS). The box and whisker plots are overlaid with violin plots highlighting the density and spread of normalized intensity values within each ion image. Significance was determined using Tukey’s post-hoc test, following a two-way ANOVA with temperature and IPTG presence serving as the independent variables. C) Ion images of BL21 DE3 E. coli expressing either WT DsKabC or DsKabC Y347F, grown on LB/KAN agar containing 1mM PKA substrate (m/z 212.0891). D) The average relative abundance of KA and KAL across all individual spectra for both WT DsKabC (n = 3052) and DsKabC Y347F (n = 3744). Y347F continues to display increased production of KAL relative to WT DsKabC, consistent with the initial in vitro assessment of Y347F activity via LC-MS (Figure 1E).CC BY-NC-ND · PubMed Central
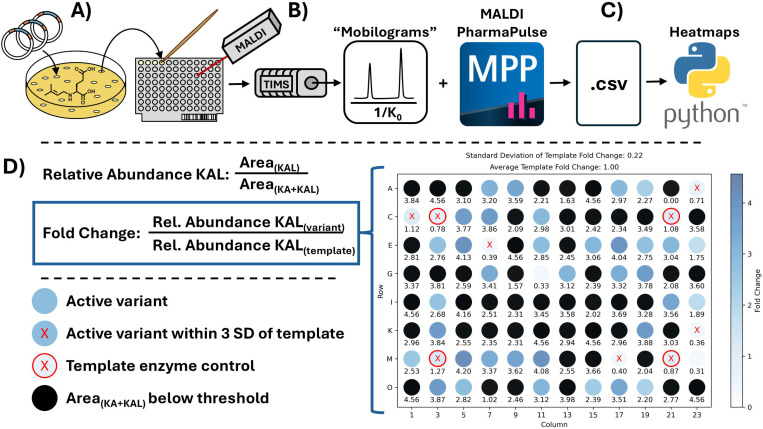
Figure 4. Schematic of MALDI-TIMS-MS screening platform. A) Following mutagenic PCR, the genes are ligated into a pET28a(+) expression plasmid and transformed into E. coli. The transformation plates contain 1 mM of PKA substrate to allow for KabC expression and substrate conversion in the same incubation period. The resulting colonies are directly transferred to MALDI plates, and matrix applied for downstream analysis. B) MALDI-TIMS-MS acquisition is performed, generating mobilograms that can subsequently be compiled into *.csv files using the MPP software. C) The generated *.csv files are fed into an in-house python script, generating heatmaps of variant fold change. D) The relative abundance of KAL for each variant and template controls is calculated first. The fold change is calculated by dividing the relative KAL abundance for each variant by the average of 4 DsKabC template control spots (red circle) for a 96-spot MALDI target. Blue indicates high fold-change, white represents zero-fold change, and black represents spots in which the total TIMS peak area for KA + KAL was less than a defined threshold (1000 was used for our screening). Variants within 3 standard deviations of the average relative KAL abundance of the template controls are marked with a red X.
Figure 4. Schematic of MALDI-TIMS-MS screening platform. A) Following mutagenic PCR, the genes are ligated into a pET28a(+) expression plasmid and transformed into E. coli. The transformation plates contain 1 mM of PKA substrate to allow for KabC expression and substrate conversion in the same incubation period. The resulting colonies are directly transferred to MALDI plates, and matrix applied for downstream analysis. B) MALDI-TIMS-MS acquisition is performed, generating mobilograms that can subsequently be compiled into *.csv files using the MPP software. C) The generated *.csv files are fed into an in-house python script, generating heatmaps of variant fold change. D) The relative abundance of KAL for each variant and template controls is calculated first. The fold change is calculated by dividing the relative KAL abundance for each variant by the average of 4 DsKabC template control spots (red circle) for a 96-spot MALDI target. Blue indicates high fold-change, white represents zero-fold change, and black represents spots in which the total TIMS peak area for KA + KAL was less than a defined threshold (1000 was used for our screening). Variants within 3 standard deviations of the average relative KAL abundance of the template controls are marked with a red X.CC BY-NC-ND · PubMed Central
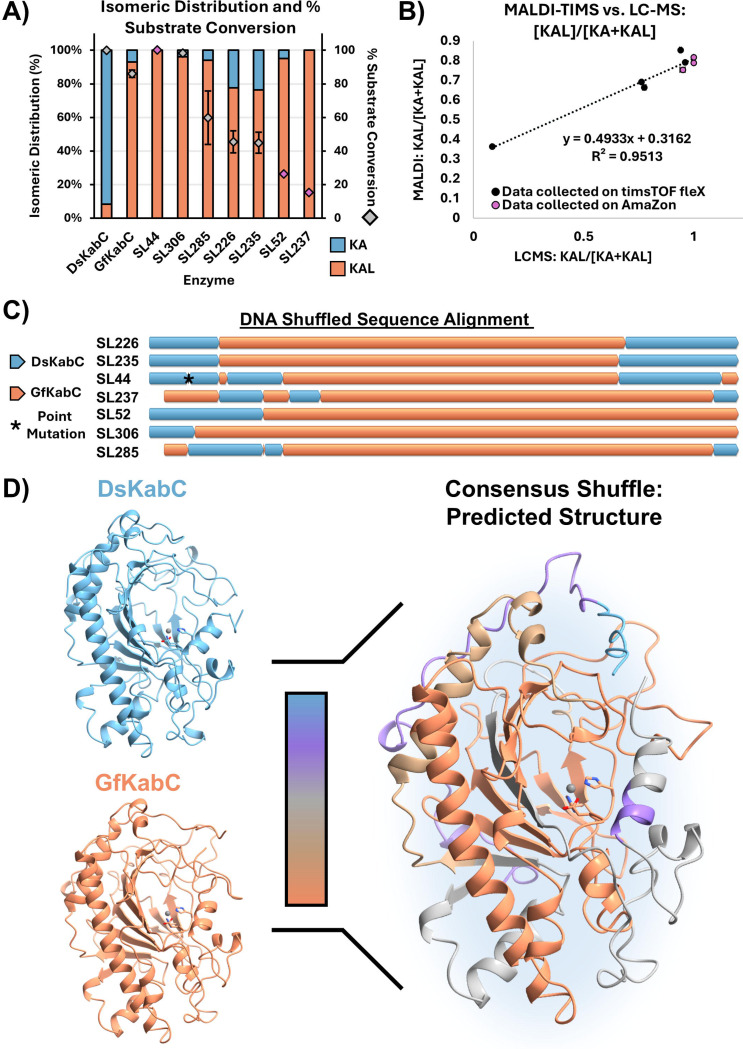
Figure 5. Overview of selected DNA-shuffled KabC variants. A) Isomeric distribution of KA and KAL represented as relative percent abundance, and percent substrate conversion for the selected DNA-shuffled variants determined via LC-MS in vitro assays. Grey diamonds represent data points collected using the timsTOF fleX mass spectrometer; pink diamonds represent datapoints collected using a Bruker AmaZon SL mass spectrometer. B) Correlation of measured relative KAL abundance between MALDI-TIMS-MS and LC-MS for the DNA shuffle variants studied in vitro. A high correlation was observed for KAL/[KA+KAL] between LC-MS and MALDI-TIMS-MS analysis on the seven purified shuffle library hits and WT DsKabC (R2 = 0.95). C) Simplified multiple sequence alignment schematic of the 7 shuffled variants. D) Comparison between the predicted structures of DsKabC (blue) and GfKabC (orange) with that of the consensus between all seven shuffled variants tested in vitro.
Figure 5. Overview of selected DNA-shuffled KabC variants. A) Isomeric distribution of KA and KAL represented as relative percent abundance, and percent substrate conversion for the selected DNA-shuffled variants determined via LC-MS in vitro assays. Grey diamonds represent data points collected using the timsTOF fleX mass spectrometer; pink diamonds represent datapoints collected using a Bruker AmaZon SL mass spectrometer. B) Correlation of measured relative KAL abundance between MALDI-TIMS-MS and LC-MS for the DNA shuffle variants studied in vitro. A high correlation was observed for KAL/[KA+KAL] between LC-MS and MALDI-TIMS-MS analysis on the seven purified shuffle library hits and WT DsKabC (R2 = 0.95). C) Simplified multiple sequence alignment schematic of the 7 shuffled variants. D) Comparison between the predicted structures of DsKabC (blue) and GfKabC (orange) with that of the consensus between all seven shuffled variants tested in vitro.CC BY-NC-ND · PubMed Central

Verification

Claims the paper makes

The claims and statistics of this paper haven’t been checked yet.

Run the check — free, no account needed. It reads the open-access text and checks the sources it cites.

A few free checks a day · papers already verified open instantly · results are public

Self-check

Percentages, sums and reported differences re-computed from the paper’s own numbers.

The self-check needs the paper’s full text.

Citations

Cites

Research works printed but not linked: 64

  1. 2015, High Throughput Screening and Selection Methods for Directed Enzyme Evolution, Ind. Eng. Chem. Res, 54, 4011, 10.1021/ie503060a · DOI
  2. 2023, A Primer to Directed Evolution: Current Methodologies and Future Directions. RSC Chem, Biol, 4, 271
  3. 10.1038/nature24996 · DOI
  4. 10.1002/anie.201304401 · DOI
  5. 2018, High-Throughput Multiplexed Fluorescence-Activated Droplet Sorting, Microsyst Nanoeng, 4, 33, 10.1038/s41378-018-0033-2 · DOI
  6. 10.1021/acssynbio.9b00103 · DOI
  7. 10.1093/protein/14.4.261 · DOI
  8. 10.1093/protein/gzn065 · DOI
  9. Behrendorff, J. B. ; Vickers, C. E. ; Chrysanthopoulos, P. ; Nielsen, L. K . 2,2-Diphenyl-1-Picrylhydrazyl as a Screening Tool for Recombinant Monoterpene Biosynthesis. Microb. Cell Fact. 2013, 12, 76. · DOI
  10. 2008, A High-Throughput Microtiter Plate-Based Screening Method for the Detection of Full-Length Recombinant Proteins, Protein Expr. Purif, 61, 92, 10.1016/j.pep.2008.05.005 · DOI
  11. 10.1007/s00253-010-2977-5 · DOI
  12. 10.1002/bit.20573 · DOI
  13. 10.1016/j.tim.2007.09.004 · DOI
  14. 10.1039/D4NP00053F · DOI
  15. 10.1038/s41467-021-27636-3 · DOI
  16. 2018, Recent Examples of α-Ketoglutarate-Dependent Mononuclear Non-Haem Iron Enzymes in Natural Product Biosyntheses, Nat. Prod. Rep, 35, 792, 10.1039/C7NP00067G · DOI
  17. 10.1080/10409230490440541 · DOI · Paper page
  18. 10.1021/acschembio.3c00596 · DOI
  19. Zwick, C. R., III ; Renata, H. Overview of Amino Acid Modifications by Iron- and α-Ketoglutarate-Dependent Enzymes. ACS Catal. 2023, 4853–4865. · DOI
  20. 2016, Ferrous Iron and α-Ketoglutarate-Dependent Dioxygenases in the Biosynthesis of Microbial Natural Products, Biochim. Biophys. Acta, 1864, 453, 10.1016/j.bbapap.2016.01.012 · DOI
  21. Hausinger, R. P. Biochemical Diversity of 2-Oxoglutarate-Dependent Oxygenases. In 2-Oxoglutarate-Dependent Oxygenases; The Royal Society of Chemistry: Cambridge, 2015; pp 1–58. · DOI
  22. 2019, Industrial Application of 2-Oxoglutarate-Dependent Oxygenases, Catalysts, 9, 221, 10.3390/catal9030221 · DOI
  23. 2024, Characterization of Aziridine-Forming α-Ketoglutarate-Dependent Oxygenase in L-Isovaline Biosynthesis, Org. Lett, 26, 724, 10.1021/acs.orglett.3c04185 · DOI
  24. 10.1016/bs.mie.2024.05.017 · DOI
  25. 10.1073/pnas.2117407119 · DOI
  26. 10.1002/anie.201902910 · DOI
  27. 10.1126/science.aau0382 · DOI
  28. 10.1155/2011/457079 · DOI
  29. 10.1016/0006-8993(79)90163-X · DOI
  30. 10.1016/j.neubiorev.2013.10.011 · DOI
  31. 1981, Lactones Derived from Kainic Acid: Novel Selective Antagonists of Amino Acid-Induced Na+ Fluxes in Rat Striatum Slices, Neurosci. Lett, 23, 187, 10.1016/0304-3940(81)90038-0 · DOI
  32. 2025, Multiple Catalytic Branch Points in the Mechanism of Pyrrolidine Formation during Kainoid Biosynthesis Leads to Diverse Reaction Outcomes, J. Am. Chem. Soc, 147, 29961, 10.1021/jacs.5c07226 · DOI
  33. 2020, High Throughput Screening with SAMDI Mass Spectrometry for Directed Evolution, J. Am. Chem. Soc, 142, 19804, 10.1021/jacs.0c07828 · DOI
  34. 10.1039/d2sc01637k · DOI
  35. 2020, Optically Guided Mass Spectrometry to Screen Microbial Colonies for Directed Enzyme Evolution, Methods Enzymol, 644, 255, 10.1016/bs.mie.2020.04.054 · DOI
  36. 2021, Mapping Enzyme Catalysis with Metabolic Biosensing, Nat. Commun, 12, 6803, 10.1038/s41467-021-27185-9 · DOI
  37. 2017, Identifying Inhibitors of Inflammation: A Novel High-Throughput MALDI-TOF Screening Assay for Salt-Inducible Kinases (SIKs), SLAS Discov, 22, 1193, 10.1177/2472555217717473 · DOI
  38. 2005, MALDI-TOF MS Analysis of Soluble PEG Based Multi-Step Synthetic Reaction Mixtures with Automated Detection of Reaction Failure, J. Am. Soc. Mass Spectrom, 16, 670, 10.1016/j.jasms.2005.01.020 · DOI
  39. 10.1016/j.jasms.2009.09.016 · DOI
  40. 10.1038/s41467-023-43298-9 · DOI
  41. 2024, MALDI TIMS IMS Reveals Ganglioside Molecular Diversity within Murine S. Aureus Kidney Tissue Abscesses, J. Am. Soc. Mass Spectrom, 35, 1692, 10.1021/jasms.4c00089 · DOI
  42. 10.1021/acs.analchem.9b03612 · DOI
  43. 2023, MALDI TIMS IMS of Disialoganglioside Isomers─GD1a and GD1b in Murine Brain Tissue, Anal. Chem, 95, 1176
  44. 10.1021/acs.analchem.0c02520 · DOI
  45. 2003, A Split-Field Drift Tube for Separation and Efficient Fragmentation of Biomolecular Ions, Anal. Chem, 75, 6202, 10.1021/ac030111r · DOI
  46. 10.1007/s13361-019-02288-2 · DOI
  47. 2006, Ion Mobility Spectrometry: Principles and Applications, Appl. Spectrosc. Rev, 41, 323, 10.1080/05704920600663469 · DOI
  48. 10.1073/pnas.2214512120 · DOI
  49. 2015, Fundamentals of Trapped Ion Mobility Spectrometry, J. Am. Soc. Mass Spectrom, 26, 14, 10.1007/s13361-014-0999-4 · DOI
  50. 2016, Altering the Mobility-Time Continuum: Nonlinear Scan Functions for Targeted High Resolution Trapped Ion Mobility-Mass Spectrometry, Int. J. Ion Mobil. Spectrom, 19, 87, 10.1007/s12127-016-0196-1 · DOI
  51. 2018, Increasing Analytical Separation and Duty Cycle with Nonlinear Analytical Mobility Scan Functions in TIMS-FT-ICR MS, Anal. Chem, 90, 2446, 10.1021/acs.analchem.7b04053 · DOI
  52. 10.1021/acs.analchem.9b05772 · DOI
  53. 10.1021/acs.analchem.5c02787 · DOI
  54. 10.1038/nrg3927 · DOI
  55. Knox, R. ; Smith, R. ; Kempa, E. E. ; Spiess, R. ; Schnepel, C. ; Turner, N. J. ; Flitsch, S. L. ; Barran, P. E . Direct Analysis of Biotransformations with Mass Spectrometry-DiBT-MS. Nat. Protoc. 2025, 1–19. · DOI
  56. 10.1073/pnas.1801247115 · DOI
  57. 10.1016/j.mib.2014.06.014 · DOI
  58. 10.3791/59219-v · DOI
  59. 10.1016/0022-2836(91)90856-2 · DOI
  60. 10.1038/s41589-021-00944-x · DOI
  61. 10.1021/jacs.4c08420 · DOI
  62. 10.1038/S41586-024-07487-W · DOI · Paper page
  63. 10.1021/acs.biochem.2c00115 · DOI
  64. 2023, Ultra-High-Throughput Mapping of the Chemical Space of Asymmetric Catalysis Enables Accelerated Reaction Discovery, Nat. Commun, 14, 6671, 10.1038/s41467-023-42446-5 · DOI

Metadata

Authors
Shepherd, R. A., Ramachandra, M., Hopiavuori, A. R., Jones, M. C., Fihn, C. A., Tabag, A. J., Manjunath, A., Gad, L. Y., Whipple, C. R., McKinnie, S. M. K., & Sanchez, L. M.
Affiliations
University of California, Santa Cruz (US)
Corresponding author
  • McKinnie, Shaun M. K.
  • Sanchez, Laura M.
Venue
Cell Reports Physical Science
Publisher
openRxiv
Published
2025-09-12
Volume
7
Issue
2
Pages
103092-103092
ISSN
2666-3864 (ISSN-L)
OpenAlex
W7127981111
Cited by
2
References
1
Citations by year
2026: 2
FWCI
4.10
Type
journal article
Language
en
Open access
Locations
  • Cell Reports Physical Science (publishedVersion, cc-by)
  • bioRxiv (Cold Spring Harbor Laboratory) (acceptedVersion, cc-by-nc-nd)
  • PubMed (publishedVersion)
  • PubMed Central (publishedVersion, cc-by)
  • Europe PMC (PubMed Central) (submittedVersion, cc-by-nc-nd)
Funders
National Institutes of Health (R21GM148870, K12GM139185)
Topics
  • Life Sciences › Biochemistry, Genetics and Molecular Biology › Molecular Biology › Enzyme Catalysis and Immobilization
  • Physical Sciences › Chemistry › Spectroscopy › Mass Spectrometry Techniques and Applications
  • Life Sciences › Immunology and Microbiology › Applied Microbiology and Biotechnology › Microbial Natural Products and Biosynthesis
Keywords
kainic acid, high-throughput enzyme screening, structure-function relationship, enzyme stability

About these checks

Registry, retraction, Cites and statistics results are computed, not judged, with one exception: a printed reference that no index lists is read once by a model before it counts as a citation error. Claims are extracted by a model and kept only when their quote appears verbatim in the text; each cited source is then checked, with a model’s help, for whether it says what the claim relies on. Those verdicts can be wrong — read the claim’s quote and the cited source before relying on one.

Statistics and arithmetic are recomputed, not judged.

Confidence bands are shown only for fields calibrated on our annotated test set. None is calibrated yet, so no band is shown.

What counts as a claim ›How we measure confidence ›How we check this ›

Are you an author, or do you see a problem with this page? Request a review