PreprintCited by 10RNA and protein synthesis mechanismsBacterial Genetics and BiotechnologyImmune Response and Inflammation

The DOI matches its Crossref record; 1 of the 1 references it cites were found in a registry or an index.

Coordination of transcriptional and translational regulations in human epithelial cells infected by Listeria monocytogenes

Open access

Preprint — published as 10.1080/15476286.2020.1777380 · Paper page

Abstract

The invasion of mammalian cells by intracellular bacterial pathogens reshuffles their gene expression and functions; however, we lack dynamic insight into the distinct control levels that shape the host response. Here, we have addressed the respective contribution of transcriptional and translational regulations during a timecourse of infection of human intestinal epithelial cells by an epidemic strain of Listeria monocytogenes , using transcriptome analysis paralleled with ribosome profiling. Upregulations were dominated by early transcriptional activation of pro-inflammatory genes, whereas translation inhibition appeared as the major driver of downregulations. Instead of a widespread but transient shutoff, translation inhibition affected specifically and durably transcripts encoding components of the translation machinery harbouring a 5’-terminal oligopyrimidine motif. Pre-silencing the most repressed target gene ( PABPC1 ) slowed down the intracellular multiplication of Listeria monocytogenes , suggesting that the infected host cell can benefit from the repression of genes involved in protein synthesis and thereby better control infection.

Overview

The claims and statistics of this paper haven’t been checked yet.

Run the check — free, no account needed. It reads the open-access text and checks the sources it cites.

A few free checks a day · papers already verified open instantly · results are public

Integrity signals

Registry

Crossref · 10.1101/775148

Cites

1 of 1 references verified0 citation errors · 0 not checkable

Statistics

Figures

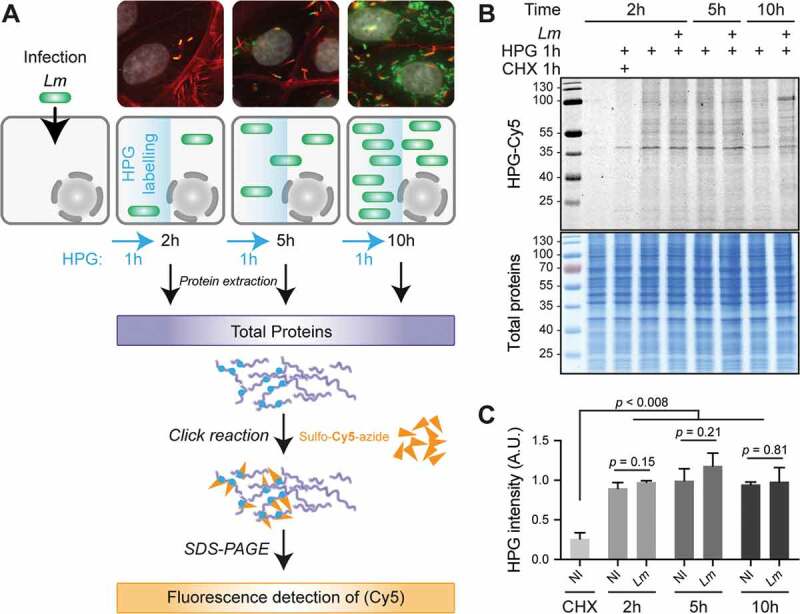
Figure 1. Lm infection has a low impact on total translation activity in LoVo epithelial cells. (A) Principle of the metabolic labelling of newly synthesized proteins with homopropargylglycine (HPG) over an infection time course. LoVo cells, infected or not for 2, 5 or 10 h with Lm LL195 constitutively expressing eGFP, were treated with HPG for 1 h prior to recovery. Cell infection was monitored by immunofluorescence staining on coverslips. DAPI staining of cell nuclei is displayed in white, F-actin staining by fluorescently labelled phalloidin is in red, and eGFP-expressing bacteria are in green. After cell lysis, HPG residues that had been incorporated into newly-synthesized proteins were conjugated with sulpho-Cy5-azide by copper-catalysed alkyne-azide cycloaddition. (B) In-gel fluorescence detection of HPG incorporation into newly synthesized proteins. Following cycloaddition, protein samples were separated by SDS-PAGE, and Cy5 fluorescence was recorded (top panel) before the gel was stained with colloidal Coomassie as a loading control (bottom panel). (C) Quantification of HPG incorporation. The integrated density of Cy5 fluorescence was measured for each lane and normalized to the corresponding integrated density of Coomassie staining. NI, non-infected. Data are average and standard deviation from independent experiments; n = 3 for CHX, 2 and 5 h p.i.; n = 2 for 10 h p.i. p-values were calculated by two-tailed t-tests.
Figure 1. Lm infection has a low impact on total translation activity in LoVo epithelial cells. (A) Principle of the metabolic labelling of newly synthesized proteins with homopropargylglycine (HPG) over an infection time course. LoVo cells, infected or not for 2, 5 or 10 h with Lm LL195 constitutively expressing eGFP, were treated with HPG for 1 h prior to recovery. Cell infection was monitored by immunofluorescence staining on coverslips. DAPI staining of cell nuclei is displayed in white, F-actin staining by fluorescently labelled phalloidin is in red, and eGFP-expressing bacteria are in green. After cell lysis, HPG residues that had been incorporated into newly-synthesized proteins were conjugated with sulpho-Cy5-azide by copper-catalysed alkyne-azide cycloaddition. (B) In-gel fluorescence detection of HPG incorporation into newly synthesized proteins. Following cycloaddition, protein samples were separated by SDS-PAGE, and Cy5 fluorescence was recorded (top panel) before the gel was stained with colloidal Coomassie as a loading control (bottom panel). (C) Quantification of HPG incorporation. The integrated density of Cy5 fluorescence was measured for each lane and normalized to the corresponding integrated density of Coomassie staining. NI, non-infected. Data are average and standard deviation from independent experiments; n = 3 for CHX, 2 and 5 h p.i.; n = 2 for 10 h p.i. p-values were calculated by two-tailed t-tests.CC BY-NC-ND · PubMed Central
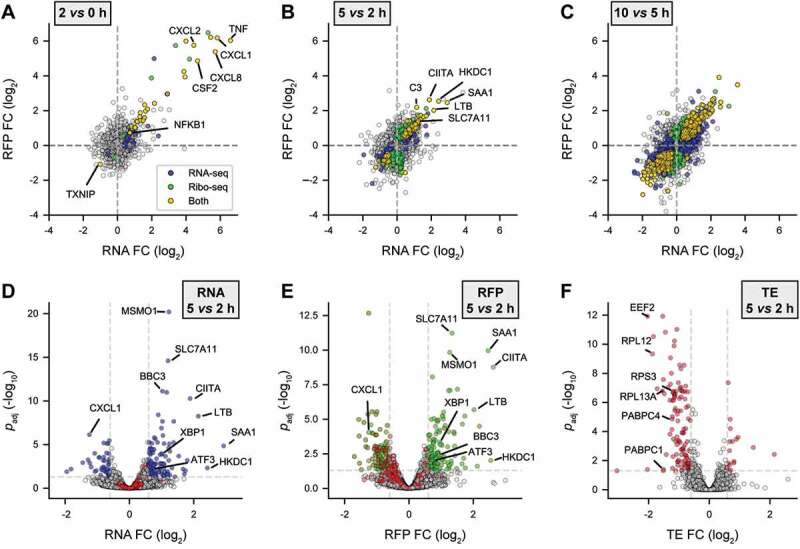
Figure 2. Transcriptional up- & translational down-regulations dominate gene expression response to Lm in the first hours of infection. LoVo intestinal epithelial cells were infected for 2 to 10 h. Cell lysates were processed for total cytoplasmic RNA-seq and ribosome profiling (Ribo-seq). (A-C) Scatter plots of changes in normalized RFP (Y-axis) vs RNA (X-axis) levels along the course of infection, when comparing (A) 2 h vs non-infected, (B) 5 vs 2 h or (C) 10 vs 5 h. (D-E) Volcano plots highlighting genes being significantly up- (right) or down- (left) regulated in (D) RNA-seq, (E) Ribo-seq, or (F) translation efficiency (TE) at 5 h p.i. compared to 2 h p.i. Data points coloured in blue, green or red represent genes with padj below 0.05 (above dashed grey horizontal line; -log10padj = 1.3) and an FC below or above 1.5 (vertical dashed grey lines; log2 FC = ± 0.58). Genes for which padj < 0.5 in TE are highlighted in red in D and E. (A-E) Data from three independent replicates (except for RFPs at 10 h). FC, foldchange; padj, adjusted p-value [DESeq false discovery rate (FDR)].
Figure 2. Transcriptional up- & translational down-regulations dominate gene expression response to Lm in the first hours of infection. LoVo intestinal epithelial cells were infected for 2 to 10 h. Cell lysates were processed for total cytoplasmic RNA-seq and ribosome profiling (Ribo-seq). (A-C) Scatter plots of changes in normalized RFP (Y-axis) vs RNA (X-axis) levels along the course of infection, when comparing (A) 2 h vs non-infected, (B) 5 vs 2 h or (C) 10 vs 5 h. (D-E) Volcano plots highlighting genes being significantly up- (right) or down- (left) regulated in (D) RNA-seq, (E) Ribo-seq, or (F) translation efficiency (TE) at 5 h p.i. compared to 2 h p.i. Data points coloured in blue, green or red represent genes with padj below 0.05 (above dashed grey horizontal line; -log10padj = 1.3) and an FC below or above 1.5 (vertical dashed grey lines; log2 FC = ± 0.58). Genes for which padj < 0.5 in TE are highlighted in red in D and E. (A-E) Data from three independent replicates (except for RFPs at 10 h). FC, foldchange; padj, adjusted p-value [DESeq false discovery rate (FDR)].CC BY-NC-ND · PubMed Central
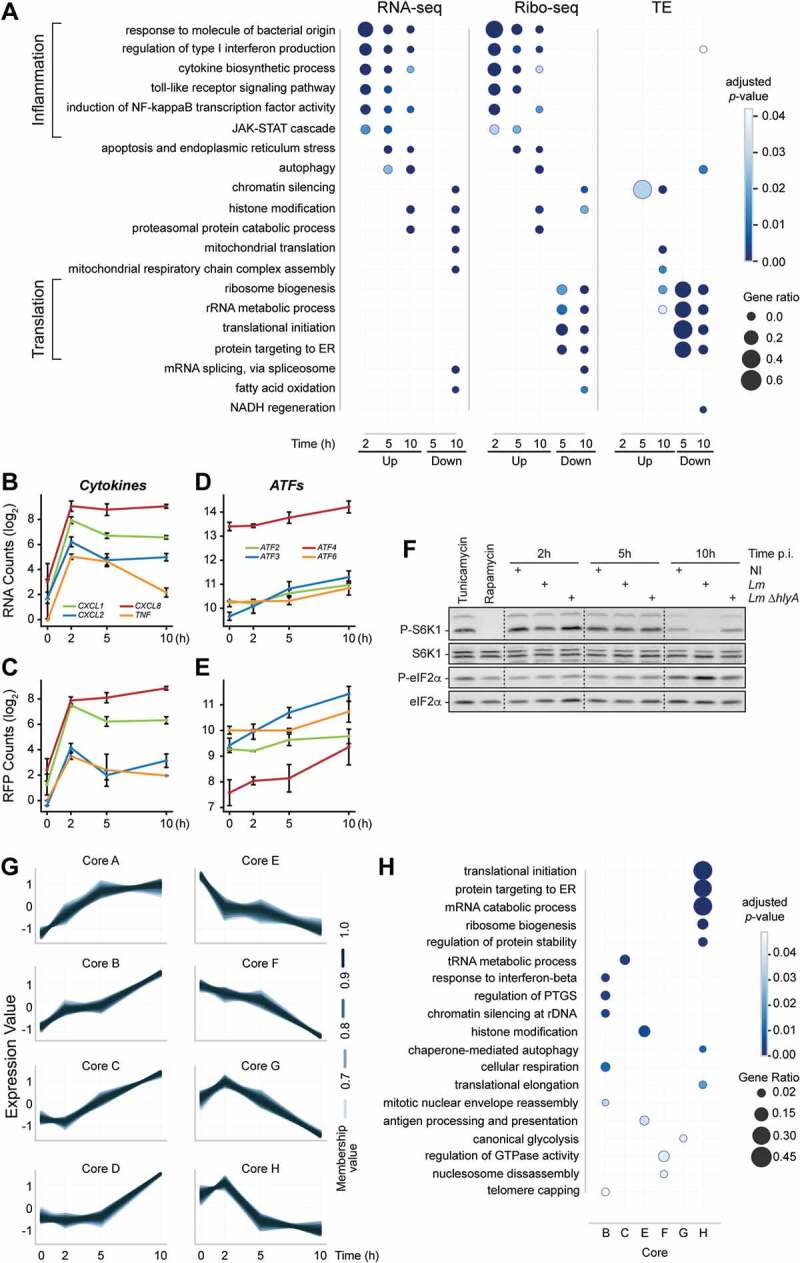
Figure 3. Early transcriptional regulation of inflammatory response precedes a translational repression of the translational equipment. (A) Over-representation analysis (ORA) of GO Biological Process terms for up- or down-regulated genes in RNA-seq, Ribo-seq or TE over all time-points. For each time-point, DRGs were selected by comparison to the non-infected condition. (B-F) Induction of inflammation and of the integrated stress response by Lm infection of LoVo cells. The variation of RNA (B, D) and RFP (C, E) levels was quantified for selected NF-κB transcriptional target genes related to inflammation (B, C) or genes involved in the integrated stress response (D, E) during infection. Data represent DESeq normalized read counts from three independent experiments and error bars indicate standard deviation. (F) The phosphorylation status of the mTOR substrate S6K1, and of the target of ISR eIF2 kinases eiF2α were assessed by immunoblotting in cells infected for 2, 5 or 10 h by wild-type Lm or by an Lm strain where the hlyA gene encoding LLO had been deleted (∆hlyA). Treatments by tunicamycin and rapamycin were used, respectively, as an inducer of the ISR through endoplasmic reticulum stress, and as a repressor of mTOR activity. (G) Transcripts sharing similar TE profiles over time were clustered by fuzzy clustering. For each cluster, only genes having more than 70% membership are displayed. (H) Functional categories were assigned to each cluster by ORA of GO Biological Process terms.
Figure 3. Early transcriptional regulation of inflammatory response precedes a translational repression of the translational equipment. (A) Over-representation analysis (ORA) of GO Biological Process terms for up- or down-regulated genes in RNA-seq, Ribo-seq or TE over all time-points. For each time-point, DRGs were selected by comparison to the non-infected condition. (B-F) Induction of inflammation and of the integrated stress response by Lm infection of LoVo cells. The variation of RNA (B, D) and RFP (C, E) levels was quantified for selected NF-κB transcriptional target genes related to inflammation (B, C) or genes involved in the integrated stress response (D, E) during infection. Data represent DESeq normalized read counts from three independent experiments and error bars indicate standard deviation. (F) The phosphorylation status of the mTOR substrate S6K1, and of the target of ISR eIF2 kinases eiF2α were assessed by immunoblotting in cells infected for 2, 5 or 10 h by wild-type Lm or by an Lm strain where the hlyA gene encoding LLO had been deleted (∆hlyA). Treatments by tunicamycin and rapamycin were used, respectively, as an inducer of the ISR through endoplasmic reticulum stress, and as a repressor of mTOR activity. (G) Transcripts sharing similar TE profiles over time were clustered by fuzzy clustering. For each cluster, only genes having more than 70% membership are displayed. (H) Functional categories were assigned to each cluster by ORA of GO Biological Process terms.CC BY-NC-ND · PubMed Central
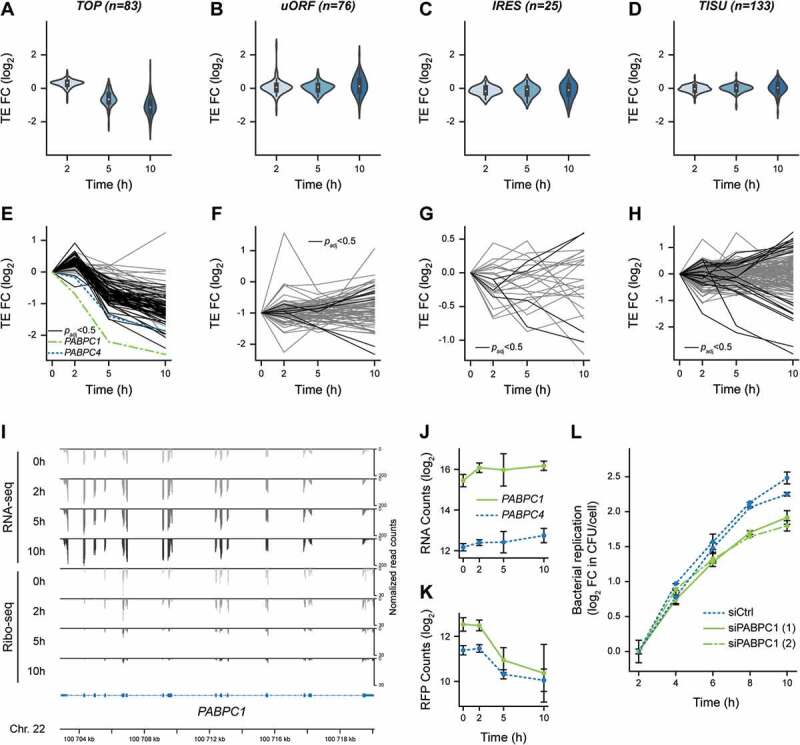
Figure 4. Translational repression of 5ʹ-terminal oligopyrimidine-containing transcripts, including PABPC1, during Lm infection. (A-D) Violin plots representing fold changes in TE over time for transcripts that have been experimentally verified to contain (A) functional TOP, (B) uORF, or (C) IRES motifs, or (D) predicted to contain a TISU in their 5ʹ-UTR regions. (E-H) Translation efficiency profiles of individual transcripts containing either (E) TOP, (F) uORF, (G) IRES or (H) TISU motifs. Transcripts for which the adjusted p-value from Riborex analysis was below 0.5 are displayed in black line (except PABPC1 and PABPC4, in dotted green and blue lines, respectively), while transcripts for which TE changes were not significant are displayed in grey. (I) Profiles of RNA-seq (top) and Ribo-seq (bottom) reads aligned at the PABPC1 locus. Average values of read counts per genomic position from three independent experiments, normalized for library size, are represented for each time-point. (J-K) Quantification of the variation of PABPC1 and PABPC4 RNA (J) and RFP (K) levels during infection. Data represent DESeq normalized counts from three independent experiments and error bars indicate standard deviation. (L) Silencing of PABPC1 reduces Lm intracellular replication rate. LoVo cells were transfected with siRNA against PABPC1 mRNA or a scrambled siRNA (siCtrl) for 48-h before infection. Two independent experiments were carried out using distinct siRNA against PABPC1 (siPABPC1 (1) and (2)). Bacterial entry and replication were assessed by gentamicin protection assay followed by serial dilution plating of infected cell lysates on agar plates. In order to focus on intracellular multiplication rather than differences in the entry, the log2 ratio of colony-forming units (CFU) counts per cell at each time-points relative to time 2 h post-infection were plotted. Values are averages and standard deviation from three infected wells per condition, each counted thrice.
Figure 4. Translational repression of 5ʹ-terminal oligopyrimidine-containing transcripts, including PABPC1, during Lm infection. (A-D) Violin plots representing fold changes in TE over time for transcripts that have been experimentally verified to contain (A) functional TOP, (B) uORF, or (C) IRES motifs, or (D) predicted to contain a TISU in their 5ʹ-UTR regions. (E-H) Translation efficiency profiles of individual transcripts containing either (E) TOP, (F) uORF, (G) IRES or (H) TISU motifs. Transcripts for which the adjusted p-value from Riborex analysis was below 0.5 are displayed in black line (except PABPC1 and PABPC4, in dotted green and blue lines, respectively), while transcripts for which TE changes were not significant are displayed in grey. (I) Profiles of RNA-seq (top) and Ribo-seq (bottom) reads aligned at the PABPC1 locus. Average values of read counts per genomic position from three independent experiments, normalized for library size, are represented for each time-point. (J-K) Quantification of the variation of PABPC1 and PABPC4 RNA (J) and RFP (K) levels during infection. Data represent DESeq normalized counts from three independent experiments and error bars indicate standard deviation. (L) Silencing of PABPC1 reduces Lm intracellular replication rate. LoVo cells were transfected with siRNA against PABPC1 mRNA or a scrambled siRNA (siCtrl) for 48-h before infection. Two independent experiments were carried out using distinct siRNA against PABPC1 (siPABPC1 (1) and (2)). Bacterial entry and replication were assessed by gentamicin protection assay followed by serial dilution plating of infected cell lysates on agar plates. In order to focus on intracellular multiplication rather than differences in the entry, the log2 ratio of colony-forming units (CFU) counts per cell at each time-points relative to time 2 h post-infection were plotted. Values are averages and standard deviation from three infected wells per condition, each counted thrice.CC BY-NC-ND · PubMed Central

Verification

Claims the paper makes

The claims and statistics of this paper haven’t been checked yet.

Run the check — free, no account needed. It reads the open-access text and checks the sources it cites.

A few free checks a day · papers already verified open instantly · results are public

Self-check

Percentages, sums and reported differences re-computed from the paper’s own numbers.

The self-check needs the paper’s full text.

Citations

Cites

Research works printed but not linked: 70

  1. 10.1083/jcb.201701095 · DOI
  2. 10.1038/nrmicro3029 · DOI
  3. 10.1007/978-3-319-24738-0_6 · DOI
  4. 2017, Mammalian microRNAs and long noncoding RNAs in the host-bacterial pathogen crosstalk, Semin Cell Dev Biol, 65, 11, 10.1016/j.semcdb.2016.06.016 · DOI
  5. 10.1016/j.tim.2018.10.011 · DOI
  6. 10.1016/j.chom.2012.09.006 · DOI
  7. 10.1371/journal.ppat.1001289 · DOI
  8. Barry KC , Ingolia NT , Vance RE. Global analysis of gene expression reveals mRNA superinduction is required for the inducible immune response to a bacterial pathogen. Elife 2017; 6. · DOI
  9. 10.1038/nrmicro.2017.126 · DOI
  10. 2015, Cell-autonomous responses in Listeria monocytogenes infection, Future Microbiol, 10, 583, 10.2217/fmb.15.4 · DOI
  11. 10.1111/j.1462-5822.2011.01600.x · DOI
  12. 10.1074/jbc.M112.375915 · DOI
  13. 10.1111/j.1462-5822.2012.01769.x · DOI
  14. 10.1038/emboj.2013.234 · DOI
  15. 2017, Host serine/threonine kinases mTOR and protein kinase C-α promote InlB-mediated entry of Listeria monocytogenes, Infect Immun, 85, e00087
  16. Ingolia NT , Hussmann JA , Weissman JS. Ribosome Profiling: Global Views of Translation. Cold Spring Harb Perspect Biol 2018;:a032698. · DOI
  17. 2013, Complete genome sequence of Listeria monocytogenes LL195, a serotype 4b strain from the 1983-1987 listeriosis epidemic in Switzerland, Genome Announc, 1, e00152
  18. Maury MM , Tsai Y-H , Charlier C , Touchon M , Chenal-Francisque V , Leclercq A , Criscuolo A , Gaultier C , Roussel S , Brisabois A , et al. Uncovering Listeria monocytogenes hypervirulence by harnessing its biodiversity. Nat Genet 2016; · DOI
  19. 10.1111/j.1600-065X.2010.00993.x · DOI
  20. 10.1038/onc.2010.102 · DOI
  21. 2018, Translation control of mRNAs encoding mammalian translation initiation factors, Gene, 651, 174, 10.1016/j.gene.2018.02.013 · DOI
  22. 10.1126/science.aad9868 · DOI · Paper page
  23. 2012, A unifying model for mTORC1-mediated regulation of mRNA translation, 485, 109
  24. 10.7554/eLife.28889 · DOI
  25. 10.1093/nar/gkx1237 · DOI
  26. 10.1128/mBio.00598-15 · DOI
  27. 10.1093/emboj/18.14.3956 · DOI
  28. 10.1046/j.1462-5822.2002.00169.x · DOI
  29. 10.1074/jbc.M114.621730 · DOI
  30. 10.1016/j.molcel.2018.12.006 · DOI
  31. 10.1101/gr.130559.111 · DOI
  32. 2010, Listeria monocytogenes impairs SUMOylation for efficient infection, 464, 1192
  33. 2018, Rapid Remodeling of the Host Epithelial Cell Proteome by the Listeriolysin O (LLO) Pore-forming Toxin, Molecular & Cellular Proteomics, 17, 1627, 10.1074/mcp.RA118.000767 · DOI
  34. 10.1021/pr101183k · DOI · Paper page
  35. 10.1038/s41467-017-02449-5 · DOI
  36. 10.1042/BST0381517 · DOI
  37. 10.1073/pnas.1017664108 · DOI
  38. 2017, Poly(A) tail length regulates PABPC1 expression to tune translation in the heart, Elife, 6, 568
  39. 10.1261/rna.053447.115 · DOI
  40. 2017, Bioinformatic analysis of pivotal genes associated with septic shock, J Biol Regul Homeost Agents, 31, 935
  41. 10.7554/eLife.27713 · DOI · Paper page
  42. 10.1371/journal.ppat.1005357 · DOI
  43. 10.1016/0378-1119(91)90546-N · DOI
  44. 10.1128/AEM.70.11.6887-6891.2004 · DOI
  45. 10.1371/journal.pgen.1005166 · DOI
  46. 10.1016/j.molcel.2013.08.011 · DOI
  47. 10.1371/journal.ppat.1005927 · DOI
  48. 10.1002/elps.1150090603 · DOI
  49. 2019, Listeriolysin O promotes the intravacuolar growth of Listeria monocytogenes in epithelial cells, bioRxiv, 6, e02567
  50. 10.1038/nprot.2012.086 · DOI
  51. 10.1093/bioinformatics/bts635 · DOI · Paper page
  52. 10.1093/bioinformatics/btt656 · DOI · Paper page
  53. 10.1093/nar/gkp998 · DOI
  54. 2019, ALFA: annotation landscape for aligned reads, BMC Genomics, 20, 250, 10.1186/s12864-019-5624-2 · DOI
  55. 10.1186/s13059-014-0550-8 · DOI · Paper page
  56. 10.1093/bioinformatics/btx047. · DOI
  57. 10.1089/omi.2011.0118 · DOI · Paper page
  58. 10.1038/nmeth.4463 · DOI · Paper page
  59. 10.1371/journal.pcbi.1003731 · DOI · Paper page
  60. 10.1142/S0219720005001375 · DOI
  61. 10.1186/gb-2010-11-3-r25 · DOI · Paper page
  62. 10.1093/bioinformatics/btp616 · DOI · Paper page
  63. 10.1093/bioinformatics/btq401 · DOI · Paper page
  64. 10.1093/nar/gkn248 · DOI
  65. McGillivray P , Ault R , Pawashe M , Kitchen R , Balasubramanian S , Gerstein M. A comprehensive catalog of predicted functional upstream open reading frames in humans. Nucleic Acids Res 2018; · DOI
  66. 10.1093/nar/gkj081 · DOI
  67. 10.1016/j.cmet.2015.02.010 · DOI
  68. 10.1126/science.1168978 · DOI · Paper page
  69. 10.1371/journal.pgen.1005166 · DOI
  70. 10.1016/j.molcel.2013.08.011 · DOI

Metadata

Authors
Besic, V., Habibolahi, F., Noël, B., Rupp, S., Genovesio, A., & Lebreton, A.
Affiliations
Centre National de la Recherche Scientifique (FR)
Corresponding author
Lebreton, Alice
Venue
RNA Biology
Publisher
openRxiv
Published
2019-09-19
Volume
17
Issue
10
Pages
1492-1507
ISSN
1547-6286 (ISSN-L)
OpenAlex
W3037073818
Cited by
10
References
1
Citations by year
2026: 1 · 2025: 1 · 2024: 1 · 2023: 2 · 2022: 2 · 2021: 3
FWCI
0.57
Type
journal article
Language
en
Open access
Licence
cc-by-nc-nd
Locations
  • RNA Biology (publishedVersion, cc-by-nc-nd)
  • bioRxiv (Cold Spring Harbor Laboratory) (acceptedVersion, cc-by-nc-nd)
  • PubMed Central (publishedVersion, cc-by-nc-nd)
  • PubMed (publishedVersion)
  • HAL (submittedVersion, cc-by-nc-nd)
Funders
  • Agence Nationale de la Recherche (10-LABX-54, ANR–10–LABX–54, ANR-10-IDEX-0001, ANR-10-IDEX0001-02., ANR-10-IDEX, ANR10IDEX000102 PSL, ANR-10, IDEX-0001-02)
  • Institut National de la Santé et de la Recherche Médicale (ANR-10-IDEX-0001-02, ANR-10-IDEX-0001-02 PSL)
  • Schweizerischer Nationalfonds zur Förderung der Wissenschaftlichen Forschung (ANR-10-IDEX-0001-02, 168721)
  • Fondation pour la Recherche Médicale (ANR-10-IDEX-0001-02 PSL, ANR-10-LABX-54, AJE20131128944, FRM-AJE20131128944)
Topics
  • Life Sciences › Biochemistry, Genetics and Molecular Biology › Molecular Biology › RNA and protein synthesis mechanisms
  • Life Sciences › Biochemistry, Genetics and Molecular Biology › Genetics › Bacterial Genetics and Biotechnology
  • Life Sciences › Immunology and Microbiology › Immunology › Immune Response and Inflammation
Keywords
Listeria monocytogenes, host-pathogen interaction, intestinal epithelial cells, transcriptional regulation, translational regulation, protein synthesis inhibition, ribosome profiling, transcriptome, PABPC1, pro-inflammatory gene expression, host response to infection
MeSH terms
Cells, Cultured, Epithelial Cells, Humans, Listeriosis, Listeria monocytogenes, RNA, Messenger, Time Factors, Transcription, Genetic, Protein Biosynthesis, Host-Pathogen Interactions

About these checks

Registry, retraction, Cites and statistics results are computed, not judged, with one exception: a printed reference that no index lists is read once by a model before it counts as a citation error. Claims are extracted by a model and kept only when their quote appears verbatim in the text; each cited source is then checked, with a model’s help, for whether it says what the claim relies on. Those verdicts can be wrong — read the claim’s quote and the cited source before relying on one.

Statistics and arithmetic are recomputed, not judged.

Confidence bands are shown only for fields calibrated on our annotated test set. None is calibrated yet, so no band is shown.

What counts as a claim ›How we measure confidence ›How we check this ›

Are you an author, or do you see a problem with this page? Request a review