

The DOI matches its Crossref record; 1 of the 1 references it cites were found in a registry or an index.
Short residence times of DNA-bound transcription factors can reduce gene expression noise and increase the transmission of information in a gene regulation system
Open accessPreprint — published as 10.3389/fmolb.2020.00067 · Paper page
Abstract
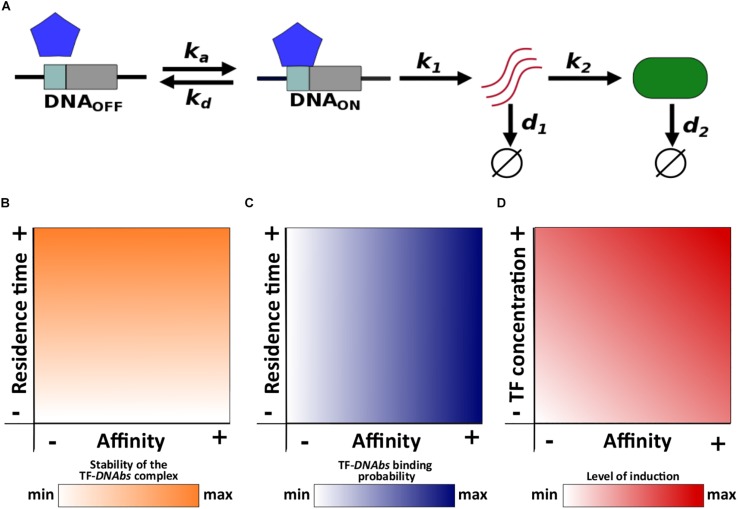
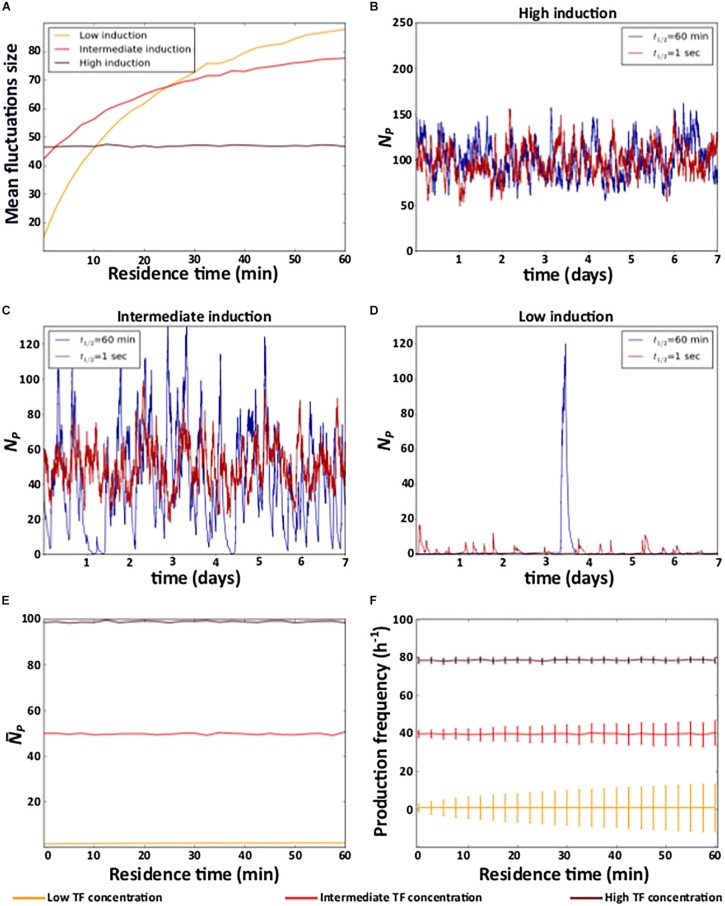
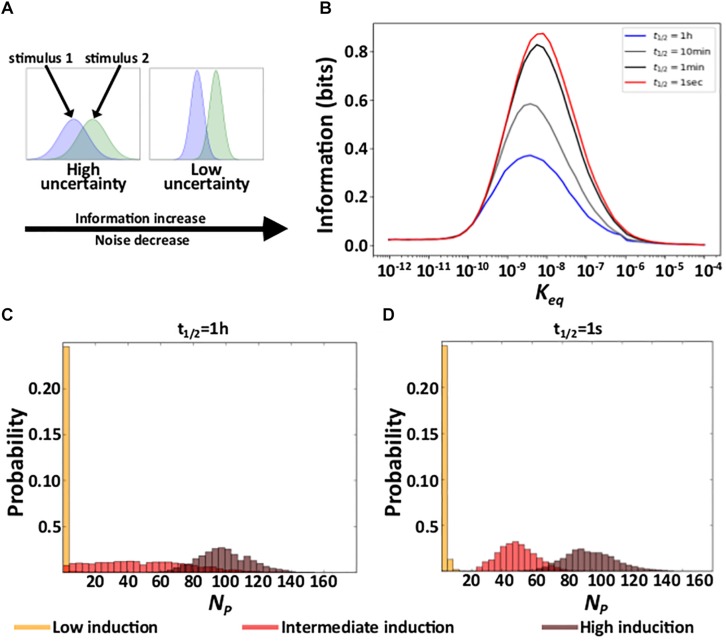
Gene expression noise is not just ubiquitous but also variable, and we still do not understand some of the most elementary factors that affect it. Among them is the residence time of a transcription factor (TF) on DNA, the mean time that a DNA-bound TF remains bound. Here, we use a stochastic model of transcriptional regulation to study how this residence time affects gene expression. We find that the effect of residence time on gene expression depends on the level of induction of the gene. At high levels of induction, residence time has no effect on gene expression. However, as the level of induction decreases, short residence times reduce gene expression noise. The reason is that fast on-off TF binding dynamics prevent long periods where proteins are predominantly synthesized or degraded, which can cause excessive fluctuations in gene expression. As a consequence, short residence times can help a gene regulation system acquire information about the cellular environment it operates in. Our predictions are consistent with the observation that experimentally measured residence times are usually modest and lie between seconds to minutes.
Overview
The claims and statistics of this paper haven’t been checked yet.
Run the check — free, no account needed. It reads the open-access text and checks the sources it cites.
Integrity signals
Registry
Cites
Statistics
Figures
Verification
Claims the paper makes
The claims and statistics of this paper haven’t been checked yet.
Run the check — free, no account needed. It reads the open-access text and checks the sources it cites.
Self-check
Percentages, sums and reported differences re-computed from the paper’s own numbers.
The self-check needs the paper’s full text.
Citations
Cites
Global quantification of mammalian gene expression control
Schwanhäusser, B., Busse, D., Li, N., Dittmar, G., Schuchhardt, J., Wolf, J., Chen, W., & Selbach, M. (2011) · Nature · doi:10.1038/nature10098 · Cited by 6,566
Research works printed but not linked: 66
- 10.1016/S0006-3495(01)75949-8 · DOI
- 2009, Single-Molecule Approaches to Stochastic Gene Expression, Annual Review of Biophysics, 38, 255, 10.1146/annurev.biophys.37.032807.125928 · DOI
- 10.1146/annurev-biophys-083012-130401 · DOI
- 10.1038/nature09326 · DOI
- 10.1111/j.1365-2958.2009.06605.x · DOI
- 2018, Buffering and Amplifying Transcriptional Noise During Cell Fate Specification, Front Genet, 9, 591, 10.3389/fgene.2018.00591 · DOI
- 10.1073/pnas.1720770115 · DOI
- 10.1016/j.copbio.2014.04.010 · DOI
- 10.1016/j.copbio.2014.05.002 · DOI
- 2012, The application of information theory to biochemical signaling systems, Physical Biology, 9, 045011, 10.1088/1478-3975/9/4/045011 · DOI
- 2018, Emerging Principles of Gene Expression Programs and Their Regulation, Molecular Cell, 71, 389, 10.1016/j.molcel.2018.07.017 · DOI
- 10.1038/nrm3952 · DOI
- 10.1146/annurev-genet-110711-155437 · DOI
- 10.1016/j.cell.2007.01.015 · DOI
- 10.1073/pnas.1905615116 · DOI
- 10.15252/embj.2018100809 · DOI
- 2016, Transcriptional bursting is intrinsically caused by interplay between RNA polymerases on DNA, Nat Commun, 7, 13788, 10.1038/ncomms13788 · DOI
- 2010, HIV Promoter Integration Site Primarily Modulates Transcriptional Burst Size Rather Than Frequency, PLoS Computational Biology, 6, e1000952, 10.1371/journal.pcbi.1000952 · DOI
- 10.1371/journal.pcbi.1004292 · DOI
- 10.1126/science.1098641 · DOI · Paper page
- 10.1006/tpbi.1995.1027 · DOI
- 2009, Stochasticity of gene products from transcriptional pulsing, Phys Rev E, 79, 031911, 10.1103/PhysRevE.79.031911 · DOI
- 10.1038/ncomms2867 · DOI
- 10.3109/10409238.2013.833891 · DOI
- 10.1093/nar/gkx728 · DOI
- 10.1016/j.cell.2014.01.062 · DOI · Paper page
- Morisaki T , Müller WG , Golob N , Mazza D , McNally JG. Single-molecule analysis of transcription factor binding at transcription sites in live cells. Nature Communications [Internet]. 2014 Dec [cited 2019 Aug 9];5(1). Available from: http://www.nature.com/articles/ncomms5456 · DOI
- 10.1093/nar/gks701 · DOI
- 10.1073/pnas.1206011109 · DOI
- 10.1038/nmeth.2411 · DOI
- 10.1083/jcb.201710038 · DOI
- 10.1016/j.molcel.2018.04.012 · DOI
- 10.1101/gad.289256.116 · DOI
- 10.1038/srep10662 · DOI
- 2009, Footprints by deep sequencing, Nat Methods, 6, 254, 10.1038/nmeth0409-254 · DOI
- 10.1146/annurev-biochem-060815-014710 · DOI
- 10.1016/j.jaci.2013.09.007 · DOI · Paper page
- 10.1016/j.cell.2016.02.067 · DOI · Paper page
- 10.1371/journal.pbio.1000220 · DOI
- 10.1038/nsmb.1674 · DOI
- 10.1021/j100540a008 · DOI
- Cover TM , Thomas JA. Elements of information theory. 2nd ed. Hoboken, N.J: Wiley-Interscience; 2006. 748 p.
- Azpeitia E , Wagner A. The positive role of noise for information acquisition in biological signaling pathways [Internet]. Systems Biology; 2019 Sep [cited 2019 Sep 10]. Available from: http://biorxiv.org/lookup/doi/10.1101/762989 · DOI · Paper page
- 10.1126/science.1204553 · DOI
- Cramer P. Organization and regulation of gene transcription. Nature [Internet]. 2019 Aug 28 [cited 2019 Sep 2]; Available from: http://www.nature.com/articles/s41586-019-1517-4
- 10.1002/bmb.2006.494034062678 · DOI
- 2016, Fundamental Limits to Cellular Sensing, Journal of Statistical Physics, 162, 1395, 10.1007/s10955-015-1440-5 · DOI
- 10.1073/pnas.0806077105 · DOI
- 10.1016/j.bpj.2014.01.014 · DOI
- 10.1038/ncomms10417 · DOI
- 2019, On chaotic dynamics in transcription factors and the associated effects in differential gene regulation, Nat Commun, 10, 71, 10.1038/s41467-018-07932-1 · DOI
- 10.1038/nature10985 · DOI · Paper page
- 10.1128/MCB.24.7.2682-2697.2004 · DOI
- 10.1016/j.molcel.2008.04.021 · DOI
- 10.1016/j.devcel.2011.09.008 · DOI · Paper page
- 2018, Unification of Protein Abundance Datasets Yields a Quantitative Saccharomyces cerevisiae Proteome, Cell Systems, 6, 192, 10.1016/j.cels.2017.12.004 · DOI
- 2016, SPL3/4/5 Integrate Developmental Aging and Photoperiodic Signals into the FT-FD Module in Arabidopsis Flowering, Molecular Plant, 9, 1647, 10.1016/j.molp.2016.10.014 · DOI
- 2015, Quantification of transcription factor-DNA binding affinity in a living cell, Nucleic Acids Research, 44, 3045
- 10.1073/pnas.1209589110 · DOI
- 10.1186/gb-2011-12-4-r34 · DOI · Paper page
- 2018, Determining mRNA half-lives on a transcriptome-wide scale, Methods, 137, 90, 10.1016/j.ymeth.2017.12.006 · DOI
- 10.1007/s00018-013-1472-4 · DOI
- 10.1093/dnares/dsn030 · DOI · Paper page
- 10.1038/ismej.2012.94 · DOI
- 10.1038/nrm3496 · DOI
- Hausser J , Mayo A , Keren L , Alon U. Central dogma rates and the trade-off between precision and economy in gene expression. Nature Communications [Internet]. 2019 Dec [cited 2019 Aug 9];10(1). Available from: http://www.nature.com/articles/s41467-018-07391-8 · DOI · Paper page
Metadata
- Authors
- Azpeitia, E., & Wagner, A.
- Affiliations
- SIB Swiss Institute of Bioinformatics (CH)
- Corresponding author
- Wagner, Andreas
- Venue
- Frontiers in Molecular Biosciences
- Publisher
- openRxiv
- Published
- 2019-09-20
- Volume
- 7
- Pages
- 67-67
- ISSN
- 2296-889X (ISSN-L)
- PMC
- PMC7198700
- OpenAlex
- W3023727038
- Cited by
- 17
- References
- 1
- Citations by year
- 2026: 1 · 2024: 2 · 2023: 4 · 2022: 4 · 2021: 3 · 2020: 3
- FWCI
- 1.13
- Type
- journal article
- Language
- en
- Open access
- gold
- doi.org
- Licence
- cc-by
- Locations
- Frontiers in Molecular Biosciences (publishedVersion, cc-by)
- bioRxiv (Cold Spring Harbor Laboratory) (acceptedVersion, cc-by)
- PubMed Central (publishedVersion, cc-by)
- PubMed (publishedVersion)
- Zurich Open Repository and Archive (University of Zurich) (acceptedVersion, cc-by)
- DOAJ (DOAJ: Directory of Open Access Journals) (submittedVersion, cc-by-sa)
- Zurich Open Repository and Archive (University of Zurich) (submittedVersion, cc-by)
- Zurich Open Repository and Archive (University of Zurich)
- Funders
- National Science Foundation (31003A_172887)
- Schweizerischer Nationalfonds zur Förderung der Wissenschaftlichen Forschung (739874, 172887)
- H2020 European Research Council (739874)
- Topics
- Life Sciences › Biochemistry, Genetics and Molecular Biology › Molecular Biology › Gene Regulatory Network Analysis
- Physical Sciences › Physics and Astronomy › Statistical and Nonlinear Physics › stochastic dynamics and bifurcation
- Life Sciences › Biochemistry, Genetics and Molecular Biology › Genetics › Bacterial Genetics and Biotechnology
- Keywords
- stochastic gene expression, transcriptional regulation, stochastic gene expression models, information transmission, gene expression regulation
About these checks
Registry, retraction, Cites and statistics results are computed, not judged, with one exception: a printed reference that no index lists is read once by a model before it counts as a citation error. Claims are extracted by a model and kept only when their quote appears verbatim in the text; each cited source is then checked, with a model’s help, for whether it says what the claim relies on. Those verdicts can be wrong — read the claim’s quote and the cited source before relying on one.
Statistics and arithmetic are recomputed, not judged.
Confidence bands are shown only for fields calibrated on our annotated test set. None is calibrated yet, so no band is shown.
What counts as a claim ›How we measure confidence ›How we check this ›
Are you an author, or do you see a problem with this page? Request a review
