Cited by 151

The DOI matches its Crossref record; 10 of the 10 references it cites were found in a registry or an index.

Calcium-dependent O-GlcNAc signaling drives liver autophagy in adaptation to starvation

Ruan, Hai-Bin, Ma, Yina, Torres, Sara, Zhang, Bichen, Feriod, Colleen, Heck, Ryan M., Qian, Kevin, Fu, Minnie, Li, Xiuqi, Nathanson, Michael H., Bennett, Anton M., Nie, Yongzhan, Ehrlich, Barbara E., Yang, Xiaoyong·2017·Genes & Development

Abstract

Starvation induces liver autophagy, which is thought to provide nutrients for use by other organs and thereby maintain whole-body homeostasis. Here we demonstrate that O-linked β-N-acetylglucosamine (O-GlcNAc) transferase (OGT) is required for glucagon-stimulated liver autophagy and metabolic adaptation to starvation. Genetic ablation of OGT in mouse livers reduces autophagic flux and the production of glucose and ketone bodies. Upon glucagon-induced calcium signaling, calcium/calmodulin-dependent kinase II (CaMKII) phosphorylates OGT, which in turn promotes O-GlcNAc modification and activation of Ulk proteins by potentiating AMPK-dependent phosphorylation. These findings uncover a signaling cascade by which starvation promotes autophagy through OGT phosphorylation and establish the importance of O-GlcNAc signaling in coupling liver autophagy to nutrient homeostasis.

Overview

The claims and statistics of this paper haven’t been checked yet.

Run the check — free, no account needed. It reads the open-access text and checks the sources it cites.

A few free checks a day · papers already verified open instantly · results are public

Integrity signals

Registry

Crossref · 10.1101/gad.305441.117

Cites

10 of 10 references verified0 citation errors · 0 not checkable

Statistics

Figures

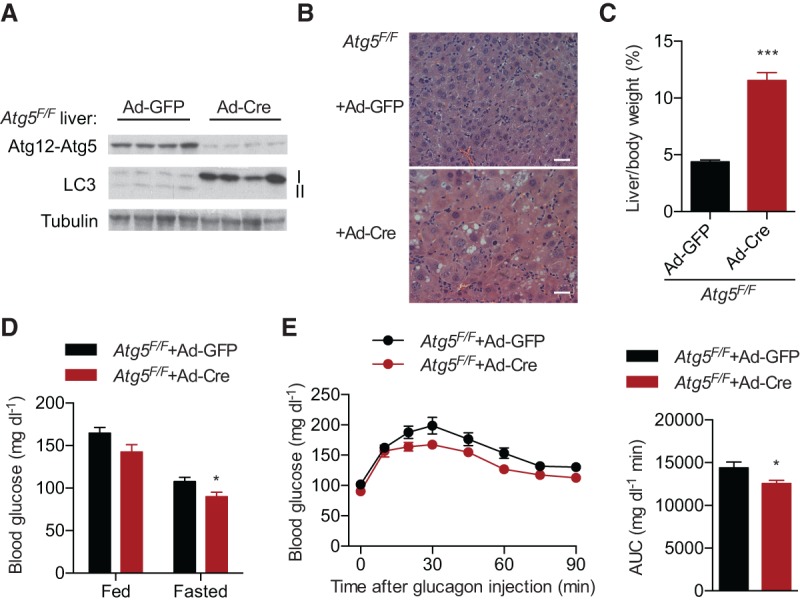
Figure 1. Atg5 regulates hepatic glucose production. (A) Western blotting of liver proteins showing the knockout of Atg5 and the defect in LC3 processing. Each lane represents an individual mouse sample. (B) Hematoxylin and eosin (H&E) staining of liver sections from overnight fasted control and Atg5-LKO mice. Bar, 50 µm. (C) Percentage of liver weight to body weight of overnight fasted control and Atg5-LKO mice. n = 8. (D) Two weeks after adenoviral administration, levels of blood glucose in fed and overnight fasted mice were determined. n = 8. (E) One week after viral injection, 0.5 mg of glucagon per kilogram of body weight was injected into overnight fasted mice, and glucose levels were measured for 90 min. Area under curve (AUC) is shown at the right. n = 8. Data are shown as mean ± SEM. (*) P < 0.05; (***) P < 0.001 by Student's t-test.
Figure 1. Atg5 regulates hepatic glucose production. (A) Western blotting of liver proteins showing the knockout of Atg5 and the defect in LC3 processing. Each lane represents an individual mouse sample. (B) Hematoxylin and eosin (H&E) staining of liver sections from overnight fasted control and Atg5-LKO mice. Bar, 50 µm. (C) Percentage of liver weight to body weight of overnight fasted control and Atg5-LKO mice. n = 8. (D) Two weeks after adenoviral administration, levels of blood glucose in fed and overnight fasted mice were determined. n = 8. (E) One week after viral injection, 0.5 mg of glucagon per kilogram of body weight was injected into overnight fasted mice, and glucose levels were measured for 90 min. Area under curve (AUC) is shown at the right. n = 8. Data are shown as mean ± SEM. (*) P < 0.05; (***) P < 0.001 by Student's t-test.CC BY-NC · PubMed Central
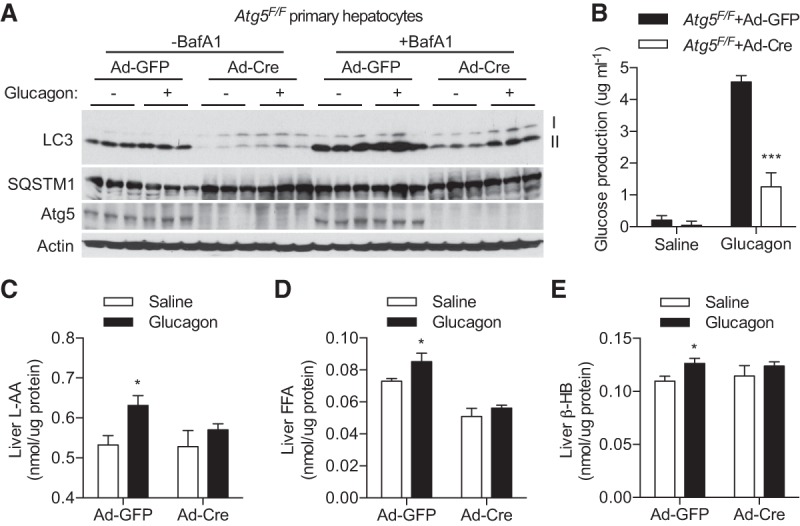
Figure 2. Autophagy mediates the effect of glucagon on liver metabolism. (A,B) Primary hepatocytes from control and Atg5-LKO mice were treated with saline or 500 ng/mL glucagon for 4 h. (A) Western blotting showing Atg5 and LC3-II levels in the absence and presence of BafA1. Each lane represents an individual mouse. (B) Glucose release into glucose-free medium. n = 6. (C–E) Two weeks after viral injection, overnight fasted mice were injected with saline or glucagon for 1 h, and then liver tissues were collected for L-AA (C), FFA (D), and β-HB (E) measurements. n = 4. Data are shown as mean ± SEM. (*) P < 0.05; (***) P < 0.001 by Student's t-test.
Figure 2. Autophagy mediates the effect of glucagon on liver metabolism. (A,B) Primary hepatocytes from control and Atg5-LKO mice were treated with saline or 500 ng/mL glucagon for 4 h. (A) Western blotting showing Atg5 and LC3-II levels in the absence and presence of BafA1. Each lane represents an individual mouse. (B) Glucose release into glucose-free medium. n = 6. (C–E) Two weeks after viral injection, overnight fasted mice were injected with saline or glucagon for 1 h, and then liver tissues were collected for L-AA (C), FFA (D), and β-HB (E) measurements. n = 4. Data are shown as mean ± SEM. (*) P < 0.05; (***) P < 0.001 by Student's t-test.CC BY-NC · PubMed Central
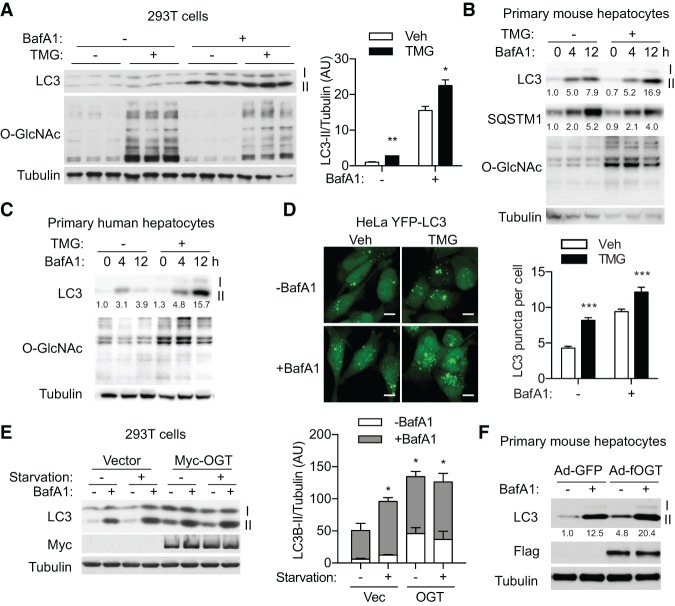
Figure 3. OGT promotes autophagy in cultured cells. (A) HEK293T cells were treated with TMG overnight and then starved in the presence or absence of BafA1, and levels of O-GlcNAc, LC3-II, and SQSTM1 were determined by Western blotting. LC3-II densitometry is shown at the right. (B,C) Primary hepatocytes from mice (B) and humans (C) were treated with TMG overnight, and levels of O-GlcNAc and LC3-II were determined by Western blotting. Relative levels of LC3-II and SQSTM1 were quantified by densitometry of three independent experiments. (D) Stable HeLa cells expressing YFP-LC3 were treated overnight with TMG followed by BafA1 for 3 h. LC3 puncta were observed by confocal microscopy, and the statistics are shown at the right. n = 123–144. Bar, 50 µm. (E) HEK293T cells were transfected with empty vector or OGT and treated as indicated. LC3-II levels were determined by immunoblotting. Densitometry is shown at the right. (F) Primary mouse hepatocytes were infected with adenoviruses expressing GFP or Flag-OGT and treated with BafA1 as indicated. LC3-II levels were determined by immunoblotting and quantified by densitometry of three independent experiments. Data are shown as mean ± SEM. (*) P < 0.05; (**) P < 0.01; (***) P < 0.001 by Student's t-test (A,D) or one-way ANOVA (E).
Figure 3. OGT promotes autophagy in cultured cells. (A) HEK293T cells were treated with TMG overnight and then starved in the presence or absence of BafA1, and levels of O-GlcNAc, LC3-II, and SQSTM1 were determined by Western blotting. LC3-II densitometry is shown at the right. (B,C) Primary hepatocytes from mice (B) and humans (C) were treated with TMG overnight, and levels of O-GlcNAc and LC3-II were determined by Western blotting. Relative levels of LC3-II and SQSTM1 were quantified by densitometry of three independent experiments. (D) Stable HeLa cells expressing YFP-LC3 were treated overnight with TMG followed by BafA1 for 3 h. LC3 puncta were observed by confocal microscopy, and the statistics are shown at the right. n = 123–144. Bar, 50 µm. (E) HEK293T cells were transfected with empty vector or OGT and treated as indicated. LC3-II levels were determined by immunoblotting. Densitometry is shown at the right. (F) Primary mouse hepatocytes were infected with adenoviruses expressing GFP or Flag-OGT and treated with BafA1 as indicated. LC3-II levels were determined by immunoblotting and quantified by densitometry of three independent experiments. Data are shown as mean ± SEM. (*) P < 0.05; (**) P < 0.01; (***) P < 0.001 by Student's t-test (A,D) or one-way ANOVA (E).CC BY-NC · PubMed Central
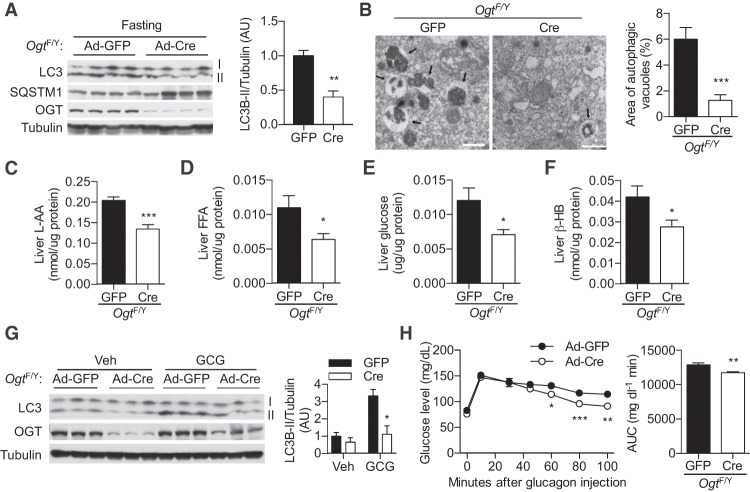
Figure 4. Hepatic OGT mediates metabolic adaptation to starvation. (A) OgtF/Y mice infected with adenoviruses encoding GFP (control) or Cre (Ogt-LKO) were fasted for 24 h, and autophagy markers in liver lysates were determined by Western blotting. Each lane represents an individual mouse. Densitometry of LC3-II is shown at the right. (B) Representative electron micrographs of livers from 24-h fasted control and Ogt-LKO mice. Statistics of the area percentage of autophagic vacuoles is shown at the right. n = 21–36. Bars, 1 µm. Arrows indicate autophagic vacuoles. (C–F) Levels of free L-AA (C), FFA (D), glucose (E), and β-HB (F) in the livers of overnight fasted mice. n = 7. (G) Hepatic LC3-II levels in control and Ogt-LKO mice treated with saline (Veh) or glucagon (GCG) for 1 h. Each lane represents an individual mouse. Densitometry of LC3-II is shown at the right. (H) Glucagon stimulation test in overnight fasted control and Ogt-LKO mice. AUC is shown at the right. n = 12–14. Data are shown as mean ± SEM. (*) P < 0.05; (**) P < 0.01; (***) P < 0.001 by Student's t-test.
Figure 4. Hepatic OGT mediates metabolic adaptation to starvation. (A) OgtF/Y mice infected with adenoviruses encoding GFP (control) or Cre (Ogt-LKO) were fasted for 24 h, and autophagy markers in liver lysates were determined by Western blotting. Each lane represents an individual mouse. Densitometry of LC3-II is shown at the right. (B) Representative electron micrographs of livers from 24-h fasted control and Ogt-LKO mice. Statistics of the area percentage of autophagic vacuoles is shown at the right. n = 21–36. Bars, 1 µm. Arrows indicate autophagic vacuoles. (C–F) Levels of free L-AA (C), FFA (D), glucose (E), and β-HB (F) in the livers of overnight fasted mice. n = 7. (G) Hepatic LC3-II levels in control and Ogt-LKO mice treated with saline (Veh) or glucagon (GCG) for 1 h. Each lane represents an individual mouse. Densitometry of LC3-II is shown at the right. (H) Glucagon stimulation test in overnight fasted control and Ogt-LKO mice. AUC is shown at the right. n = 12–14. Data are shown as mean ± SEM. (*) P < 0.05; (**) P < 0.01; (***) P < 0.001 by Student's t-test.CC BY-NC · PubMed Central
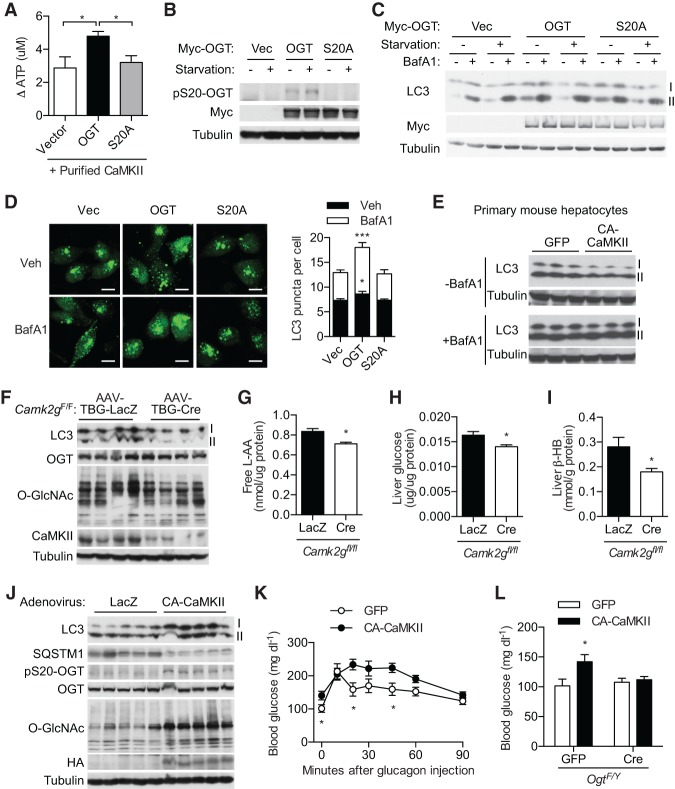
Figure 5. CaMKII controls OGT activity and liver autophagy. (A) CaMKII kinase activity on wild-type and S20A OGT. n = 4. (B) HEK293T cells were transfected with wild-type or S20A mutant OGT and then starved in Earle's balanced salt solution (EBSS) for 3 h. Phospho-S20-specific antibody was used for immunoblotting. (C) Immunoblotting of LC3 of 293T cells transfected with wild-type or S20A mutant OGT followed by treatments as indicated. (D) Stable HeLa cells expressing YFP-LC3 were transfected with OGT constructs, and LC3 puncta were visualized. Statistics are shown at the right. n = 66–104. Bar, 10 µm. (E) LC3-II levels in primary hepatocytes expressing GFP or constitutively active mutant CaMKII (CA-CaMKII) in the absence or presence of BafA1. (F–I) Diet-induced obese Camk2gF/F mice were treated with hepatocyte-specific AAV-TBG-LacZ or AAV-TBG-Cre and fasted for 5 h. (F) Immunoblotting of liver lysates. Levels of free L-AA (G), glucose (H), and β-HB (I) are shown. n = 4. (J) Immunoblotting of liver lysates from overnight fasted mice treated with Ad-LacZ and Ad-CA-CaMKII. (K) Glucagon stimulation test of overnight fasted mice. n = 5. (L) Ad-CA-CaMKII and Ad-Cre were coinjected into OgtF/Y mice to generate mice overexpressing hepatic CA-CaMKII on an Ogt-LKO background. Blood glucose levels in overnight fasted mice are shown. n = 5. Each lane represents an individual mouse sample in E, F, and J. Data are shown as mean ± SEM. (*) P < 0.05; (***) P < 0.001 by one-way ANOVA (A,D) and Student's t-test (G–I,K,L).
Figure 5. CaMKII controls OGT activity and liver autophagy. (A) CaMKII kinase activity on wild-type and S20A OGT. n = 4. (B) HEK293T cells were transfected with wild-type or S20A mutant OGT and then starved in Earle's balanced salt solution (EBSS) for 3 h. Phospho-S20-specific antibody was used for immunoblotting. (C) Immunoblotting of LC3 of 293T cells transfected with wild-type or S20A mutant OGT followed by treatments as indicated. (D) Stable HeLa cells expressing YFP-LC3 were transfected with OGT constructs, and LC3 puncta were visualized. Statistics are shown at the right. n = 66–104. Bar, 10 µm. (E) LC3-II levels in primary hepatocytes expressing GFP or constitutively active mutant CaMKII (CA-CaMKII) in the absence or presence of BafA1. (F–I) Diet-induced obese Camk2gF/F mice were treated with hepatocyte-specific AAV-TBG-LacZ or AAV-TBG-Cre and fasted for 5 h. (F) Immunoblotting of liver lysates. Levels of free L-AA (G), glucose (H), and β-HB (I) are shown. n = 4. (J) Immunoblotting of liver lysates from overnight fasted mice treated with Ad-LacZ and Ad-CA-CaMKII. (K) Glucagon stimulation test of overnight fasted mice. n = 5. (L) Ad-CA-CaMKII and Ad-Cre were coinjected into OgtF/Y mice to generate mice overexpressing hepatic CA-CaMKII on an Ogt-LKO background. Blood glucose levels in overnight fasted mice are shown. n = 5. Each lane represents an individual mouse sample in E, F, and J. Data are shown as mean ± SEM. (*) P < 0.05; (***) P < 0.001 by one-way ANOVA (A,D) and Student's t-test (G–I,K,L).CC BY-NC · PubMed Central
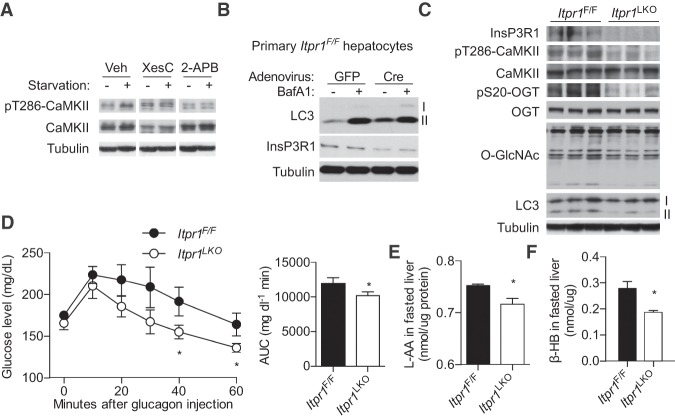
Figure 6. InsP3R1 regulates liver autophagy. (A) HEK293T cells were starved in EBSS medium in the absence or presence of the InsP3R antagonist XesC or 2-APB for 3 h. Phospho-T286-CaMKII was determined by immunoblotting. (B) Primary hepatocytes from Itpr1F/F mice were infected with Ad-GFP or Ad-CA-CaMKII, and then LC3-II levels were determined by Western blotting. (C) Immunoblotting of liver lysates from overnight fasted control and Itpr1-LKO mice. Each lane represents an individual mouse. (D) Glucagon stimulation tests of 6-h fasted control and Itpr1-LKO mice. AUC is shown at the right. n = 8. (E,F) Hepatic L-AA levels (E) and serum β-HB levels (F) of overnight fasted control and Itpr1-LKO mice. n = 8. Data are shown as mean ± SEM. (*) P < 0.05 by Student's t-test.
Figure 6. InsP3R1 regulates liver autophagy. (A) HEK293T cells were starved in EBSS medium in the absence or presence of the InsP3R antagonist XesC or 2-APB for 3 h. Phospho-T286-CaMKII was determined by immunoblotting. (B) Primary hepatocytes from Itpr1F/F mice were infected with Ad-GFP or Ad-CA-CaMKII, and then LC3-II levels were determined by Western blotting. (C) Immunoblotting of liver lysates from overnight fasted control and Itpr1-LKO mice. Each lane represents an individual mouse. (D) Glucagon stimulation tests of 6-h fasted control and Itpr1-LKO mice. AUC is shown at the right. n = 8. (E,F) Hepatic L-AA levels (E) and serum β-HB levels (F) of overnight fasted control and Itpr1-LKO mice. n = 8. Data are shown as mean ± SEM. (*) P < 0.05 by Student's t-test.CC BY-NC · PubMed Central
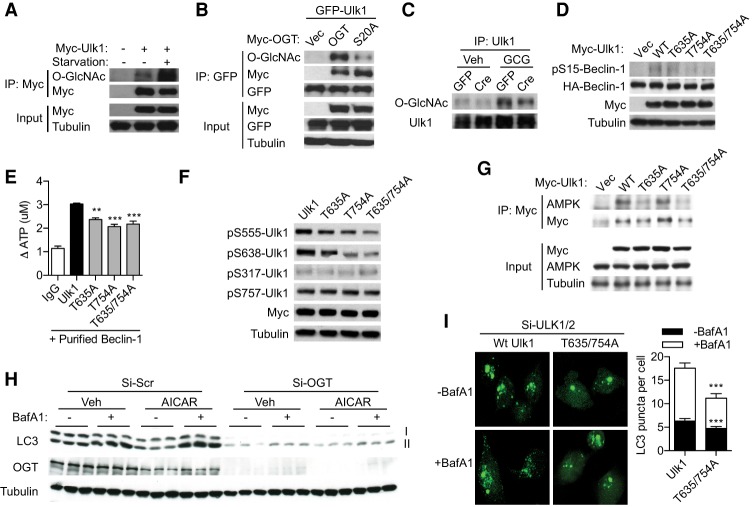
Figure 7. O-GlcNAcylation modulates Ulk phosphorylation and activity. (A) O-GlcNAcylation of Ulk1 in HEK293T cells treated with or without EBSS starvation for 3 h. (B) Ulk1 O-GlcNAcylation in 293T cells cotransfected with wild-type or S20A mutant OGT. (C) Ulk1 O-GlcNAcylation in livers from control or Ogt-LKO mice treated with saline or glucagon for 1 h. (D) Phosphorylation levels of Beclin-1 at S15 when cotransfected with wild-type or O-GlcNAc site-mutated Ulk1 in 293T cells. (E) In vitro Ulk1 activity assay using purified Beclin-1 as the substrate. n = 3. (F) Site-specific phosphorylation of wild-type and O-GlcNAc site-mutated Ulk1 in 293T cells. (G) Interaction between overexpressed Ulk1 proteins and endogenous AMPK as shown by immunoprecipitation in 293T cells. (H) 293T cells transfected with siRNAs against scrambled sequence (Si-Scr) or human OGT (Si-OGT) were treated with or without AICAR in the presence or absence of BafA1 for 4 h. LC3-II levels were determined by immunoblotting. (I) Wild-type or T635/754A mutant mouse Ulk1 proteins were reconstituted into YFP-LC3 stable HeLa cells in which endogenous ULK1 and ULK2 were knocked down. Cells were treated with vehicle or BafA1. LC3 puncta were counted and are plotted at the right. n = 18–35. Data are shown as mean ± SEM. (**) P < 0.01; (***) P < 0.001 by ANOVA (E) or Student's t-test (I).
Figure 7. O-GlcNAcylation modulates Ulk phosphorylation and activity. (A) O-GlcNAcylation of Ulk1 in HEK293T cells treated with or without EBSS starvation for 3 h. (B) Ulk1 O-GlcNAcylation in 293T cells cotransfected with wild-type or S20A mutant OGT. (C) Ulk1 O-GlcNAcylation in livers from control or Ogt-LKO mice treated with saline or glucagon for 1 h. (D) Phosphorylation levels of Beclin-1 at S15 when cotransfected with wild-type or O-GlcNAc site-mutated Ulk1 in 293T cells. (E) In vitro Ulk1 activity assay using purified Beclin-1 as the substrate. n = 3. (F) Site-specific phosphorylation of wild-type and O-GlcNAc site-mutated Ulk1 in 293T cells. (G) Interaction between overexpressed Ulk1 proteins and endogenous AMPK as shown by immunoprecipitation in 293T cells. (H) 293T cells transfected with siRNAs against scrambled sequence (Si-Scr) or human OGT (Si-OGT) were treated with or without AICAR in the presence or absence of BafA1 for 4 h. LC3-II levels were determined by immunoblotting. (I) Wild-type or T635/754A mutant mouse Ulk1 proteins were reconstituted into YFP-LC3 stable HeLa cells in which endogenous ULK1 and ULK2 were knocked down. Cells were treated with vehicle or BafA1. LC3 puncta were counted and are plotted at the right. n = 18–35. Data are shown as mean ± SEM. (**) P < 0.01; (***) P < 0.001 by ANOVA (E) or Student's t-test (I).CC BY-NC · PubMed Central

Verification

Claims the paper makes

The claims and statistics of this paper haven’t been checked yet.

Run the check — free, no account needed. It reads the open-access text and checks the sources it cites.

A few free checks a day · papers already verified open instantly · results are public

Claims other papers make about this one

Each is checked against this paper’s own text: does it say what the citing paper says it does?

Self-check

Percentages, sums and reported differences re-computed from the paper’s own numbers.

The self-check needs the paper’s full text.

Citations

Cites

Show all 10 references

Research works printed but not linked: 51

  1. 10.1128/MCB.06159-11 · DOI · Paper page
  2. 10.1073/pnas.1200425109 · DOI
  3. 1968, Studies on cellular autophagocytosis. The formation of autophagic vacuoles in the liver after glucagon administration, Am J Pathol, 53, 687
  4. 10.1073/pnas.0912658106 · DOI
  5. 10.1146/annurev-nutr-071812-161240 · DOI
  6. 10.1074/jbc.M113.523068 · DOI
  7. 10.1074/jbc.M801222200 · DOI
  8. 10.1016/j.jhep.2013.02.031 · DOI
  9. 10.1111/j.1463-1326.2011.01449.x · DOI · Paper page
  10. 10.4161/auto.7.12.17909 · DOI · Paper page
  11. 10.1126/science.1196371 · DOI · Paper page
  12. 10.1038/nature12537 · DOI
  13. 10.4161/auto.7.7.15371 · DOI
  14. 10.1152/ajpendo.00236.2014 · DOI
  15. 2017, Hepatic inositol 1,4,5 trisphosphate receptor type 1 mediates fatty liver, Hepatol Commun, 1, 23, 10.1002/hep4.1012 · DOI
  16. 10.1210/en.2005-0523 · DOI
  17. 10.1038/ncb3066 · DOI
  18. 10.1038/nrm3334 · DOI · Paper page
  19. 10.1146/annurev-biochem-060608-102511 · DOI · Paper page
  20. 10.1016/j.cell.2010.12.001 · DOI · Paper page
  21. 10.1152/ajpendo.00492.2002 · DOI · Paper page
  22. 2014, O-GlcNAcylation and metabolic reprograming in cancer, Front Endocrinol, 5, 145
  23. 10.1074/jbc.M109.026351 · DOI
  24. 10.1093/jb/mvs059 · DOI
  25. 10.1016/j.cmet.2012.12.015 · DOI
  26. 10.1126/science.1217032 · DOI · Paper page
  27. 10.1038/ncb3114 · DOI
  28. 10.1074/jbc.M113.456228 · DOI
  29. 10.1038/ncb2708 · DOI
  30. 10.1016/j.cmet.2012.03.002 · DOI
  31. 10.1007/s00018-015-1889-z · DOI
  32. 10.1152/ajpcell.00536.2003 · DOI
  33. 10.1016/j.cmet.2012.07.006 · DOI · Paper page
  34. 10.1074/mcp.R113.029751 · DOI
  35. 10.1016/j.tem.2013.02.002 · DOI
  36. 10.1038/nrd3802 · DOI
  37. 10.1038/ncb2757 · DOI · Paper page
  38. 10.1073/pnas.76.7.3169 · DOI
  39. 10.1073/pnas.100471497 · DOI
  40. 10.1073/pnas.1100844108 · DOI · Paper page
  41. 10.1126/science.1099993 · DOI
  42. 10.1074/jbc.M707328200 · DOI
  43. 1984, Topography and polypeptide distribution of terminal N-acetylglucosamine residues on the surfaces of intact lymphocytes. Evidence for O-linked GlcNAc, J Biol Chem, 259, 3308, 10.1016/S0021-9258(17)43295-9 · DOI
  44. 10.1074/mcp.O112.018366 · DOI
  45. 10.2337/diabetes.49.12.2070 · DOI
  46. 10.1073/pnas.1205748109 · DOI
  47. 10.1074/jbc.M109.077818 · DOI
  48. 10.1016/j.cmet.2005.06.005 · DOI
  49. 10.1093/nar/gku236 · DOI
  50. 2017, Protein O-GlcNAcylation: emerging mechanisms and functions, Nat Rev Mol Cell Biol, 18, 452, 10.1038/nrm.2017.22 · DOI
  51. 10.1038/nature06668 · DOI

Cited by

Sorted by citations

Metadata

Authors
Ruan, H.-B., Ma, Y., Torres, S., Zhang, B., Feriod, C., Heck, R. M., Qian, K., Fu, M., Li, X., Nathanson, M. H., Bennett, A. M., Nie, Y., Ehrlich, B. E., & Yang, X.
Venue
Genes & Development
Published
2017-08-15
Volume
31
Issue
16
Pages
1655-1665
ISSN
  • 0890-9369
  • 1549-5477
Cited by
151
References
10
Language
en
Funders
  • National Institutes of Health (R01DK089098, R01DK102648, CT DPH2014-0139)
  • American Cancer Society
  • Ellison Medical Foundation
  • NIH (P01DK57751, P30DK34989)
  • American Heart Association (14SDG20120052)

About these checks

Registry, retraction, Cites and statistics results are computed, not judged, with one exception: a printed reference that no index lists is read once by a model before it counts as a citation error. Claims are extracted by a model and kept only when their quote appears verbatim in the text; each cited source is then checked, with a model’s help, for whether it says what the claim relies on. Those verdicts can be wrong — read the claim’s quote and the cited source before relying on one.

Statistics and arithmetic are recomputed, not judged.

Confidence bands are shown only for fields calibrated on our annotated test set. None is calibrated yet, so no band is shown.

What counts as a claim ›How we measure confidence ›How we check this ›

Are you an author, or do you see a problem with this page? Request a review