

The DOI matches its Crossref record; 70 of the 70 references it cites were found in a registry or an index.
Genetic and environmental control of host-gut microbiota interactions
Open accessAbstract
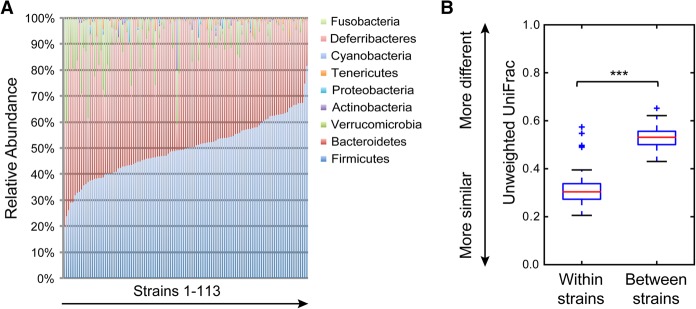
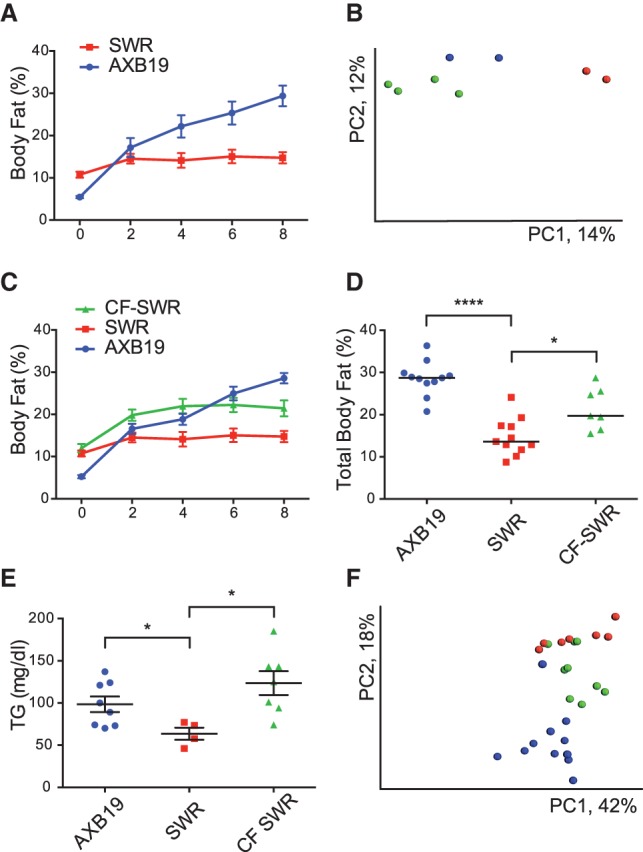
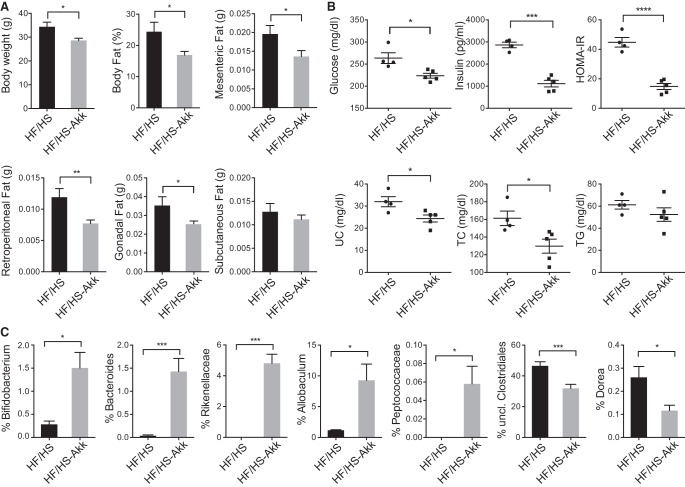
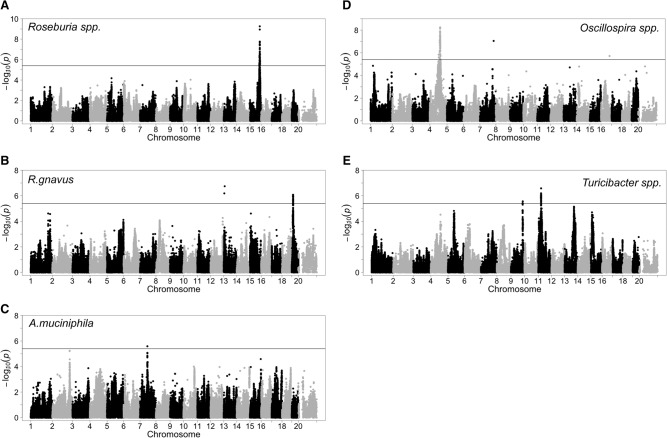
Genetics provides a potentially powerful approach to dissect host-gut microbiota interactions. Toward this end, we profiled gut microbiota using 16s rRNA gene sequencing in a panel of 110 diverse inbred strains of mice. This panel has previously been studied for a wide range of metabolic traits and can be used for high-resolution association mapping. Using a SNP-based approach with a linear mixed model, we estimated the heritability of microbiota composition. We conclude that, in a controlled environment, the genetic background accounts for a substantial fraction of abundance of most common microbiota. The mice were previously studied for response to a high-fat, high-sucrose diet, and we hypothesized that the dietary response was determined in part by gut microbiota composition. We tested this using a cross-fostering strategy in which a strain showing a modest response, SWR, was seeded with microbiota from a strain showing a strong response, A×B19. Consistent with a role of microbiota in dietary response, the cross-fostered SWR pups exhibited a significantly increased response in weight gain. To examine specific microbiota contributing to the response, we identified various genera whose abundance correlated with dietary response. Among these, we chose Akkermansia muciniphila, a common anaerobe previously associated with metabolic effects. When administered to strain A×B19 by gavage, the dietary response was significantly blunted for obesity, plasma lipids, and insulin resistance. In an effort to further understand host-microbiota interactions, we mapped loci controlling microbiota composition and prioritized candidate genes. Our publicly available data provide a resource for future studies.
Overview
The claims and statistics of this paper haven’t been checked yet.
Run the check — free, no account needed. It reads the open-access text and checks the sources it cites.
Integrity signals
Registry
Cites
Statistics
Figures
Verification
Claims the paper makes
The claims and statistics of this paper haven’t been checked yet.
Run the check — free, no account needed. It reads the open-access text and checks the sources it cites.
Claims other papers make about this one
Each is checked against this paper’s own text: does it say what the citing paper says it does?
In the citing paper
“Recent multi-omic studies [31, 33, 34] have revealed an impact of gut microbiota on host responses to dietary challenge and on epigenetic programming.”
From Multi-omics approaches to disease (2017) · cites this paper as [33]
Self-check
Percentages, sums and reported differences re-computed from the paper’s own numbers.
The self-check needs the paper’s full text.
Citations
Cites
QIIME allows analysis of high-throughput community sequencing data
Caporaso, J. G., Kuczynski, J., Stombaugh, J., Bittinger, K., Bushman, F. D., Costello, E. K., Fierer, N., Peña, A. G., Goodrich, J. K., Gordon, J. I., et al. (2010) · Nature Methods · doi:10.1038/nmeth.f.303 · Cited by 34,887
Self-citationIntroduction to Quantitative Genetics.
Edwards, A. W. F., & Falconer, D. S. (1982) · Biometrics · doi:10.2307/2529912 · Cited by 21,447
Search and clustering orders of magnitude faster than BLAST
Edgar, R. C. (2010) · Bioinformatics · doi:10.1093/bioinformatics/btq461 · Cited by 21,098
An obesity-associated gut microbiome with increased capacity for energy harvest
Turnbaugh, P. J., Ley, R. E., Mahowald, M. A., Magrini, V., Mardis, E. R., & Gordon, J. I. (2006) · Nature · doi:10.1038/nature05414 · Cited by 12,444
Structure, function and diversity of the healthy human microbiome
The Human Microbiome Project Consortium (2012) · Nature · doi:10.1038/nature11234 · Cited by 11,726
Ultra-high-throughput microbial community analysis on the Illumina HiSeq and MiSeq platforms
Caporaso, J. G., Lauber, C. L., Walters, W. A., Berg-Lyons, D., Huntley, J., Fierer, N., Owens, S. M., Betley, J., Fraser, L., Bauer, M., et al. (2012) · The ISME Journal · doi:10.1038/ismej.2012.8 · Cited by 8,839
Self-citationDiversity of the Human Intestinal Microbial Flora
Eckburg, P. B., Bik, E. M., Bernstein, C. N., Purdom, E., Dethlefsen, L., Sargent, M., Gill, S. R., Nelson, K. E., & Relman, D. A. (2005) · Science · doi:10.1126/science.1110591 · Cited by 7,913
A core gut microbiome in obese and lean twins
Turnbaugh, P. J., Hamady, M., Yatsunenko, T., Cantarel, B. L., Duncan, A., Ley, R. E., Sogin, M. L., Jones, W. J., Roe, B. A., Affourtit, J. P., et al. (2009) · Nature · doi:10.1038/nature07540 · Cited by 7,823
Self-citationLinking long-term dietary patterns with gut microbial enterotypes
Wu, G. D., Chen, J., Hoffmann, C., Bittinger, K., Chen, Y.-Y., Keilbaugh, S. A., Bewtra, M., Knights, D., Walters, W. A., Knight, R., et al. (2011) · Science · doi:10.1126/science.1208344 · Cited by 6,513
Self-citationThe gut microbiota as an environmental factor that regulates fat storage
Bäckhed, F., Ding, H., Wang, T., Hooper, L. V., Koh, G. Y., Nagy, A., Semenkovich, C. F., & Gordon, J. I. (2004) · Proceedings of the National Academy of Sciences · doi:10.1073/pnas.0407076101 · Cited by 6,245
Cited by
Sorted by citations
Items 401–402 of 402
Zhou, Q., Wang, K., Chen, J., Wang, H., Tan, X., Huang, X., Lin, Z., Xu, X., Jin, X., Zhang, S., et al. (2026) · Advanced Science · doi:10.1002/advs.78201
Liu, X., Wang, S., Long, W., Tan, X., Li, W., & Gao, L. (2026) · Frontiers in Aging Neuroscience · doi:10.3389/fnagi.2026.1926883
Metadata
- Authors
- Org, E., Parks, B. W., Joo, J. W. J., Emert, B., Schwartzman, W., Kang, E. Y., Mehrabian, M., Pan, C., Knight, R., Gunsalus, R., Drake, T. A., Eskin, E., & Lusis, A. J.
- Affiliations
- University of California, Los Angeles (US)
- University of California San Diego (US)
- ORCID
- Venue
- Genome Research
- Publisher
- Cold Spring Harbor Laboratory
- Published
- 2015-08-10
- Volume
- 25
- Issue
- 10
- Pages
- 1558-1569
- ISSN
- 1088-9051 (ISSN-L)
- 1549-5469
- PMC
- PMC4579341
- OpenAlex
- W2161377204
- Cited by
- 381
- References
- 70
- Citations by year
- 2026: 8 · 2025: 16 · 2024: 28 · 2023: 34 · 2022: 36 · 2021: 75 · 2020: 41 · 2019: 27 · 2018: 38 · 2017: 36 · 2016: 38 · 2015: 3
- Type
- posted content
- Language
- en
- Open access
- bronze
- doi.org
- Locations
- Genome Research (publishedVersion)
- PubMed Central (publishedVersion, cc-by)
- PubMed (publishedVersion)
- eScholarship (California Digital Library) (submittedVersion, cc-by)
- Funders
- National Institutes of Health (HL028481, HL30568, DK094311)
- UCLA Iris Cantor Women's Health Center
- MOBILITAS Postdoctoral Research (MJD252, 330381)
- NIH (T32-HD07228)
- Topics
- Life Sciences › Biochemistry, Genetics and Molecular Biology › Molecular Biology › Gut microbiota and health
- Life Sciences › Biochemistry, Genetics and Molecular Biology › Genetics › Nutrition, Genetics, and Disease
- Health Sciences › Dentistry › Periodontics › Oral microbiology and periodontitis research
- Keywords
- gut microbiota composition, inbred mouse strains, association mapping, cross-fostering, high-fat high-sugar diet, Akkermansia muciniphila, obesity, insulin resistance, plasma lipids, candidate genes
- MeSH terms
- Gastrointestinal Microbiome, Animals, Diet, Environment, Female, Male, Mice, Inbred Strains, Obesity, RNA, Ribosomal, 16S, Sucrose, Heredity, Mice, Genome-Wide Association Study, Diet, High-Fat
About these checks
Registry, retraction, Cites and statistics results are computed, not judged, with one exception: a printed reference that no index lists is read once by a model before it counts as a citation error. Claims are extracted by a model and kept only when their quote appears verbatim in the text; each cited source is then checked, with a model’s help, for whether it says what the claim relies on. Those verdicts can be wrong — read the claim’s quote and the cited source before relying on one.
Statistics and arithmetic are recomputed, not judged.
Confidence bands are shown only for fields calibrated on our annotated test set. None is calibrated yet, so no band is shown.
What counts as a claim ›How we measure confidence ›How we check this ›
Are you an author, or do you see a problem with this page? Request a review
