Cited by 15

The DOI matches its Crossref record.

Imaging the Ultrafast Coherent Control of a Skyrmion Crystal

Tengdin, Phoebe, Truc, Benoit, Sapozhnik, Alexey, Kong, Lingyao, del Ser, Nina, Gargiulo, Simone, Madan, Ivan, Schönenberger, Thomas, Baral, Priya R., Che, Ping, Magrez, Arnaud, Grundler, Dirk, Rønnow, Henrik M., Lagrange, Thomas, Zang, Jiadong, Rosch, Achim, Carbone, Fabrizio·2022·Physical Review X

Overview

The claims and statistics of this paper haven’t been checked yet.

Run the check — free, no account needed. It reads the open-access text and checks the sources it cites.

A few free checks a day · papers already verified open instantly · results are public

Integrity signals

Registry

Crossref · 10.1103/physrevx.12.041030

Cites

Statistics

Figures

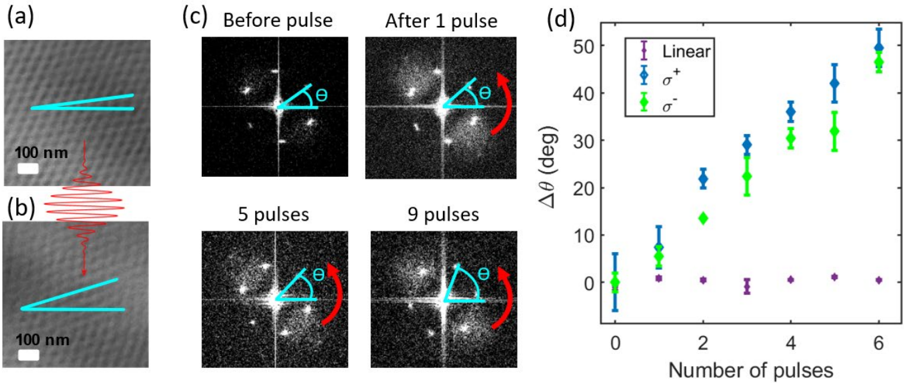
FIG. 1 Illustration and schematic of laser-driven skyrmion crystal rotation process. (a) Real space images of skyrmion crystal in Cu2OseO3 taken before excitation with the laser pulse and
FIG. 1 Illustration and schematic of laser-driven skyrmion crystal rotation process. (a) Real space images of skyrmion crystal in Cu2OseO3 taken before excitation with the laser pulse andCC-BY · From the PDF
Image 2
CC-BY · From the PDF
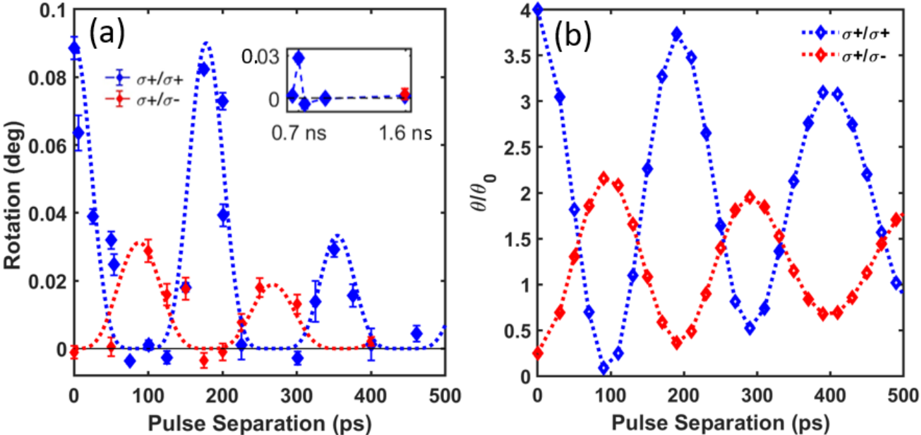
FIG 3 Detailed time dependence of skyrmion crystal rotation. (a) Double pulse timed experiments showing the rotation of the skyrmion crystal observed as function of delay between the two pump pulses. The pulses either have both σ + polarization (blue points) or a sequence of σ + /σ -polarization (red points). For the blue points we used pulses of equal amplitude and observe a coherent oscillation in the amplitude of rotation with a period of 175 ps that damps out progressively over a nanosecond . For the case of σ + /σ -polarization, the second pulse of σ -polarization has half the amplitude of the first one (with σ + polarization). Here we observe rotation with approximately half the amplitude out of phase with the previous oscillation. The blue/red dashed lines are a guide for the eye. Error bars (95% confidence intervals) are within the markers used. (b ) Theoretical prediction of the rotation angle θ / θ0 for such pulse sequences in a clean system where θ0 is the rotation angle for a single pulse. The theory is based on the calculation of rotational torques arising from breathing-mode oscillations, see SI.
FIG 3 Detailed time dependence of skyrmion crystal rotation. (a) Double pulse timed experiments showing the rotation of the skyrmion crystal observed as function of delay between the two pump pulses. The pulses either have both σ + polarization (blue points) or a sequence of σ + /σ -polarization (red points). For the blue points we used pulses of equal amplitude and observe a coherent oscillation in the amplitude of rotation with a period of 175 ps that damps out progressively over a nanosecond . For the case of σ + /σ -polarization, the second pulse of σ -polarization has half the amplitude of the first one (with σ + polarization). Here we observe rotation with approximately half the amplitude out of phase with the previous oscillation. The blue/red dashed lines are a guide for the eye. Error bars (95% confidence intervals) are within the markers used. (b ) Theoretical prediction of the rotation angle θ / θ0 for such pulse sequences in a clean system where θ0 is the rotation angle for a single pulse. The theory is based on the calculation of rotational torques arising from breathing-mode oscillations, see SI.CC-BY · From the PDF
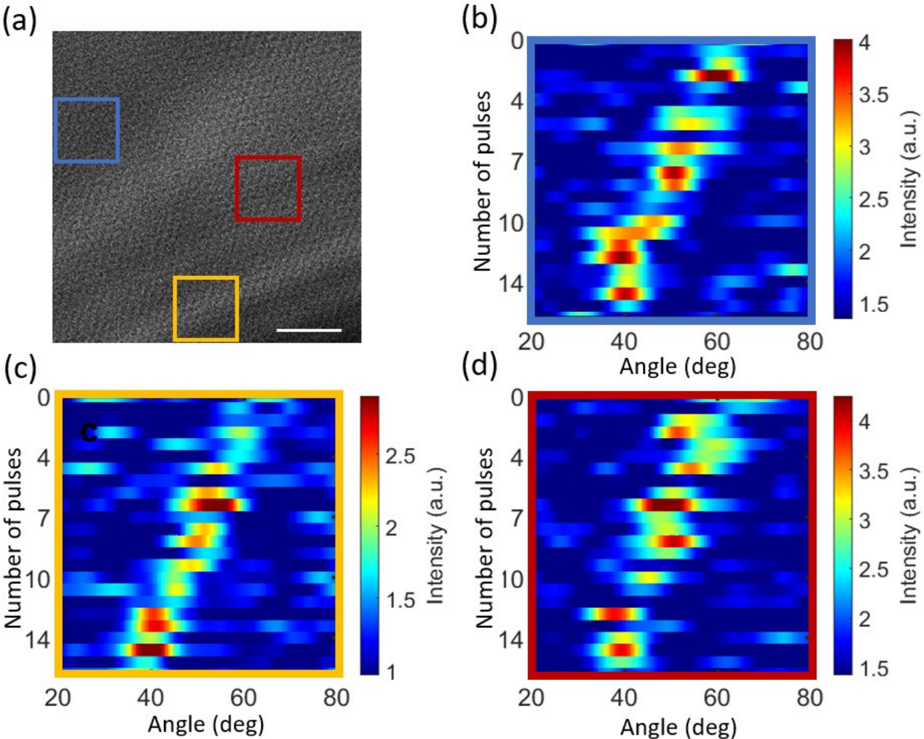
FIG 4 Skyrmion crystal rotation in a real space image from the TEM. ( a) Real space L-TEM image of the magnetic structure in Cu2OseO3. Scale bar (bottom right) is 500 nm. Response of the skyrmion crystal after excitation by a femtosecond laser pulse train is shown for specific regions of the film in (b)-(d). We take the FT of each subsection of the image and plot the angle of a single peak in the FT as a function of the number of pulses applied to the sample. The intensity corresponds to the intensity of the peak in the Fourier transform within a region of angles. See SI for rotational maps of the entire film.
FIG 4 Skyrmion crystal rotation in a real space image from the TEM. ( a) Real space L-TEM image of the magnetic structure in Cu2OseO3. Scale bar (bottom right) is 500 nm. Response of the skyrmion crystal after excitation by a femtosecond laser pulse train is shown for specific regions of the film in (b)-(d). We take the FT of each subsection of the image and plot the angle of a single peak in the FT as a function of the number of pulses applied to the sample. The intensity corresponds to the intensity of the peak in the Fourier transform within a region of angles. See SI for rotational maps of the entire film.CC-BY · From the PDF
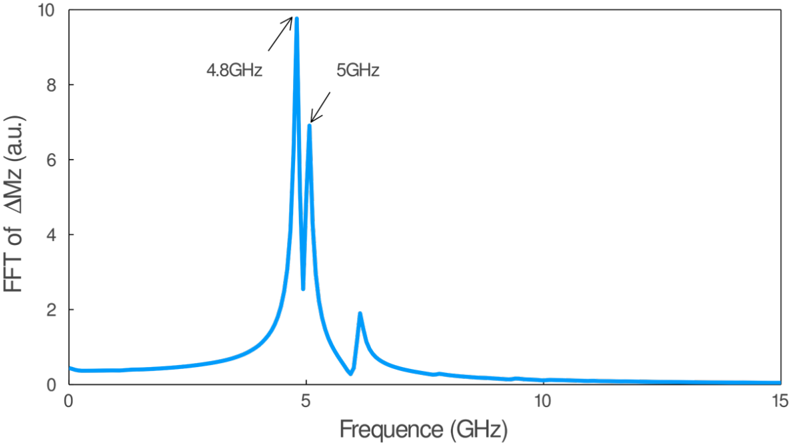
FIG. S1 Fast Fourier transformation of the total excited magnetization as a function of the excitation frequency obtained for α = 0.01 . Two collective breathing modes are labeled.
FIG. S1 Fast Fourier transformation of the total excited magnetization as a function of the excitation frequency obtained for α = 0.01 . Two collective breathing modes are labeled.CC-BY · From the PDF
Image 6
CC-BY · From the PDF
Image 7
CC-BY · From the PDF
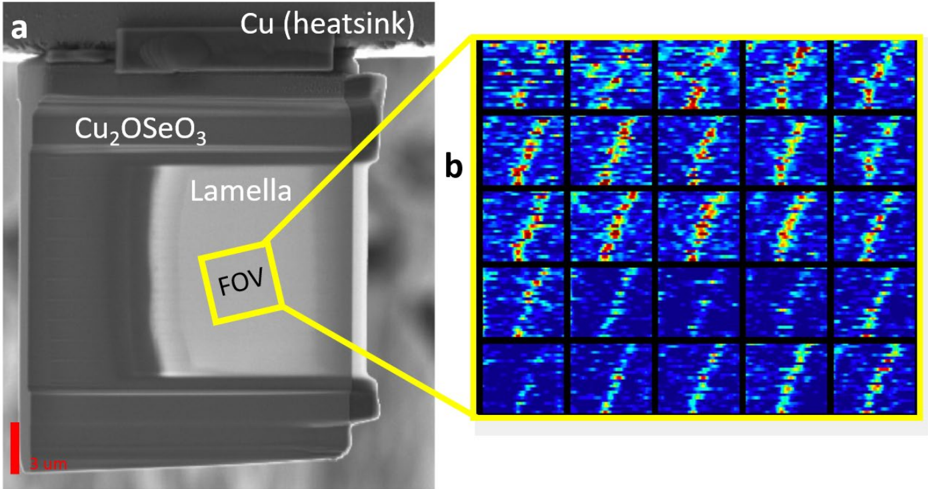
FIG. S4 (a) Scanning electron microscope image of lamella. The scale bar (bottom left) is 3 um. The range of interest (ROI) of our L-TEM images is given by the yellow box. (b) Each box maps the angle of a single point in the FT of a subsection of the image following excitation during a train of circularly polarized laser pulses (1 image for each pulse. The number of pulses sent on the y axis was 16 and the x-axis runs from 3.5 to 88 degrees.
FIG. S4 (a) Scanning electron microscope image of lamella. The scale bar (bottom left) is 3 um. The range of interest (ROI) of our L-TEM images is given by the yellow box. (b) Each box maps the angle of a single point in the FT of a subsection of the image following excitation during a train of circularly polarized laser pulses (1 image for each pulse. The number of pulses sent on the y axis was 16 and the x-axis runs from 3.5 to 88 degrees.CC-BY · From the PDF
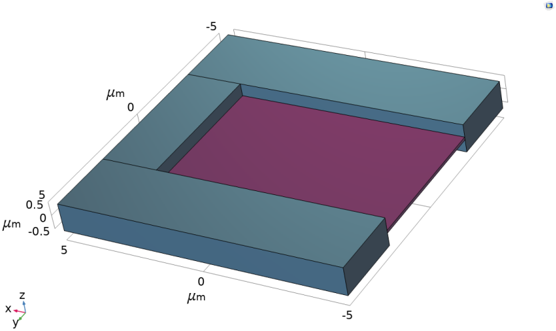
FIG. S5 Geometry of the Cu2OSeO3 sample implemented in Comsol Multiphysics. The domain has been divided in two regions: the lamella in purple and the support in grey.
FIG. S5 Geometry of the Cu2OSeO3 sample implemented in Comsol Multiphysics. The domain has been divided in two regions: the lamella in purple and the support in grey.CC-BY · From the PDF
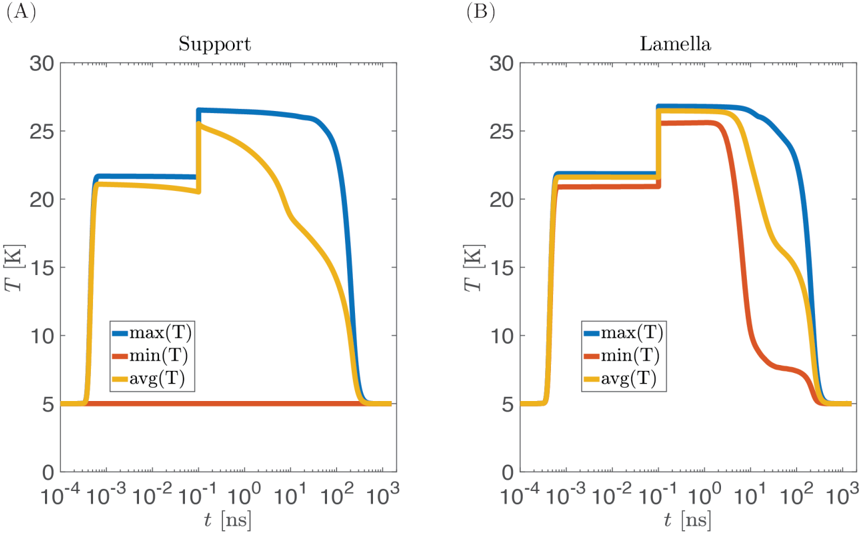
FIG. S6 Maximum (blue), minimum (red) and average (yellow) temperature obtained in the support (A) and in the lamella (B) in case two laser pulses, spaced 100 ps apart, heat the sample .
FIG. S6 Maximum (blue), minimum (red) and average (yellow) temperature obtained in the support (A) and in the lamella (B) in case two laser pulses, spaced 100 ps apart, heat the sample .CC-BY · From the PDF
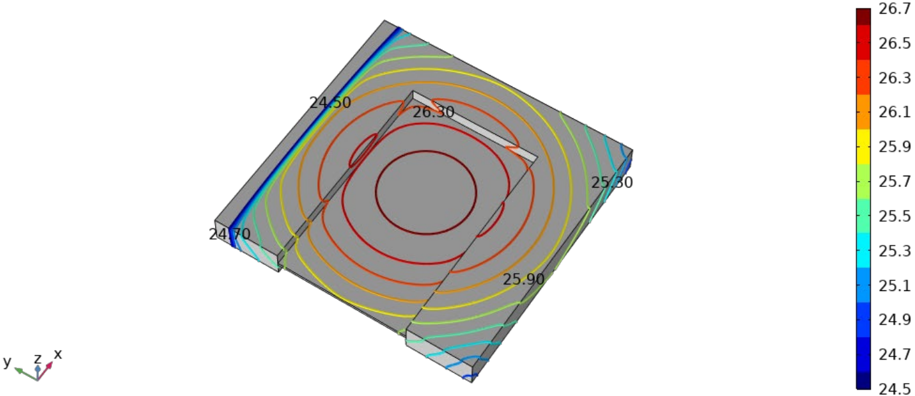
FIG. S7 Isothermal contours after two pulses laser irradiation ( 𝑡𝑡 = 120 𝑝𝑝𝑝𝑝 ) on the top surface. Black labels represent the temperature. Heat sink surface is on the top left.
FIG. S7 Isothermal contours after two pulses laser irradiation ( 𝑡𝑡 = 120 𝑝𝑝𝑝𝑝 ) on the top surface. Black labels represent the temperature. Heat sink surface is on the top left.CC-BY · From the PDF
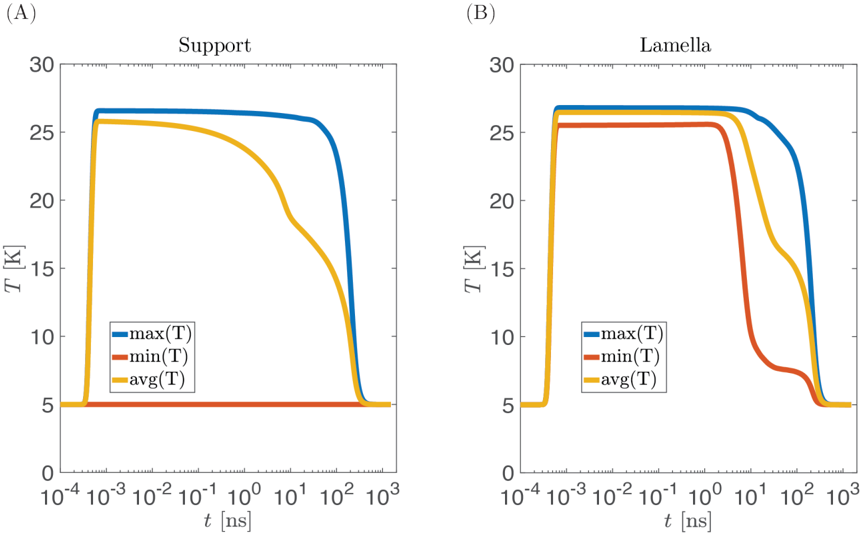
FIG. S8 Maximum (blue), minimum (red) and average (yellow) temperature obtained in the support (A) and in the lamella (B) in case two laser pulses arrive simultaneously.
FIG. S8 Maximum (blue), minimum (red) and average (yellow) temperature obtained in the support (A) and in the lamella (B) in case two laser pulses arrive simultaneously.CC-BY · From the PDF
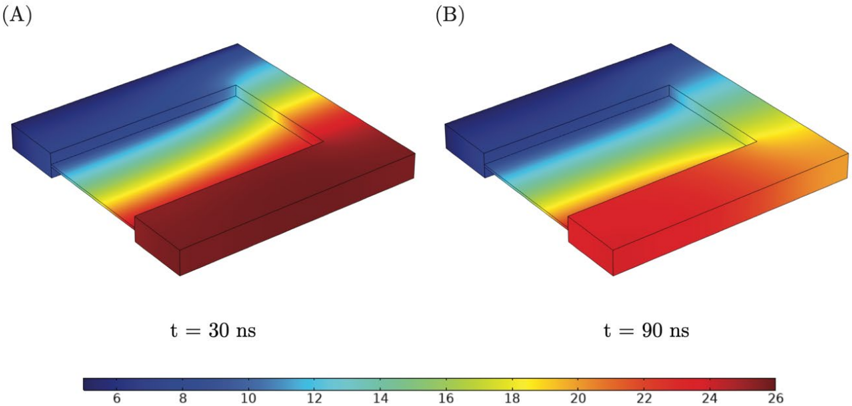
FIG. S9 Temperature map of the Cu2OSeO3 sample during the cooling phase in two different time instants: at 𝑡𝑡 = 30 𝑛𝑛𝑛𝑛 (A) and 𝑡𝑡 = 90 𝑛𝑛𝑛𝑛 (B). Color legend indicates the temperature in Kelvin. The top left surface is representative of the heat sink and it is kept at the constant temperature of 5K during the simulation.
FIG. S9 Temperature map of the Cu2OSeO3 sample during the cooling phase in two different time instants: at 𝑡𝑡 = 30 𝑛𝑛𝑛𝑛 (A) and 𝑡𝑡 = 90 𝑛𝑛𝑛𝑛 (B). Color legend indicates the temperature in Kelvin. The top left surface is representative of the heat sink and it is kept at the constant temperature of 5K during the simulation.CC-BY · From the PDF
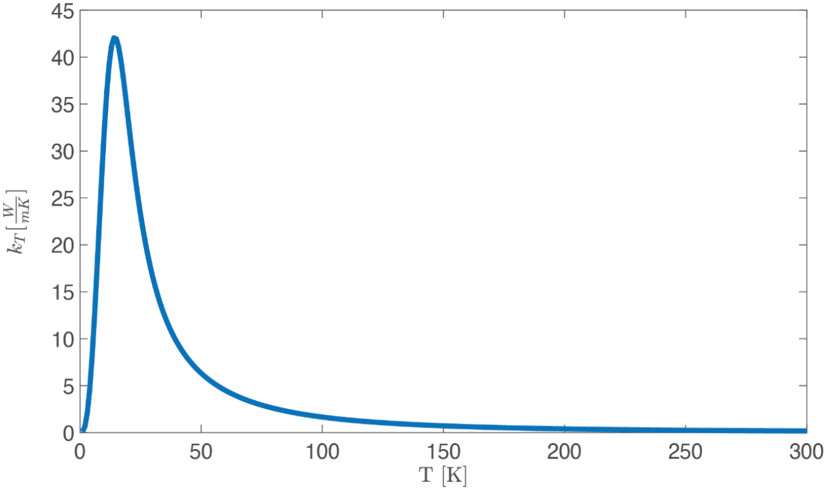
FIG. S10 Analytical heat conductivity obtained with the Callaway model using the fitting parameters of Ref. [13], θ𝐷𝐷 = 287 K and 𝑙𝑙 𝑝𝑝ℎ = 𝑙𝑙0 = 10 um.
FIG. S10 Analytical heat conductivity obtained with the Callaway model using the fitting parameters of Ref. [13], θ𝐷𝐷 = 287 K and 𝑙𝑙 𝑝𝑝ℎ = 𝑙𝑙0 = 10 um.CC-BY · From the PDF

Verification

Claims the paper makes

The claims and statistics of this paper haven’t been checked yet.

Run the check — free, no account needed. It reads the open-access text and checks the sources it cites.

A few free checks a day · papers already verified open instantly · results are public

Claims other papers make about this one

Each is checked against this paper’s own text: does it say what the citing paper says it does?

Self-check

Percentages, sums and reported differences re-computed from the paper’s own numbers.

The self-check needs the paper’s full text.

Citations

Cites

No references could be resolved yet.

Research works printed but not linked: 34

  1. 10.1038/nphys4000 · DOI
  2. 10.1038/nphys3883 · DOI
  3. 10.1063/1.1594841 · DOI
  4. 10.1126/science.1195709 · DOI
  5. 10.1038/s41467-021-25291-2 · DOI
  6. 10.1038/nnano.2013.43 · DOI · Paper page
  7. 10.1038/nphoton.2016.91 · DOI · Paper page
  8. 10.1126/science.1214143 · DOI
  9. 10.1103/PhysRevB.95.224407 · DOI
  10. 10.1063/1.4995240 · DOI
  11. 10.1038/nmat3862 · DOI
  12. 10.1103/PhysRevLett.118.207205 · DOI
  13. 10.1088/0953-8984/24/43/432201 · DOI
  14. 10.1103/PhysRevLett.113.107203 · DOI
  15. 10.1126/sciadv.aax2138 · DOI
  16. 10.1038/nature03564 · DOI
  17. 10.1103/PhysRevLett.99.047601 · DOI
  18. 10.1103/PhysRevLett.95.047402 · DOI
  19. 10.1103/PhysRevB.97.014424 · DOI
  20. 10.1103/PhysRevLett.105.197401 · DOI
  21. 10.1103/PhysRevLett.118.057201 · DOI
  22. 10.1103/PhysRevLett.119.017202 · DOI
  23. 10.1126/sciadv.aap9744 · DOI
  24. 10.1103/PhysRevLett.120.117201 · DOI
  25. 10.1103/PhysRevLett.118.097203 · DOI
  26. 10.1038/srep09552 · DOI
  27. 10.1103/PhysRevLett.15.190 · DOI
  28. 10.1103/PhysRevB.90.094423 · DOI
  29. 10.21468/SciPostPhys.11.1.009 · DOI
  30. 10.1103/PhysRevApplied.14.064014 · DOI
  31. 10.1103/PhysRevB.95.054421 · DOI · Paper page
  32. 10.1103/PhysRevLett.105.035001 · DOI
  33. 10.1364/OE.26.008778 · DOI
  34. 10.1016/j.chemphys.2013.06.026 · DOI

Cited by

Sorted by citations

See all 15

Metadata

Authors
Tengdin, P., Truc, B., Sapozhnik, A., Kong, L., del Ser, N., Gargiulo, S., Madan, I., Schönenberger, T., Baral, P. R., Che, P., Magrez, A., Grundler, D., Rønnow, H. M., Lagrange, T., Zang, J., Rosch, A., & Carbone, F.
Venue
Physical Review X
Published
2022-12-20
Volume
12
Issue
4
ISSN
2160-3308
Cited by
15
References
0
Language
en
Funders
  • European Research Council
  • Schweizerischer Nationalfonds zur Förderung der Wissenschaftlichen Forschung (171003)
  • Alexander von Humboldt-Stiftung
  • Deutsche Forschungsgemeinschaft (403505545)
  • U.S. Department of Energy
  • Basic Energy Sciences (DE-SC0020221)
  • National Natural Science Foundation of China (11974021)
  • Horizon 2020 Framework Programme (964591)
  • Google
  • CRC 1238 (277146847, 277101999)

About these checks

Registry, retraction, Cites and statistics results are computed, not judged, with one exception: a printed reference that no index lists is read once by a model before it counts as a citation error. Claims are extracted by a model and kept only when their quote appears verbatim in the text; each cited source is then checked, with a model’s help, for whether it says what the claim relies on. Those verdicts can be wrong — read the claim’s quote and the cited source before relying on one.

Statistics and arithmetic are recomputed, not judged.

Confidence bands are shown only for fields calibrated on our annotated test set. None is calibrated yet, so no band is shown.

What counts as a claim ›How we measure confidence ›How we check this ›

Are you an author, or do you see a problem with this page? Request a review

How to cite

Cite CoChat for the checks on this page, and the paper for its own findings.

This page
CoChat. (2026). Citation check: Imaging the Ultrafast Coherent Control of a Skyrmion Crystal. https://app.cochat.ai/papers/10.1103/physrevx.12.041030
The paper
Tengdin, P., Truc, B., Sapozhnik, A., Kong, L., del Ser, N., Gargiulo, S., Madan, I., Schönenberger, T., Baral, P. R., Che, P., Magrez, A., Grundler, D., Rønnow, H. M., Lagrange, T., Zang, J., Rosch, A., & Carbone, F. (2022). Imaging the Ultrafast Coherent Control of a Skyrmion Crystal. Physical Review X. https://doi.org/10.1103/physrevx.12.041030