

The DOI matches its Crossref record; 4 of the 4 references it cites were found in a registry or an index.
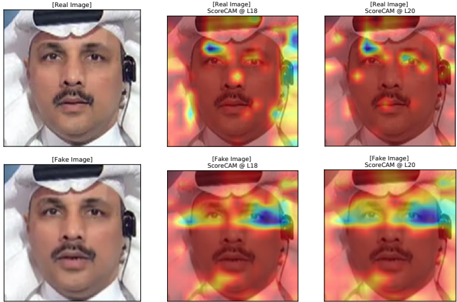
Aggregating Layers for Deepfake Detection
Overview
The claims and statistics of this paper haven’t been checked yet.
Run the check — free, no account needed. It reads the open-access text and checks the sources it cites.
Integrity signals
Registry
Cites
Statistics
Figures
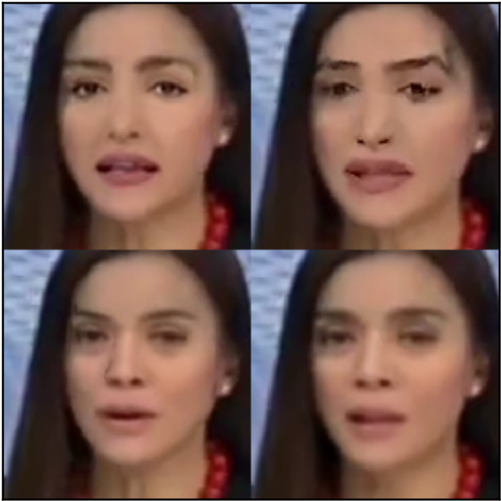
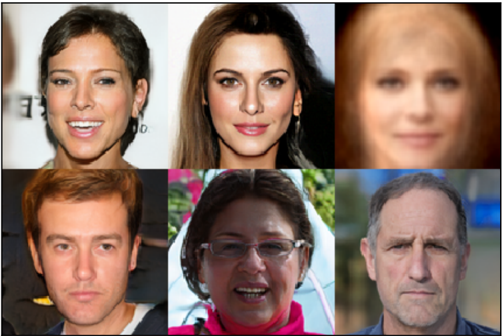
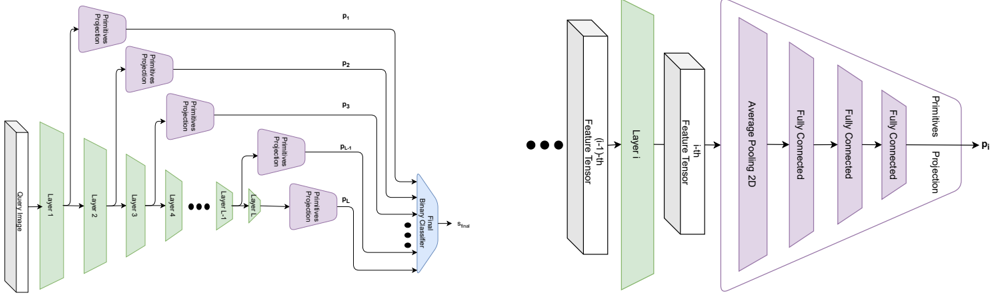
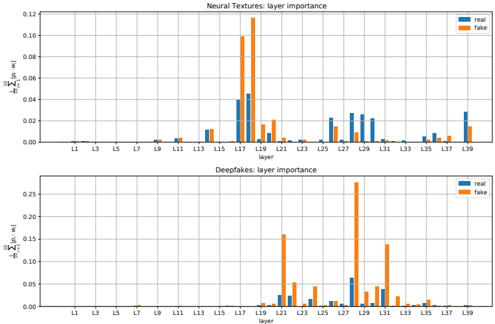
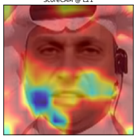
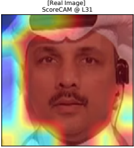
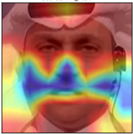
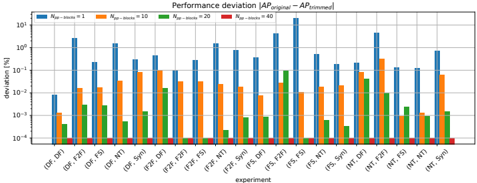
Verification
Claims the paper makes
The claims and statistics of this paper haven’t been checked yet.
Run the check — free, no account needed. It reads the open-access text and checks the sources it cites.
Claims other papers make about this one
Each is checked against this paper’s own text: does it say what the citing paper says it does?
The cited source says what the claim attributes to it.
In the citing paper
“The authors contend that a significant portion of prior research operates under the assumption that the deepfakes present in the test set are generated utilizing the identical strategies employed during the network’s training phase.”
From Deepfake forensics: a survey of digital forensic methods for multimodal deepfake identification on social media (2024) · cites this paper as Jevnisek & Avidan (2022)
The cited source says what the claim attributes to it.
In the citing paper
“In practical scenarios, training a network using one deepfake algorithm and evaluating its performance on deepfakes created by a different algorithm is common.”
From Deepfake forensics: a survey of digital forensic methods for multimodal deepfake identification on social media (2024) · cites this paper as Jevnisek & Avidan (2022)
Self-check
Percentages, sums and reported differences re-computed from the paper’s own numbers.
The self-check needs the paper’s full text.
Citations
Cites
Deepfakes and beyond: A Survey of face manipulation and fake detection
Tolosana, R., Vera-Rodriguez, R., Fierrez, J., Morales, A., & Ortega-Garcia, J. (2020) · Information Fusion · doi:10.1016/j.inffus.2020.06.014 · Cited by 1,237
Deep Fakes: A Looming Challenge for Privacy, Democracy, and National Security
Chesney, R., & Citron, D. K. (2018) · SSRN Electronic Journal · doi:10.2139/ssrn.3213954 · Cited by 880 · cited 1×
“While this is an example of an entertaining use of facial manipulations, the use of this technology might pose threats to privacy, democracy and national security [8].”
BackgroundOC-FakeDect: Classifying Deepfakes Using One-class Variational Autoencoder
Khalid, H., & Woo, S. S. (2020) · 2020 IEEE/CVF Conference on Computer Vision and Pattern Recognition Workshops (CVPRW) · doi:10.1109/cvprw50498.2020.00336 · Cited by 197
Deepfakes Detection with Automatic Face Weighting
Montserrat, D. M., Hao, H., Yarlagadda, S. K., Baireddy, S., Shao, R., Horvath, J., Bartusiak, E., Yang, J., Guera, D., Zhu, F., et al. (2020) · 2020 IEEE/CVF Conference on Computer Vision and Pattern Recognition Workshops (CVPRW) · doi:10.1109/cvprw50498.2020.00342 · Cited by 181
Research works printed but not linked: 11
- 10.1109/CVPR46437.2021.00639 · DOI · Paper page
- 10.1109/ICCV.2015.425 · DOI · Paper page
- 10.1109/ICCV.2019.00009 · DOI · Paper page
- 10.1109/CVPR.2018.00255 · DOI
- 10.1007/978-3-030-58574-7_7 · DOI · Paper page
- 10.1109/CVPRW.2017.229 · DOI · Paper page
- chai, 2020, What makes fake images detectable? understanding properties that generalize, European Conference on Computer Vision, 103
- haliassos, 2021, Lips don’t lie: A generalisable and robust approach to face forgery detection, Proceedings of the IEEE/CVF Conference on Computer Vision and Pattern Recognition, 5039
- 10.1109/CVPR.2018.00474 · DOI · Paper page
- 10.1109/CVPR46437.2021.00361 · DOI · Paper page
- 10.1145/3306346.3323035 · DOI
Cited by
Sorted by citations
Qureshi, S. M., Saeed, A., Almotiri, S. H., Ahmad, F., & Al Ghamdi, M. A. (2024) · PeerJ Computer Science · doi:10.7717/peerj-cs.2037 · Cited by 71
Fsbi: Deepfake detection with frequency enhanced self-blended images
Abul Hasanaath, A., Luqman, H., Katib, R., & Anwar, S. (2025) · Image and Vision Computing · doi:10.1016/j.imavis.2025.105418 · Cited by 34
Metadata
- Authors
- Jevnisek, A., & Avidan, S.
- Affiliations
- Tel-Aviv University,School of Electrical Engineering,Tel-Aviv,Israel
- Venue
- 2022 26th International Conference on Pattern Recognition (ICPR)
- Publisher
- IEEE
- Published
- 2022-08-21
- Pages
- 2027-2033
- Cited by
- 5
- References
- 4
About these checks
Registry, retraction, Cites and statistics results are computed, not judged, with one exception: a printed reference that no index lists is read once by a model before it counts as a citation error. Claims are extracted by a model and kept only when their quote appears verbatim in the text; each cited source is then checked, with a model’s help, for whether it says what the claim relies on. Those verdicts can be wrong — read the claim’s quote and the cited source before relying on one.
Statistics and arithmetic are recomputed, not judged.
Confidence bands are shown only for fields calibrated on our annotated test set. None is calibrated yet, so no band is shown.
What counts as a claim ›How we measure confidence ›How we check this ›
Are you an author, or do you see a problem with this page? Request a review
