

The DOI matches its Crossref record; 1 of the 1 references it cites were found in a registry or an index.
Electrical Minigrids for Development: Lessons From the Field
Open accessAbstract
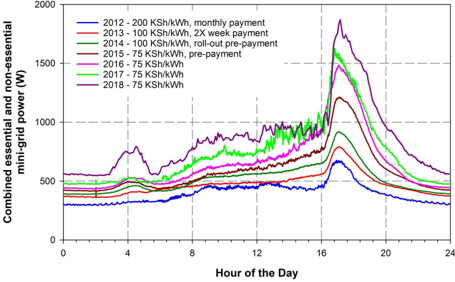
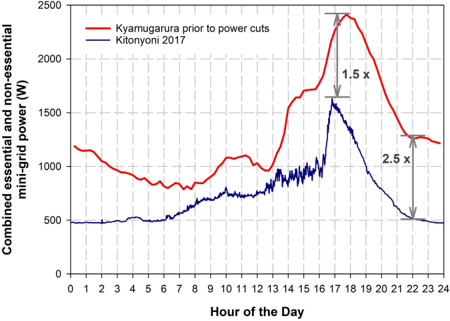
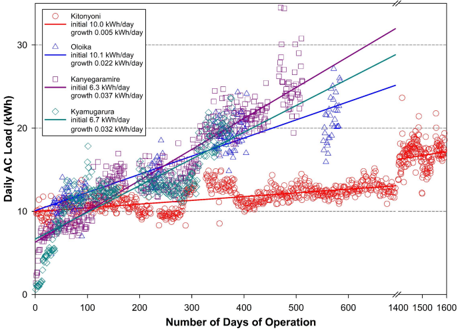
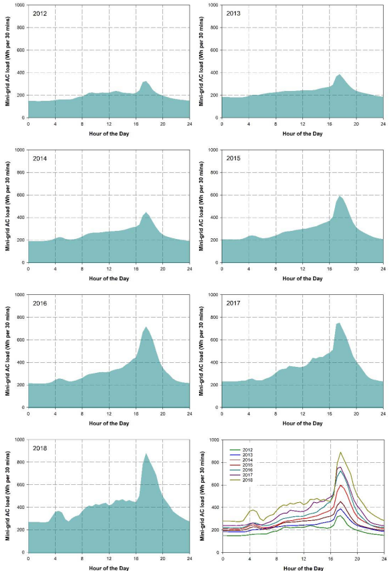
Energy services are crucial to human wellbeing and development, and without reliable energy, it is difficult to escape subsistence lifestyles and poverty. Here, we report on four identical capacity rural minigrid interventions undertaken in Kenya and Uganda with differing socioeconomic characteristics and demographics. The research outcomes presented briefly discuss the preparation stages of the interventions including community surveys that informed the technical design, deployment phases, and setup of the community cooperatives to manage the minigrid projects. The main focus here is on lessons learned, including system design and minigrid performance under various load profiles. The results show a clear and increasing uptake of power by the communities with intensities varying depending on the electricity tariff used. Across the four minigrids, daily electricity growth rates are seen to vary by a factor of 8. The Ugandan minigrids operated at close to utility grid tariff and reached the 28-kWh/day design limit within two years. By contrast, the Kenyan minigrids charged a higher cost recovery tariff, which capped the demand and systems operate below the design limit. These findings have implications not only to system design but also to system stability and longevity. The approach taken here, of community centered cooperatives running the delivered minigrids, is now embedded within the rural electrification authorities/agencies in both countries, with additional similar projects being planned in 2019/2020. The application, ramifications, and replication of such a minigrid concept as compared to other approaches are also discussed in this paper.
Overview
The claims and statistics of this paper haven’t been checked yet.
Run the check — free, no account needed. It reads the open-access text and checks the sources it cites.
Integrity signals
Registry
Cites
Statistics
Figures


Verification
Claims the paper makes
The claims and statistics of this paper haven’t been checked yet.
Run the check — free, no account needed. It reads the open-access text and checks the sources it cites.
Claims other papers make about this one
Each is checked against this paper’s own text: does it say what the citing paper says it does?
The source backs part of the claim, not all of it — or backs it for a different population, condition or comparison.
In the citing paper
“Both countries have moderately established PV markets with a growing trend of mini grid based rural electrification being established (Bahaj and James, 2019).”
From Management of environmental impacts of fossil fuel use in refugee camps through transition to renewable energy infrastructure: Case studies in Uganda and Bangladesh. (2025) · cites this paper as Bahaj and James, 2019
Experimental — accuracy not yet measuredIn the citing paper
“Such system flexibility allows options to support higher power energy access for the target communities such as refugees and remote and dispersed villages (Bahaj and James, 2019; Vernet et al., 2019; Bahaj et al., 2019, 2020).”
From Management of environmental impacts of fossil fuel use in refugee camps through transition to renewable energy infrastructure: Case studies in Uganda and Bangladesh. (2025) · cites this paper as Bahaj and James, 2019
Self-check
Percentages, sums and reported differences re-computed from the paper’s own numbers.
The self-check needs the paper’s full text.
Citations
Cites
Olivares, D. E., Mehrizi-Sani, A., Etemadi, A. H., Canizares, C. A., Iravani, R., Kazerani, M., Hajimiragha, A. H., Gomis-Bellmunt, O., Saeedifard, M., Palma-Behnke, R., et al. (2014) · IEEE Transactions on Smart Grid · doi:10.1109/tsg.2013.2295514 · Cited by 3,137
Research works printed but not linked: 28
- 10.1016/j.deveng.2017.12.001 · DOI
- 2014, Islamic Development Bank and Development Partners Launch US
- 2014, IRENA/ADFD Project Facility
- hansen, 2014, Review of solar PV market development in East Africa
- clairand, 0, Power generation planning of Galapagos’ microgrid considering electric vehicles and induction stoves, IEEE Trans Sustain Energy
- lee, 2016, Barriers to electrification for ‘under grid’ households rural Kenya
- 10.1016/j.deveng.2015.12.001 · DOI
- millien, 2017, Electricity supply reliability and households decision to connect to the grid, Documents de travail du Centre d’Economie de la Sorbonne
- 2018, UK Power Networks
- 2018, Energy for Development Network
- 10.1016/j.jenvman.2006.03.014 · DOI
- 10.1088/1748-9326/6/3/034002 · DOI
- 10.1016/j.enpol.2018.11.012 · DOI · Paper page
- 2018, Sustainable Energy for All (SE4ALL) Database Access to Electricity Rural (% of Rural Population)
- 2018, Fortis Unum Clustering Mini-Grid Networks to Widen Energy Access and Enhance Utility Network Resilience
- 10.1016/j.esd.2017.09.012 · DOI
- 10.19088/1968-2017.161 · DOI
- 2017, Upscaling Mini Grids for Low Cost and Timely Access to Electricity (English) Energy Sector Management Assistance Program (ESMAP)
- 2017, A/RES/71/313 Work of the Statistical Commission Pertaining to the 2030 Agenda for Sustainable Development
- 2015, Green Mini-Grids Market Development Program SEforALL Africa Hub African Development Bank
- 2018, World Energy Outlook 2017 Executive Summary
- 10.1016/j.enpol.2012.03.031 · DOI
- 10.3390/en12050778 · DOI
- 10.1016/j.enpol.2016.04.010 · DOI
- 2018, HOMER Pro Version History Legacy Version 2 68
- bahaj, 2015, Transforming rural communities through mini-grids, Smart Villages New thinking for off-grid communities worldwide, 29
- 2018, Clarke Construction Essex Limited
- 2018, Jane Wernick Associates
Cited by
Sorted by citations
Bahaj, A. S., Alam, M., & Blunden, L. S. (2025) · Journal of Environmental Management · doi:10.1016/j.jenvman.2025.124039 · Cited by 11
Self-citation
Metadata
- Authors
- Bahaj, A. S., & James, P. A. B.
- Affiliations
- University of Southampton (GB)
- Venue
- Proceedings of the IEEE
- Published
- 2019-09
- Volume
- 107
- Issue
- 9
- Pages
- 1967-1980
- ISSN
- 0018-9219 (ISSN-L)
- 1558-2256
- OpenAlex
- W2966665436
- Cited by
- 35
- References
- 1
- Citations by year
- 2026: 5 · 2025: 7 · 2024: 5 · 2023: 5 · 2022: 5 · 2021: 2 · 2020: 4 · 2019: 2
- FWCI
- 0.95
- Type
- journal article
- Language
- en
- Open access
- hybrid
- doi.org
- Locations
- Proceedings of the IEEE (publishedVersion, cc-by)
- ePrints Soton (University of Southampton) (acceptedVersion)
- Funders
- Engineering and Physical Sciences Research Council (EP/G06394X/1)
- Topics
- Physical Sciences › Environmental Science › Pollution › Energy and Environment Impacts
- Physical Sciences › Engineering › Control and Systems Engineering › Microgrid Control and Optimization
- Physical Sciences › Computer Science › Information Systems › ICT in Developing Communities
- Keywords
- rural electrification, community cooperatives, electricity tariffs, cost recovery, electricity profile, system stability, Kenya, Uganda, lessons learned
About these checks
Registry, retraction, Cites and statistics results are computed, not judged, with one exception: a printed reference that no index lists is read once by a model before it counts as a citation error. Claims are extracted by a model and kept only when their quote appears verbatim in the text; each cited source is then checked, with a model’s help, for whether it says what the claim relies on. Those verdicts can be wrong — read the claim’s quote and the cited source before relying on one.
Statistics and arithmetic are recomputed, not judged.
Confidence bands are shown only for fields calibrated on our annotated test set. None is calibrated yet, so no band is shown.
What counts as a claim ›How we measure confidence ›How we check this ›
Are you an author, or do you see a problem with this page? Request a review
How to cite
Cite CoChat for the checks on this page, and the paper for its own findings.
- This page
- CoChat. (2026). Citation check: Electrical Minigrids for Development: Lessons From the Field. https://app.cochat.ai/papers/10.1109/jproc.2019.2924594
- The paper
- Bahaj, A. S., & James, P. A. B. (2019). Electrical Minigrids for Development: Lessons From the Field. Proceedings of the IEEE. https://doi.org/10.1109/jproc.2019.2924594
