

The DOI matches its Crossref record; 2 of the 2 references it cites were found in a registry or an index.
Communicating Patient Health Data: A Wicked Problem
Open accessAbstract
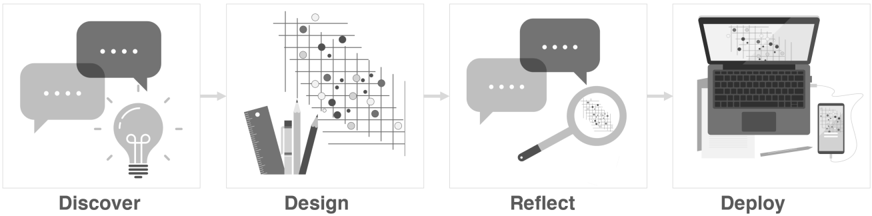
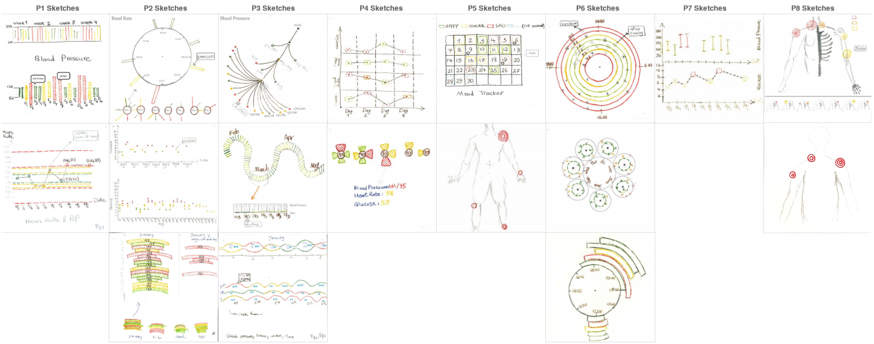
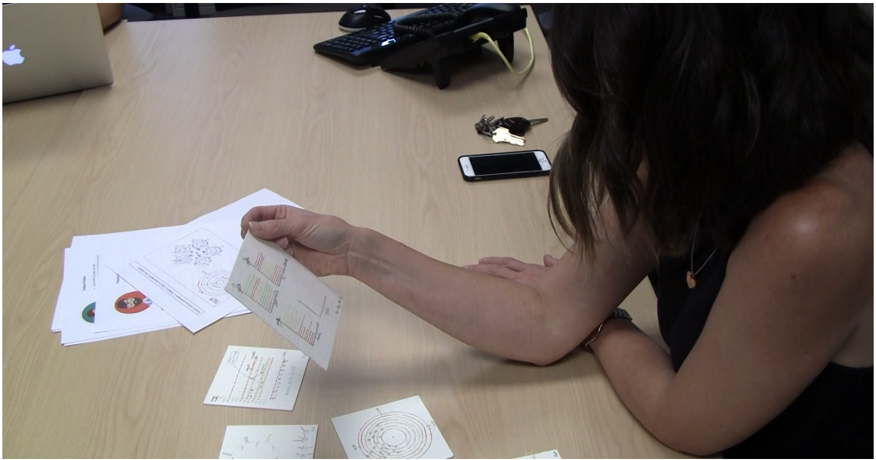
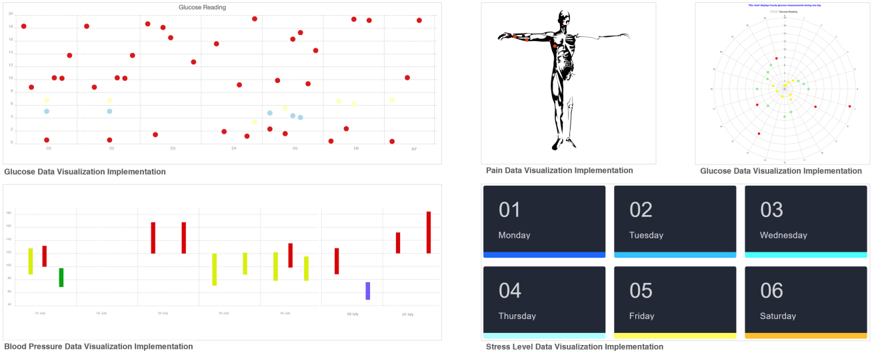
Designing patient-collected health data visualizations to support communicating patient data during clinical visits is a challenging problem due to the heterogeneity of the parties involved: patients, healthcare providers, and healthcare systems. Designers must ensure that all parties' needs are met. This complexity makes it challenging to find a definitive solution that can work for every individual. We have approached this research problem-communicating patient data during clinical visits-as a wicked problem. In this article, we outline how wicked problem characteristics apply to our research problem. We then describe the research methodologies we employed to explore the design space of individualized patient data visualization solutions. Lastly, we reflect on the insights and experiences we gained through this exploratory design process. We conclude with a call to action for researchers and visualization designers to consider patients' and healthcare providers' individualities when designing patient data visualizations.
Overview
The claims and statistics of this paper haven’t been checked yet.
Run the check — free, no account needed. It reads the open-access text and checks the sources it cites.
Integrity signals
Registry
Cites
Statistics
Figures
Verification
Claims the paper makes
The claims and statistics of this paper haven’t been checked yet.
Run the check — free, no account needed. It reads the open-access text and checks the sources it cites.
Claims other papers make about this one
Each is checked against this paper’s own text: does it say what the citing paper says it does?
In the citing paper
“However, patients and healthcare providers face difficulties communicating the progress due to the complexity of the recovery progress data collected over weeks or months and the data being scattered at various locations of Electronic Medical Record (EMR) [44, 51].”
From A Data Visualization Tool for Patients and Healthcare Providers to Communicate during Inpatient Stroke Rehabilitation (2024) · cites this paper as [51]
In the citing paper
“However, we faced challenges recruiting healthcare providers due to their demanding schedules and potential skepticism regarding the value of new technology research [51]. Additionally, in our city, we have only one inpatient stroke unit with just 10-12 active healthcare providers responsible for stroke rehabilitation care.”
From A Data Visualization Tool for Patients and Healthcare Providers to Communicate during Inpatient Stroke Rehabilitation (2024) · cites this paper as [51]
In the citing paper
“The literature also mentions that finding healthcare providers willing to give interview time is a challenge, as they often have busy schedules, or they may be skeptical of the value of new technology research [51].”
From A Data Visualization Tool for Patients and Healthcare Providers to Communicate during Inpatient Stroke Rehabilitation (2024) · cites this paper as [51]
Self-check
Percentages, sums and reported differences re-computed from the paper’s own numbers.
The self-check needs the paper’s full text.
Citations
Cites
Dilemmas in a general theory of planning
Rittel, H. W. J., & Webber, M. M. (1973) · Policy Sciences · doi:10.1007/bf01405730 · Cited by 16,338
The Clinical Application of the Biopsychosocial Model
Engel, G. L. (1981) · Journal of Medicine and Philosophy · doi:10.1093/jmp/6.2.101 · Cited by 531
Research works printed but not linked: 8
- 10.1056/NEJMp1109283 · DOI · Paper page
- roberts, 2000, Wicked problems and network approaches to resolution, International Public Management Review, 1, 1
- 10.1109/INFVIS.1997.636792 · DOI
- 10.20380/GI2020.36 · DOI
- 10.1145/3154862.3154885 · DOI · Paper page
- 10.1145/3289425 · DOI
- 10.1016/B978-0-08-051574-8.50019-4 · DOI
- 10.1007/978-3-030-58721-5_19 · DOI
Cited by
Sorted by citations
Ramesh, S. H., Ouskine, A., Khorasani, E., Ebrahimipour, M., Finestone, H., Chan, A. D. C., & Rajabiyazdi, F. (2024) · Graphics Interface · doi:10.1145/3670947.3670978 · Cited by 7
Self-citation
Metadata
- Authors
- Rajabiyazdi, F., Perin, C., Oehlberg, L., & Carpendale, S.
- Affiliations
- Carleton University (CA)
- University of Victoria, Victoria, BC, Canada
- University of Calgary (CA)
- Simon Fraser University (CA)
- Venue
- IEEE Computer Graphics and Applications
- Published
- 2021-11-01
- Volume
- 41
- Issue
- 6
- Pages
- 179-186
- ISSN
- 0272-1716 (ISSN-L)
- 1558-1756
- OpenAlex
- W3207535187
- Cited by
- 13
- References
- 2
- Citations by year
- 2026: 3 · 2025: 4 · 2024: 1 · 2023: 2 · 2022: 3
- FWCI
- 0.54
- Type
- journal article
- Language
- en
- Open access
- green
- arxiv.org
- Licence
- Locations
- IEEE Computer Graphics and Applications (publishedVersion)
- PubMed (publishedVersion)
- arXiv (Cornell University) (submittedVersion, cc-by)
- arXiv (Cornell University) (submittedVersion)
- arXiv (Cornell University) (cc-by)
- Funders
- Alberta Innovates - Technology Futures
- Natural Sciences and Engineering Research Council of Canada
- Topics
- Physical Sciences › Computer Science › Computer Graphics and Computer-Aided Design › Data Visualization and Analytics
- Health Sciences › Health Professions › Health Information Management › Electronic Health Records Systems
- Physical Sciences › Computer Science › Human-Computer Interaction › Innovative Human-Technology Interaction
- Keywords
- health data visualization, clinical communication, wicked problems, patient-provider communication, individualized design, design space exploration, patient-centered design, health information systems
- MeSH terms
- Data Visualization, Delivery of Health Care, Health Personnel, Humans
About these checks
Registry, retraction, Cites and statistics results are computed, not judged, with one exception: a printed reference that no index lists is read once by a model before it counts as a citation error. Claims are extracted by a model and kept only when their quote appears verbatim in the text; each cited source is then checked, with a model’s help, for whether it says what the claim relies on. Those verdicts can be wrong — read the claim’s quote and the cited source before relying on one.
Statistics and arithmetic are recomputed, not judged.
Confidence bands are shown only for fields calibrated on our annotated test set. None is calibrated yet, so no band is shown.
What counts as a claim ›How we measure confidence ›How we check this ›
Are you an author, or do you see a problem with this page? Request a review
