

The DOI matches its Crossref record; 28 of the 28 references it cites were found in a registry or an index; 1 of the 21 sources its claims cite were checked for support.
Estimating the Total Volume of Queries to a Search Engine
Open accessAbstract
We study the problem of estimating the total number of searches (volume) of queries in a specific domain, which were submitted to a search engine in a given time period. Our statistical model assumes that the distribution of searches follows a Zipf’s law, and that the observed sample volumes are biased accordingly to three possible scenarios. These assumptions are consistent with empirical data, with keyword research practices, and with approximate algorithms used to take counts of query frequencies. A few estimators of the parameters of the distribution are devised and experimented, based on the nature of the empirical/simulated data. For continuous data, we recommend using nonlinear least square regression (NLS) on the top-volume queries, where the bound on the volume is obtained from the well-known Clauset, Shalizi and Newman (CSN) estimation of power-law parameters. For binned data, we propose using a Chi-square minimization approach restricted to the top-volume queries, where the bound is obtained by the binned version of the CSN method. Estimations are then derived for the total number of queries and for the total volume of the population, including statistical error bounds. We apply the methods on the domain ofrecipes and cookingqueries searched in Italian in 2017. The observed volumes of sample queries are collected from Google Trends (continuous data) and SearchVolume (binned data). The estimated total number of queries and total volume are computed for the two cases, and the results are compared and discussed.
Overview
AI snapshot
Written from the paper’s full text.
TL;DR
The paper proposes Zipf-law-based estimators for the total number and total volume of queries in a search-engine domain from biased SEO-tool samples, with separate methods for continuous and binned data. Applied to Italian recipe/cooking queries in 2017, it estimates totals from Google Trends and SearchVolume and compares the two.
Key findings
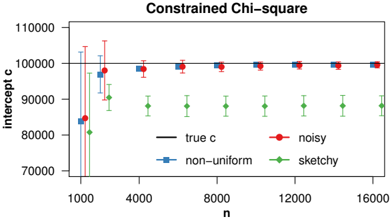
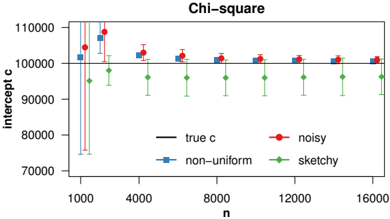
- Simulations favor nonlinear least squares (NLS) regression for continuous data and Chi-square minimization for binned data; NLS converges for non-uniform and noisy sampling, while sketchy sampling causes overestimation of total volume.
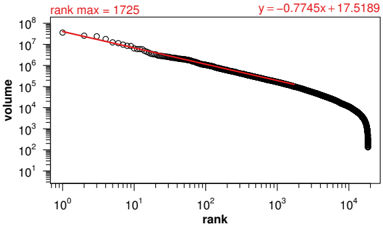
- For Google Trends continuous data, the paper estimates β = 0.7745 and ĉ = e^17.5189 = 40,584,860, with Δβ = 0.0025 and Δc = 199,263; the NLS fit uses the top max = 1725 queries determined by the CSN method.
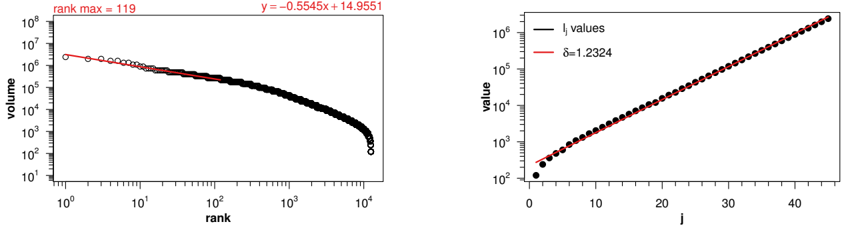
- For SearchVolume binned data, it estimates β = 0.5545 and ĉ = e^14.9551 = 3,125,485, with Δβ = 0.0352 and Δc = 549,134; the Chi-square fit uses the top max = 119 queries determined by Binned-CSN.
- Table 1 reports, for at least 12 searches/year (monthly average 1), Google Trends Nv = 269,214,520 ± 18,507,467 and Vv = 14,169.58M ± 827.91M, versus SearchVolume Nv = 5,849,311,206 ± 10,205,374,040 and Vv = 157,547.70M ± 262,434.70M; the smaller SearchVolume β implies a larger long tail, with 5.85B queries searched at least once a month versus about 270M for Google Trends.
Methods
- The model assumes the population rank-volume distribution follows Zipf’s law and models observed-volume bias through non-uniform sampling, noisy sampling, and sketchy sampling; simulations use N = 10^6, c = 10^5, β = 0.7745, n = 1000, p = 0.001, γ = 0.001, and bin ratio δ = 1.2324.
- Continuous estimation uses CSN for β and NLS regression for c and β on top-volume queries; binned estimation uses Binned-CSN for β and Chi-square minimization for c and β, with a constrained Chi-square variant and a sketchy-optimized restriction to volumes ≥ 10γv1.
- Empirical data consist of 120K distinct Italian recipe/cooking queries crawled from 18 popular websites and validated by humans; observed volumes for 2017 were collected from Google Trends (about 18.5K queries) and SearchVolume (about 12.5K queries), then used to estimate Nv and Vv with error propagation.
Limitations
- The paper states that the approach depends on the population being Zipfian and the domain being coherent; it also states that sample construction must include top-volume queries, that the SEO-tool bias scenario is unknown, and that Google Trends has an additional scaling bias from relative to absolute volumes.
- The paper notes that SearchVolume returned no result for about 6K queries, including 26 of the top 100 Google Trends observed-volume queries, and that correlation between SearchVolume and Google Trends volumes is weak (Kendall’s τ = 0.3717); binned data also produce larger statistical errors than continuous data.
- Evident from the text: empirical validation is limited to one domain, language, and year, with no ground-truth total volume; simulation conclusions depend on assumed parameters, and the sketchy-optimized method requires knowing γ.
Model-written summary. Check it against the paper before relying on it.
Integrity signals
Registry
Cites
Statistics
Figures


Verification
Claims the paper makes
75 Own result · 54 Own interpretation · 9 Not checked yet · 6 No basis given · 3 No full text of the sources · 2 Check pending · 2 Own method · 1 Partly supported · accuracy not yet measured
The cited sources support only part of this claim — read each source’s verdict below.
In the paper
“OLS regression performs worse than NLS (simulations not shown, see also [12]) since it gives too much importance to deviations of low rank with respect to high rank queries.”
§ IEEE TRANSACTIONS ON KNOWLEDGE AND DATA ENGINEERING 1 Estimating the Total Volume of Queries to a Search Engine > Power law of volume distribution,
What the sources say
- Partly supportedcites [12] sourceExperimental — accuracy not yet measured
Section 2 reports that least-squares linear fitting of a log-log power-law plot can be biased and that the transformation distorts errors in the tail unevenly. But the paper compares linear fitting with maximum likelihood estimation (MLE), not NLS, and does not make the claim about weighting deviations of low-rank versus high-rank queries. The Conclusions likewise favor MLE over linear-fit methods; no page numbers are available in our copy. (LLM, conf=0.85)
plainstates a cause- Asserted: passes — The authors put it forward as true.
- Checkable: passes — It can be checked against evidence.
- Load-bearing: unclear — It is unclear whether the paper’s conclusions depend on it.
- Based: passes — The paper gives a reason why it holds.
- Partly supported
A result the paper states — it cites no source for it, so there is none to check. The quote shows it is in the paper.
In the paper
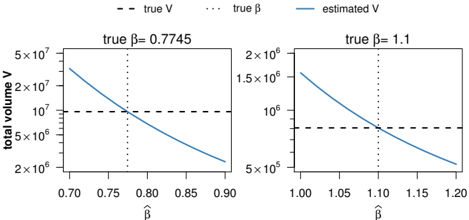
“For β's lower than 1, error (or variability) of the estimator β has a greater impact on error (or variability) of V than for β's greater than 1.”
§ IEEE TRANSACTIONS ON KNOWLEDGE AND DATA ENGINEERING 1 Estimating the Total Volume of Queries to a Search Engine > 5.3 Estimating V
plainstates a cause- Asserted: passes — The authors put it forward as true.
- Checkable: passes — It can be checked against evidence.
- Load-bearing: passes — The paper’s conclusions depend on it.
- Based: passes — The paper gives a reason why it holds.
A result the paper states — it cites no source for it, so there is none to check. The quote shows it is in the paper.
In the paper
“Unfortunately, the maximal observed volume v 1 in the sample provides a very biased estimation of c for binned data.”
§ IEEE TRANSACTIONS ON KNOWLEDGE AND DATA ENGINEERING 1 Estimating the Total Volume of Queries to a Search Engine > 6.3 Constrained Chi-square Minimization
plainstates a cause- Asserted: passes — The authors put it forward as true.
- Checkable: passes — It can be checked against evidence.
- Load-bearing: passes — The paper’s conclusions depend on it.
- Based: passes — The paper gives a reason why it holds.
A result the paper reports from its own data — it cites no other source for it, so there is none to check. The quote shows it is in the paper.
In the paper
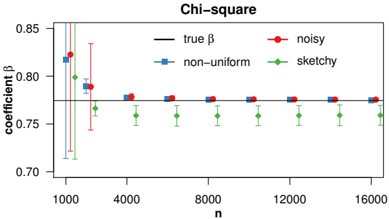
“In fact, while it shows a slightly larger variance, it has a significantly smaller bias, summing up to an overall smaller mean square error.”
§ IEEE TRANSACTIONS ON KNOWLEDGE AND DATA ENGINEERING 1 Estimating the Total Volume of Queries to a Search Engine > 6.2 Chi-square Minimization
plain- Asserted: passes — The authors put it forward as true.
- Checkable: passes — It can be checked against evidence.
- Load-bearing: passes — The paper’s conclusions depend on it.
- Based: passes — The paper gives a reason why it holds.
A result the paper reports from its own data — it cites no other source for it, so there is none to check. The quote shows it is in the paper.
In the paper
“In fact, while it shows a slightly larger variance, it has a significantly smaller bias, summing up to an overall smaller mean square error.”
§ IEEE TRANSACTIONS ON KNOWLEDGE AND DATA ENGINEERING 1 Estimating the Total Volume of Queries to a Search Engine > 6.2 Chi-square Minimization
plain- Asserted: passes — The authors put it forward as true.
- Checkable: passes — It can be checked against evidence.
- Load-bearing: passes — The paper’s conclusions depend on it.
- Based: passes — The paper gives a reason why it holds.
A result the paper reports from its own data — it cites no other source for it, so there is none to check. The quote shows it is in the paper.
In the paper
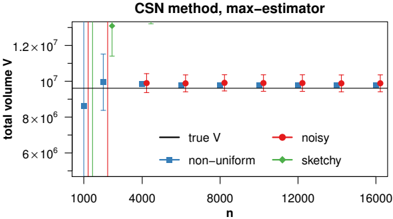
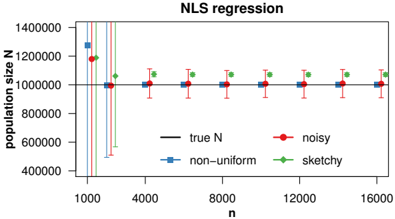
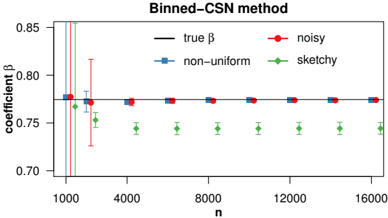
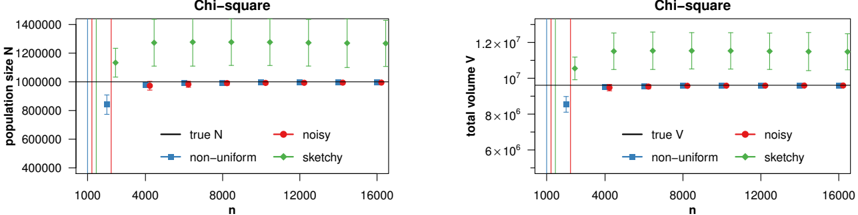
“The first method is biased, showing a slight overestimation for non-uniform and noisy sampling and a large overestimation for sketchy sampling (not shown because exceeding the y-axis limits).”
§ IEEE TRANSACTIONS ON KNOWLEDGE AND DATA ENGINEERING 1 Estimating the Total Volume of Queries to a Search Engine > 5.2 Estimating N
plainstates a cause- Asserted: passes — The authors put it forward as true.
- Checkable: passes — It can be checked against evidence.
- Load-bearing: passes — The paper’s conclusions depend on it.
- Based: passes — The paper gives a reason why it holds.
- The authors state this as an assumption: The distribution of searches follows a Zipf's law.
- The authors state this as an assumption: The sample of observed volumes is not uniform, but depends on the rank of queries over the population (non-uniform sampling).
- The authors state this as an assumption: The sampling probability decays exponentially with rank (geometric sampling).
A result the paper reports from its own data — it cites no other source for it, so there is none to check. The quote shows it is in the paper.
In the paper
“We have experimented this modified procedure for both Binned-CSN and Chi-square methods.The latter continues to perform slightly better even in such setting.”
§ IEEE TRANSACTIONS ON KNOWLEDGE AND DATA ENGINEERING 1 Estimating the Total Volume of Queries to a Search Engine > Google Trends SearchVolume v v/12
plain- Asserted: passes — The authors put it forward as true.
- Checkable: passes — It can be checked against evidence.
- Load-bearing: unclear — It is unclear whether the paper’s conclusions depend on it.
- Based: passes — The paper gives a reason why it holds.
A result the paper reports from its own data — it cites no other source for it, so there is none to check. The quote shows it is in the paper.
In the paper
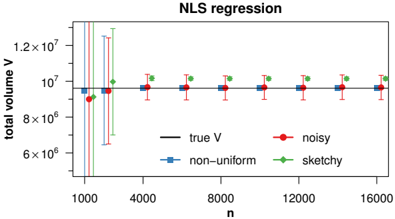
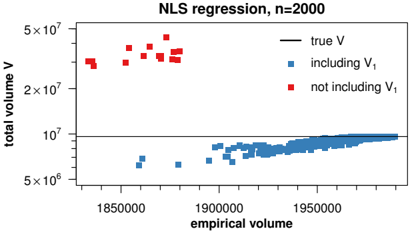
“If the empirical volume is sufficiently large, the estimated total volume converges to the true volume.”
§ IEEE TRANSACTIONS ON KNOWLEDGE AND DATA ENGINEERING 1 Estimating the Total Volume of Queries to a Search Engine > 5.3 Estimating V
plainstates a cause- Asserted: passes — The authors put it forward as true.
- Checkable: passes — It can be checked against evidence.
- Load-bearing: passes — The paper’s conclusions depend on it.
- Based: passes — The paper gives a reason why it holds.
A result the paper states — it cites no source for it, so there is none to check. The quote shows it is in the paper.
In the paper
“However, for binned data the difference is not so neat.”
§ IEEE TRANSACTIONS ON KNOWLEDGE AND DATA ENGINEERING 1 Estimating the Total Volume of Queries to a Search Engine > 6.4 Overall approach
plain- Asserted: passes — The authors put it forward as true.
- Checkable: passes — It can be checked against evidence.
- Load-bearing: unclear — It is unclear whether the paper’s conclusions depend on it.
- Based: passes — The paper gives a reason why it holds.
A result the paper reports from its own data — it cites no other source for it, so there is none to check. The quote shows it is in the paper.
In the paper
“Let us now focus on smaller sample sizes, for which instead there is a large standard deviation over the experimental runs.”
§ IEEE TRANSACTIONS ON KNOWLEDGE AND DATA ENGINEERING 1 Estimating the Total Volume of Queries to a Search Engine > 5.3 Estimating V
plainstates an association- Asserted: passes — The authors put it forward as true.
- Checkable: passes — It can be checked against evidence.
- Load-bearing: unclear — It is unclear whether the paper’s conclusions depend on it.
- Based: passes — The paper gives a reason why it holds.
- It may state two separate claims as one. 30
- The quote only partly states this claim. 2
- Probably not a substantial claim. 27
A result the paper reports from its own data — it cites no other source for it, so there is none to check. The quote shows it is in the paper.
In the paper
“We submitted to SearchVolume the 18.5K queries for which Google Trends provided observed volumes, and obtained (binned) observed volumes for about 12.5K of them.”
§ IEEE TRANSACTIONS ON KNOWLEDGE AND DATA ENGINEERING 1 Estimating the Total Volume of Queries to a Search Engine > 7.2 SearchVolume (binned data)
plain- Asserted: passes — The authors put it forward as true.
- Checkable: passes — It can be checked against evidence.
- Load-bearing: passes — The paper’s conclusions depend on it.
- Based: passes — The paper gives a reason why it holds.
It may state two separate claims as one.
A result the paper states — it cites no source for it, so there is none to check. The quote shows it is in the paper.
In the paper
“Third, Google Trends data has a larger empirical variance than SearchVolume: top volume are up to 65 standard deviations from the mean volume for Google Trends and up to 38 for SearchVolume.”
§ IEEE TRANSACTIONS ON KNOWLEDGE AND DATA ENGINEERING 1 Estimating the Total Volume of Queries to a Search Engine > 7.2 SearchVolume (binned data)
plainstates an association- Asserted: passes — The authors put it forward as true.
- Checkable: passes — It can be checked against evidence.
- Load-bearing: passes — The paper’s conclusions depend on it.
- Based: passes — The paper gives a reason why it holds.
It may state two separate claims as one.
A result the paper reports from its own data — it cites no other source for it, so there is none to check. The quote shows it is in the paper.
In the paper
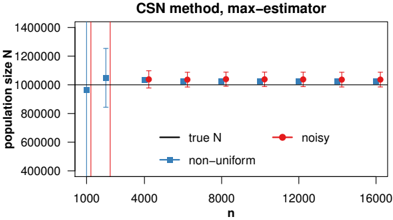
“The second method converges to the true value of N for non-uniform and noisy sampling (on average), and it slightly overestimates it for sketchy sampling.”
§ IEEE TRANSACTIONS ON KNOWLEDGE AND DATA ENGINEERING 1 Estimating the Total Volume of Queries to a Search Engine > 5.2 Estimating N
plainstates a cause- Asserted: passes — The authors put it forward as true.
- Checkable: passes — It can be checked against evidence.
- Load-bearing: passes — The paper’s conclusions depend on it.
- Based: passes — The paper gives a reason why it holds.
It may state two separate claims as one.
- The authors state this as an assumption: The distribution of searches follows a Zipf's law.
- The authors state this as an assumption: The sample of observed volumes is not uniform, but depends on the rank of queries over the population (non-uniform sampling).
- The authors state this as an assumption: The sampling probability decays exponentially with rank (geometric sampling).
A result the paper states — it cites no source for it, so there is none to check. The quote shows it is in the paper.
In the paper
“For sketchy sampling, the overestimation is very large: it is out of the bounds of the plot.”
§ IEEE TRANSACTIONS ON KNOWLEDGE AND DATA ENGINEERING 1 Estimating the Total Volume of Queries to a Search Engine > 5.3 Estimating V
plain- Asserted: passes — The authors put it forward as true.
- Checkable: passes — It can be checked against evidence.
- Load-bearing: unclear — It is unclear whether the paper’s conclusions depend on it.
- Based: passes — The paper gives a reason why it holds.
The quote only partly states this claim.
A result the paper reports from its own data — it cites no other source for it, so there is none to check. The quote shows it is in the paper.
In the paper
“δ = 1.2324 (13 ) is the ratio used by SearchVolume, as shown in Figure 9 (right).”
§ IEEE TRANSACTIONS ON KNOWLEDGE AND DATA ENGINEERING 1 Estimating the Total Volume of Queries to a Search Engine > 6 THE CASE OF BINNED DATA
plain- Asserted: passes — The authors put it forward as true.
- Checkable: passes — It can be checked against evidence.
- Load-bearing: fails — The paper’s conclusions may not depend on it.
- Based: passes — The paper gives a reason why it holds.
Probably not a substantial claim. The paper’s conclusions may not depend on it.
- Rests on an assumption: Most SEO tools do not provide an absolute observed volume of a query, but rather provide an interval estimate of the volume (binned observed volumes).
A result the paper reports from its own data — it cites no other source for it, so there is none to check. The quote shows it is in the paper.
In the paper
“∆β = 0.0025 ∆c = 199, 263(16)”
§ IEEE TRANSACTIONS ON KNOWLEDGE AND DATA ENGINEERING 1 Estimating the Total Volume of Queries to a Search Engine > 7.1 Google Trends (continuous data)
plain- Asserted: passes — The authors put it forward as true.
- Checkable: passes — It can be checked against evidence.
- Load-bearing: unclear — It is unclear whether the paper’s conclusions depend on it.
- Based: passes — The paper gives a reason why it holds.
It may state two separate claims as one.
- The authors state this as an assumption: The unobserved rank distribution of query volumes in the reference population follows a Zipf's law.
A result the paper reports from its own data — it cites no other source for it, so there is none to check. The quote shows it is in the paper.
In the paper
“Contrasted to Figure 13 (right), the estimations in the sketchy sampling schema are less biased and with smaller variances.”
§ IEEE TRANSACTIONS ON KNOWLEDGE AND DATA ENGINEERING 1 Estimating the Total Volume of Queries to a Search Engine > Google Trends SearchVolume v v/12
plain- Asserted: passes — The authors put it forward as true.
- Checkable: passes — It can be checked against evidence.
- Load-bearing: passes — The paper’s conclusions depend on it.
- Based: passes — The paper gives a reason why it holds.
It may state two separate claims as one.
A result the paper reports from its own data — it cites no other source for it, so there is none to check. The quote shows it is in the paper.
In the paper
“Figure 5 (right) shows that V converges to V for non-uniform and noisy sampling, and overestimates it for sketchy sampling.”
§ IEEE TRANSACTIONS ON KNOWLEDGE AND DATA ENGINEERING 1 Estimating the Total Volume of Queries to a Search Engine > 5.3 Estimating V
plainstates a cause- Asserted: passes — The authors put it forward as true.
- Checkable: passes — It can be checked against evidence.
- Load-bearing: passes — The paper’s conclusions depend on it.
- Based: passes — The paper gives a reason why it holds.
It may state two separate claims as one.
- The authors state this as an assumption: The distribution of searches follows a Zipf's law.
- The authors state this as an assumption: The sample of observed volumes is not uniform, but depends on the rank of queries over the population (non-uniform sampling).
- The authors state this as an assumption: The sampling probability decays exponentially with rank (geometric sampling).
A result the paper reports from its own data — it cites no other source for it, so there is none to check. The quote shows it is in the paper.
In the paper
“The estimated values are: β = 0.5545 ĉ = e 14.9551 = 3, 125, 485.”
§ IEEE TRANSACTIONS ON KNOWLEDGE AND DATA ENGINEERING 1 Estimating the Total Volume of Queries to a Search Engine > 7.2 SearchVolume (binned data)
hedged- Asserted: passes — The authors put it forward as true.
- Checkable: passes — It can be checked against evidence.
- Load-bearing: passes — The paper’s conclusions depend on it.
- Based: passes — The paper gives a reason why it holds.
It may state two separate claims as one.
- The authors state this as an assumption: The unobserved rank distribution of query volumes in the reference population follows a Zipf's law.
A result the paper states — it cites no source for it, so there is none to check. The quote shows it is in the paper.
In the paper
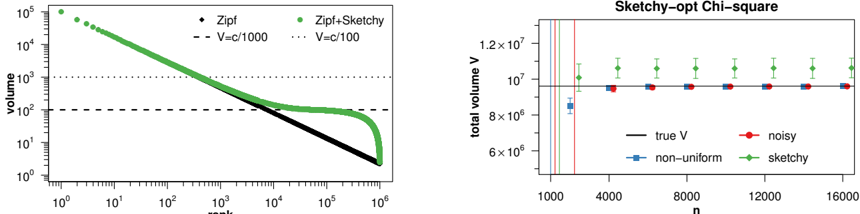
“It turns out that the Sketchy-optimized method of Section 6.5 provided exactly the same results.”
§ IEEE TRANSACTIONS ON KNOWLEDGE AND DATA ENGINEERING 1 Estimating the Total Volume of Queries to a Search Engine > 7.2 SearchVolume (binned data)
plainSingle case- Asserted: passes — The authors put it forward as true.
- Checkable: passes — It can be checked against evidence.
- Load-bearing: fails — The paper’s conclusions may not depend on it.
- Based: passes — The paper gives a reason why it holds.
Probably not a substantial claim. The paper’s conclusions may not depend on it.
- The authors state this as an assumption: The unobserved rank distribution of query volumes in the reference population follows a Zipf's law.
A result the paper states — it cites no source for it, so there is none to check. The quote shows it is in the paper.
In the paper
“Regarding sketchy sampling, instead, the estimator is biased and with non-negligible variance.”
§ IEEE TRANSACTIONS ON KNOWLEDGE AND DATA ENGINEERING 1 Estimating the Total Volume of Queries to a Search Engine > 6.4 Overall approach
plain- Asserted: passes — The authors put it forward as true.
- Checkable: passes — It can be checked against evidence.
- Load-bearing: unclear — It is unclear whether the paper’s conclusions depend on it.
- Based: passes — The paper gives a reason why it holds.
It may state two separate claims as one.
A result the paper reports from its own data — it cites no other source for it, so there is none to check. The quote shows it is in the paper.
In the paper
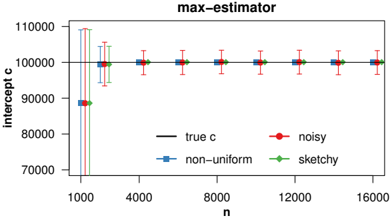
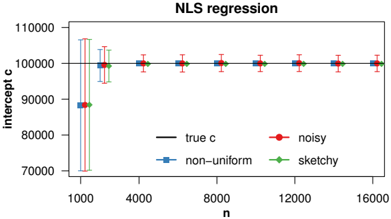
“Figure 3 shows that both the max-estimator and the NLS regression converge to the true value of the intercept c.”
§ IEEE TRANSACTIONS ON KNOWLEDGE AND DATA ENGINEERING 1 Estimating the Total Volume of Queries to a Search Engine > Power law of volume distribution,
plainstates an association- Asserted: passes — The authors put it forward as true.
- Checkable: passes — It can be checked against evidence.
- Load-bearing: unclear — It is unclear whether the paper’s conclusions depend on it.
- Based: passes — The paper gives a reason why it holds.
It may state two separate claims as one.
- The authors state this as an assumption: The distribution of searches follows a Zipf's law.
- The authors state this as an assumption: The sample of observed volumes is not uniform, but depends on the rank of queries over the population (non-uniform sampling).
- The authors state this as an assumption: The sampling probability decays exponentially with rank (geometric sampling).
A result the paper reports from its own data — it cites no other source for it, so there is none to check. The quote shows it is in the paper.
In the paper
“First, SearchVolume returned no result for about 6K queries, which are not necessarily low volume ones according to Google Trends.”
§ IEEE TRANSACTIONS ON KNOWLEDGE AND DATA ENGINEERING 1 Estimating the Total Volume of Queries to a Search Engine > 7.2 SearchVolume (binned data)
plain- Asserted: passes — The authors put it forward as true.
- Checkable: passes — It can be checked against evidence.
- Load-bearing: unclear — It is unclear whether the paper’s conclusions depend on it.
- Based: passes — The paper gives a reason why it holds.
It may state two separate claims as one.
A result the paper reports from its own data — it cites no other source for it, so there is none to check. The quote shows it is in the paper.
In the paper
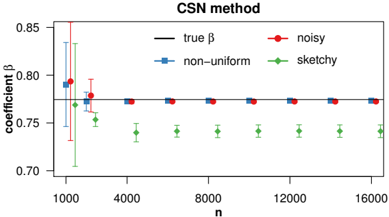
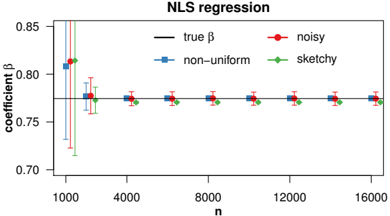
“For sketchy sampling, β is slightly underestimated.”
§ IEEE TRANSACTIONS ON KNOWLEDGE AND DATA ENGINEERING 1 Estimating the Total Volume of Queries to a Search Engine > Power law of volume distribution,
plainstates a cause- Asserted: passes — The authors put it forward as true.
- Checkable: passes — It can be checked against evidence.
- Load-bearing: unclear — It is unclear whether the paper’s conclusions depend on it.
- Based: passes — The paper gives a reason why it holds.
The quote only partly states this claim.
A result the paper states — it cites no source for it, so there is none to check. The quote shows it is in the paper.
In the paper
“There are, in fact, 5.85B queries searched at least once a month for SearchVolume vs only about 270M for Google Trends.”
§ IEEE TRANSACTIONS ON KNOWLEDGE AND DATA ENGINEERING 1 Estimating the Total Volume of Queries to a Search Engine > 7.2 SearchVolume (binned data)
boosted- Asserted: passes — The authors put it forward as true.
- Checkable: passes — It can be checked against evidence.
- Load-bearing: passes — The paper’s conclusions depend on it.
- Based: passes — The paper gives a reason why it holds.
It may state two separate claims as one.
- The authors state this as an assumption: The unobserved rank distribution of query volumes in the reference population follows a Zipf's law.
A result the paper states — it cites no source for it, so there is none to check. The quote shows it is in the paper.
In the paper
“The two methods get closer in estimating the number of queries with at least 1,000 searches per month (23K vs 36K), and in estimating the total volume of queries with at least 100 searches per month (3.9B vs 3.6B).”
§ IEEE TRANSACTIONS ON KNOWLEDGE AND DATA ENGINEERING 1 Estimating the Total Volume of Queries to a Search Engine > 7.2 SearchVolume (binned data)
plain- Asserted: passes — The authors put it forward as true.
- Checkable: passes — It can be checked against evidence.
- Load-bearing: unclear — It is unclear whether the paper’s conclusions depend on it.
- Based: passes — The paper gives a reason why it holds.
It may state two separate claims as one.
- The authors state this as an assumption: The unobserved rank distribution of query volumes in the reference population follows a Zipf's law.
A result the paper reports from its own data — it cites no other source for it, so there is none to check. The quote shows it is in the paper.
In the paper
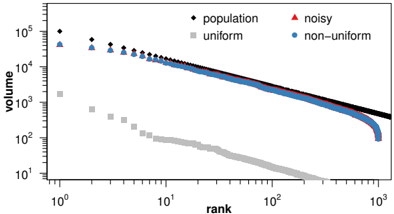
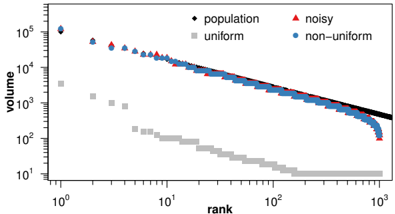
“As for the continuous case, uniform sampling is not consistent with empirical data, while the other strategies are.”
§ IEEE TRANSACTIONS ON KNOWLEDGE AND DATA ENGINEERING 1 Estimating the Total Volume of Queries to a Search Engine > 6 THE CASE OF BINNED DATA
plain- Asserted: passes — The authors put it forward as true.
- Checkable: passes — It can be checked against evidence.
- Load-bearing: passes — The paper’s conclusions depend on it.
- Based: passes — The paper gives a reason why it holds.
It may state two separate claims as one.
A result the paper reports from its own data — it cites no other source for it, so there is none to check. The quote shows it is in the paper.
In the paper
“the NLS regression estimates are: β = 0.7745 ĉ = e 17.5189 = 40, 584, 860.”
§ IEEE TRANSACTIONS ON KNOWLEDGE AND DATA ENGINEERING 1 Estimating the Total Volume of Queries to a Search Engine > 7.1 Google Trends (continuous data)
plain- Asserted: passes — The authors put it forward as true.
- Checkable: passes — It can be checked against evidence.
- Load-bearing: passes — The paper’s conclusions depend on it.
- Based: passes — The paper gives a reason why it holds.
It may state two separate claims as one.
- The authors state this as an assumption: The unobserved rank distribution of query volumes in the reference population follows a Zipf's law.
A result the paper states — it cites no source for it, so there is none to check. The quote shows it is in the paper.
In the paper
“Most of the queries received no observed volume, due to the fact they belong to the long tail of the distribution and then SEO tools do not monitor them.”
§ IEEE TRANSACTIONS ON KNOWLEDGE AND DATA ENGINEERING 1 Estimating the Total Volume of Queries to a Search Engine > 7 EMPIRICAL ANALYSIS
plainstates a cause- Asserted: passes — The authors put it forward as true.
- Checkable: passes — It can be checked against evidence.
- Load-bearing: unclear — It is unclear whether the paper’s conclusions depend on it.
- Based: passes — The paper gives a reason why it holds.
It may state two separate claims as one.
- The authors state this as an assumption: The unobserved rank distribution of query volumes in the reference population follows a Zipf's law.
A result the paper reports from its own data — it cites no other source for it, so there is none to check. The quote shows it is in the paper.
In the paper
“Noisy and nonuniform sampling (hereafter just noisy sampling) produces an empirical distribution very close to the one of non-uniform sampling and that is also consistent with our empirical data.”
§ IEEE TRANSACTIONS ON KNOWLEDGE AND DATA ENGINEERING 1 Estimating the Total Volume of Queries to a Search Engine > 4 BIASES IN SAMPLING FROM A ZIPF
plain- Asserted: passes — The authors put it forward as true.
- Checkable: passes — It can be checked against evidence.
- Load-bearing: unclear — It is unclear whether the paper’s conclusions depend on it.
- Based: passes — The paper gives a reason why it holds.
It may state two separate claims as one.
- The authors state this as an assumption: The distribution of searches follows a Zipf's law.
- The authors state this as an assumption: The sample of observed volumes is not uniform, but depends on the rank of queries over the population (non-uniform sampling).
- The authors state this as an assumption: The sampling probability decays exponentially with rank (geometric sampling).
A result the paper states — it cites no source for it, so there is none to check. The quote shows it is in the paper.
In the paper
“For instance, only 18.5K queries are assigned an observed volume estimate by Google Trends and only 12K queries by SearchVolume.”
§ IEEE TRANSACTIONS ON KNOWLEDGE AND DATA ENGINEERING 1 Estimating the Total Volume of Queries to a Search Engine > 1 INTRODUCTION
plain- Asserted: passes — The authors put it forward as true.
- Checkable: passes — It can be checked against evidence.
- Load-bearing: passes — The paper’s conclusions depend on it.
- Based: passes — The paper gives a reason why it holds.
It may state two separate claims as one.
A result the paper reports from its own data — it cites no other source for it, so there is none to check. The quote shows it is in the paper.
In the paper
“Estimations rapidly converge for increasing n's, except for noisy sampling in the case of NLS, and for sketchy sampling in the case of CSN.”
§ IEEE TRANSACTIONS ON KNOWLEDGE AND DATA ENGINEERING 1 Estimating the Total Volume of Queries to a Search Engine > Power law of volume distribution,
plainstates an association- Asserted: passes — The authors put it forward as true.
- Checkable: passes — It can be checked against evidence.
- Load-bearing: passes — The paper’s conclusions depend on it.
- Based: passes — The paper gives a reason why it holds.
It may state two separate claims as one.
A claim is checked only against the cited paper’s full text, never its abstract, and none is available for its sources.
In the paper
“Several works [1], [7], [8], [9] have observed that the probability that a query is searched v times is approximately Power law distributed, namely P (V = v) ∝ 1/v α .”
§ IEEE TRANSACTIONS ON KNOWLEDGE AND DATA ENGINEERING 1 Estimating the Total Volume of Queries to a Search Engine > 2 RELATED WORK
What the sources say
plainstates an association- Asserted: passes — The authors put it forward as true.
- Checkable: passes — It can be checked against evidence.
- Load-bearing: passes — The paper’s conclusions depend on it.
- Based: passes — The paper gives a reason why it holds.
Probably not a substantial claim.
A conclusion the paper draws from its own results — it cites no other source for it, so there is none to check. The quote shows it is in the paper.
In the paper
“Clearly, the presence of noise scrambles the frequencies, and, a fortiori, the ranks of observed volumes may differ from the ranks of true volumes.”
§ IEEE TRANSACTIONS ON KNOWLEDGE AND DATA ENGINEERING 1 Estimating the Total Volume of Queries to a Search Engine > 4 BIASES IN SAMPLING FROM A ZIPF
boostedstates a possible cause- Asserted: passes — The authors put it forward as true.
- Checkable: passes — It can be checked against evidence.
- Load-bearing: passes — The paper’s conclusions depend on it.
- Based: passes — The paper gives a reason why it holds.
It may state two separate claims as one.
A conclusion the paper draws from its own results — it cites no other source for it, so there is none to check. The quote shows it is in the paper.
In the paper
“They are able to find the total number and the total volume of the queries in the domain which have been searched at least v times in a given time period.”
§ IEEE TRANSACTIONS ON KNOWLEDGE AND DATA ENGINEERING 1 Estimating the Total Volume of Queries to a Search Engine > 8 CONCLUSION
plain- Asserted: passes — The authors put it forward as true.
- Checkable: passes — It can be checked against evidence.
- Load-bearing: passes — The paper’s conclusions depend on it.
- Based: passes — The paper gives a reason why it holds.
It may state two separate claims as one.
- The authors state this as an assumption: The unobserved rank distribution of query volumes in the reference population follows a Zipf's law.
A statement the paper makes itself — it cites no source for it, so there is none to check. The quote shows it is in the paper.
In the paper
“A DNS server local to an organization may maintain (approximate) counts of the number of queries per host name.”
§ IEEE TRANSACTIONS ON KNOWLEDGE AND DATA ENGINEERING 1 Estimating the Total Volume of Queries to a Search Engine > 8 CONCLUSION
hedged- Asserted: passes — The authors put it forward as true.
- Checkable: passes — It can be checked against evidence.
- Load-bearing: fails — The paper’s conclusions may not depend on it.
- Based: passes — The paper gives a reason why it holds.
Probably not a substantial claim. The paper’s conclusions may not depend on it.
A conclusion the paper draws from its own results — it cites no other source for it, so there is none to check. The quote shows it is in the paper.
In the paper
“If we concentrate on volumes larger than 10γc = c/100, sketchy sampling may impact for at most 10% of the volume, hence reducing the bias due to noise of Eq. 5.”
§ IEEE TRANSACTIONS ON KNOWLEDGE AND DATA ENGINEERING 1 Estimating the Total Volume of Queries to a Search Engine > Google Trends SearchVolume v v/12
hedgedstates a possible cause- Asserted: passes — The authors put it forward as true.
- Checkable: passes — It can be checked against evidence.
- Load-bearing: passes — The paper’s conclusions depend on it.
- Based: passes — The paper gives a reason why it holds.
It may state two separate claims as one.
A conclusion the paper draws from its own results — it cites no other source for it, so there is none to check. The quote shows it is in the paper.
In the paper
“In the case of Google Trends, one other bias is due to the scaling procedure from relative to absolute volumes.”
§ IEEE TRANSACTIONS ON KNOWLEDGE AND DATA ENGINEERING 1 Estimating the Total Volume of Queries to a Search Engine > 7.1 Google Trends (continuous data)
plainstates a cause- Asserted: passes — The authors put it forward as true.
- Checkable: passes — It can be checked against evidence.
- Load-bearing: fails — The paper’s conclusions may not depend on it.
- Based: fails — The paper may give no reason why it holds.
Probably not a substantial claim. The paper’s conclusions may not depend on it. The paper may give no reason why it holds.
- The authors state this as an assumption: The unobserved rank distribution of query volumes in the reference population follows a Zipf's law.
- The authors state this as an assumption: Observed volumes are biased only as modeled in Section 4.
A statement the paper makes itself — it cites no source for it, so there is none to check. The quote shows it is in the paper.
In the paper
“Second, data can be aggregated for arbitrary ranges of time and user agent languages.”
§ IEEE TRANSACTIONS ON KNOWLEDGE AND DATA ENGINEERING 1 Estimating the Total Volume of Queries to a Search Engine > 7.1 Google Trends (continuous data)
plain- Asserted: passes — The authors put it forward as true.
- Checkable: passes — It can be checked against evidence.
- Load-bearing: passes — The paper’s conclusions depend on it.
- Based: passes — The paper gives a reason why it holds.
Probably not a substantial claim.
A conclusion the paper draws from its own results — it cites no other source for it, so there is none to check. The quote shows it is in the paper.
In the paper
“Such a large number is consistent with the fact that the sample is not uniform, but top ranked queries are more likely to be in the sample.”
§ IEEE TRANSACTIONS ON KNOWLEDGE AND DATA ENGINEERING 1 Estimating the Total Volume of Queries to a Search Engine > 7.1 Google Trends (continuous data)
plainstates an association- Asserted: passes — The authors put it forward as true.
- Checkable: passes — It can be checked against evidence.
- Load-bearing: passes — The paper’s conclusions depend on it.
- Based: passes — The paper gives a reason why it holds.
It may state two separate claims as one.
- The authors state this as an assumption: The unobserved rank distribution of query volumes in the reference population follows a Zipf's law.
A conclusion the paper draws from its own results — it cites no other source for it, so there is none to check. The quote shows it is in the paper.
In the paper
“as it could be expected, the resulting density is closer to a Zipf for large volumes and it is closer to uniform distribution for small volumes.”
§ IEEE TRANSACTIONS ON KNOWLEDGE AND DATA ENGINEERING 1 Estimating the Total Volume of Queries to a Search Engine > Google Trends SearchVolume v v/12
hedgedstates an association- Asserted: passes — The authors put it forward as true.
- Checkable: passes — It can be checked against evidence.
- Load-bearing: passes — The paper’s conclusions depend on it.
- Based: passes — The paper gives a reason why it holds.
It may state two separate claims as one.
In the paper
“The volume per host name is known to follow a Zipf's law [27].”
§ IEEE TRANSACTIONS ON KNOWLEDGE AND DATA ENGINEERING 1 Estimating the Total Volume of Queries to a Search Engine > 8 CONCLUSION
What the sources say
- Not checked — no full text of the sourcecites [27] source
boostedstates an association- Asserted: passes — The authors put it forward as true.
- Checkable: passes — It can be checked against evidence.
- Load-bearing: fails — The paper’s conclusions may not depend on it.
- Based: passes — The paper gives a reason why it holds.
Probably not a substantial claim. The paper’s conclusions may not depend on it.
None of the sources cited for this claim have been checked yet.
In the paper
“For binned data, the analogue of Least Square regression method consists of minimizing the χ 2 (Chi-square) statistics [23].”
§ IEEE TRANSACTIONS ON KNOWLEDGE AND DATA ENGINEERING 1 Estimating the Total Volume of Queries to a Search Engine > 6.2 Chi-square Minimization
What the sources say
- Not checked yetcites [23] source
Checked before — its earlier verdict is held back until a new check runs.
plainstates a cause- Asserted: passes — The authors put it forward as true.
- Checkable: passes — It can be checked against evidence.
- Load-bearing: passes — The paper’s conclusions depend on it.
- Based: passes — The paper gives a reason why it holds.
Probably not a substantial claim.
- Not checked yet
A conclusion the paper draws from its own results — it cites no other source for it, so there is none to check. The quote shows it is in the paper.
In the paper
“The second critical issue is the construction of the sample set of queries.”
§ IEEE TRANSACTIONS ON KNOWLEDGE AND DATA ENGINEERING 1 Estimating the Total Volume of Queries to a Search Engine > 8 CONCLUSION
plain- Asserted: passes — The authors put it forward as true.
- Checkable: passes — It can be checked against evidence.
- Load-bearing: passes — The paper’s conclusions depend on it.
- Based: passes — The paper gives a reason why it holds.
Probably not a substantial claim.
A statement the paper makes itself — it cites no source for it, so there is none to check. The quote shows it is in the paper.
In the paper
“The underlying methods and log data used by the system are undisclosed.”
§ IEEE TRANSACTIONS ON KNOWLEDGE AND DATA ENGINEERING 1 Estimating the Total Volume of Queries to a Search Engine > 7.2 SearchVolume (binned data)
plain- Asserted: passes — The authors put it forward as true.
- Checkable: passes — It can be checked against evidence.
- Load-bearing: fails — The paper’s conclusions may not depend on it.
- Based: passes — The paper gives a reason why it holds.
Probably not a substantial claim. The paper’s conclusions may not depend on it.
The paper states this without a source or data behind it here, so there is nothing to check it against. The quote shows it is in the paper.
In the paper
“Most of the other tools, instead, provide monthly averages at the time of request, making it impossible to extend an experiment incrementally to new queries.”
§ IEEE TRANSACTIONS ON KNOWLEDGE AND DATA ENGINEERING 1 Estimating the Total Volume of Queries to a Search Engine > 7.1 Google Trends (continuous data)
plainstates a cause- Asserted: passes — The authors put it forward as true.
- Checkable: passes — It can be checked against evidence.
- Load-bearing: passes — The paper’s conclusions depend on it.
- Based: fails — The paper may give no reason why it holds.
Probably not a substantial claim. The paper may give no reason why it holds. It may state two separate claims as one.
A statement the paper makes itself — it cites no source for it, so there is none to check. The quote shows it is in the paper.
In the paper
“Also, SearchVolume provides the observed volume of queries for a few specific countries, including Italy.”
§ IEEE TRANSACTIONS ON KNOWLEDGE AND DATA ENGINEERING 1 Estimating the Total Volume of Queries to a Search Engine > 7.2 SearchVolume (binned data)
plain- Asserted: passes — The authors put it forward as true.
- Checkable: passes — It can be checked against evidence.
- Load-bearing: fails — The paper’s conclusions may not depend on it.
- Based: passes — The paper gives a reason why it holds.
Probably not a substantial claim. The paper’s conclusions may not depend on it.
A conclusion the paper draws from its own results — it cites no other source for it, so there is none to check. The quote shows it is in the paper.
In the paper
“This is somehow expected, and it can be attributed to the loss of information due to binning.”
§ IEEE TRANSACTIONS ON KNOWLEDGE AND DATA ENGINEERING 1 Estimating the Total Volume of Queries to a Search Engine > 7.2 SearchVolume (binned data)
plainstates a cause- Asserted: passes — The authors put it forward as true.
- Checkable: passes — It can be checked against evidence.
- Load-bearing: unclear — It is unclear whether the paper’s conclusions depend on it.
- Based: passes — The paper gives a reason why it holds.
It may state two separate claims as one.
The paper states this without a source or data behind it here, so there is nothing to check it against. The quote shows it is in the paper.
In the paper
“Third, observed volumes of Google Trends are ratio-scaled, while other SEO tools provide binned values, i.e., ranges of observed volumes.”
§ IEEE TRANSACTIONS ON KNOWLEDGE AND DATA ENGINEERING 1 Estimating the Total Volume of Queries to a Search Engine > 7.1 Google Trends (continuous data)
plain- Asserted: passes — The authors put it forward as true.
- Checkable: passes — It can be checked against evidence.
- Load-bearing: passes — The paper’s conclusions depend on it.
- Based: fails — The paper may give no reason why it holds.
Probably not a substantial claim. The paper may give no reason why it holds. It may state two separate claims as one.
A conclusion the paper draws from its own results — it cites no other source for it, so there is none to check. The quote shows it is in the paper.
In the paper
“However, other biases may be present in observed volumes from SEO tools.”
§ IEEE TRANSACTIONS ON KNOWLEDGE AND DATA ENGINEERING 1 Estimating the Total Volume of Queries to a Search Engine > 7.1 Google Trends (continuous data)
hedged- Asserted: passes — The authors put it forward as true.
- Checkable: passes — It can be checked against evidence.
- Load-bearing: fails — The paper’s conclusions may not depend on it.
- Based: passes — The paper gives a reason why it holds.
Probably not a substantial claim. The paper’s conclusions may not depend on it.
None of the sources cited for this claim have been checked yet.
In the paper
“Moreover, the method has been extended to the case of binned data in [5].”
§ IEEE TRANSACTIONS ON KNOWLEDGE AND DATA ENGINEERING 1 Estimating the Total Volume of Queries to a Search Engine > 2 RELATED WORK
What the sources say
- Not checked yetcites [5] source
Checked before — its earlier verdict is held back until a new check runs.
plain- Asserted: passes — The authors put it forward as true.
- Checkable: passes — It can be checked against evidence.
- Load-bearing: fails — The paper’s conclusions may not depend on it.
- Based: passes — The paper gives a reason why it holds.
Probably not a substantial claim. The paper’s conclusions may not depend on it.
- Not checked yet
None of the sources cited for this claim have been checked yet.
In the paper
“The estimated tail exponent, even in simulated data, significantly depends on the adopted method [12].”
§ IEEE TRANSACTIONS ON KNOWLEDGE AND DATA ENGINEERING 1 Estimating the Total Volume of Queries to a Search Engine > 2 RELATED WORK
What the sources say
- Not checked yetcites [12] source
Checked before — its earlier verdict is held back until a new check runs.
plainstates a cause- Asserted: passes — The authors put it forward as true.
- Checkable: passes — It can be checked against evidence.
- Load-bearing: fails — The paper’s conclusions may not depend on it.
- Based: passes — The paper gives a reason why it holds.
Probably not a substantial claim. The paper’s conclusions may not depend on it.
- Not checked yet
The paper states this without a source or data behind it here, so there is nothing to check it against. The quote shows it is in the paper.
In the paper
“SearchVolume is a popular SEO tool providing free access to bulk observed volumes.”
§ IEEE TRANSACTIONS ON KNOWLEDGE AND DATA ENGINEERING 1 Estimating the Total Volume of Queries to a Search Engine > 7.2 SearchVolume (binned data)
plain- Asserted: passes — The authors put it forward as true.
- Checkable: passes — It can be checked against evidence.
- Load-bearing: fails — The paper’s conclusions may not depend on it.
- Based: fails — The paper may give no reason why it holds.
Probably not a substantial claim. The paper’s conclusions may not depend on it. The paper may give no reason why it holds. It may state two separate claims as one.
What the paper did — it cites no source for this, so there is none to check. The quote shows it is in the paper.
In the paper
“Considering a whole year prevents seasonal bias in data.”
§ IEEE TRANSACTIONS ON KNOWLEDGE AND DATA ENGINEERING 1 Estimating the Total Volume of Queries to a Search Engine > 7 EMPIRICAL ANALYSIS
plainstates a cause- Asserted: passes — The authors put it forward as true.
- Checkable: passes — It can be checked against evidence.
- Load-bearing: passes — The paper’s conclusions depend on it.
- Based: fails — The paper may give no reason why it holds.
Probably not a substantial claim. The paper may give no reason why it holds.
The paper states this without a source or data behind it here, so there is nothing to check it against. The quote shows it is in the paper.
In the paper
“Independent SEO tools are known to be more conservative than Google-owned tools.”
§ IEEE TRANSACTIONS ON KNOWLEDGE AND DATA ENGINEERING 1 Estimating the Total Volume of Queries to a Search Engine > 7.2 SearchVolume (binned data)
boostedstates an association- Asserted: passes — The authors put it forward as true.
- Checkable: passes — It can be checked against evidence.
- Load-bearing: fails — The paper’s conclusions may not depend on it.
- Based: fails — The paper may give no reason why it holds.
Probably not a substantial claim. The paper’s conclusions may not depend on it. The paper may give no reason why it holds.
In the paper
“A major breakthrough was the method proposed in [4], which consists in a maximumlikelihood estimation, with a cutoff for the fitting region determined with a Kolmogorov-Smirnov test.”
§ IEEE TRANSACTIONS ON KNOWLEDGE AND DATA ENGINEERING 1 Estimating the Total Volume of Queries to a Search Engine > 2 RELATED WORK
What the sources say
- Not checked yetcites [4] source
boosted- Asserted: passes — The authors put it forward as true.
- Checkable: passes — It can be checked against evidence.
- Load-bearing: fails — The paper’s conclusions may not depend on it.
- Based: passes — The paper gives a reason why it holds.
Probably not a substantial claim. The paper’s conclusions may not depend on it.
A conclusion the paper draws from its own results — it cites no other source for it, so there is none to check. The quote shows it is in the paper.
In the paper
“The above arguments are not specific of the two tools we are considering in this paper, but they apply when contrasting any pair of SEO tools.”
§ IEEE TRANSACTIONS ON KNOWLEDGE AND DATA ENGINEERING 1 Estimating the Total Volume of Queries to a Search Engine > 7.2 SearchVolume (binned data)
plain- Asserted: passes — The authors put it forward as true.
- Checkable: passes — It can be checked against evidence.
- Load-bearing: fails — The paper’s conclusions may not depend on it.
- Based: fails — The paper may give no reason why it holds.
Probably not a substantial claim. The paper’s conclusions may not depend on it. The paper may give no reason why it holds.
A conclusion the paper draws from its own results — it cites no other source for it, so there is none to check. The quote shows it is in the paper.
In the paper
“The impact of biased β on the estimated total volume V can be readily explained when ĉ = c -which holds in simulations, as shown in Figure 3.”
§ IEEE TRANSACTIONS ON KNOWLEDGE AND DATA ENGINEERING 1 Estimating the Total Volume of Queries to a Search Engine > 5.3 Estimating V
plainstates a cause- Asserted: passes — The authors put it forward as true.
- Checkable: passes — It can be checked against evidence.
- Load-bearing: unclear — It is unclear whether the paper’s conclusions depend on it.
- Based: passes — The paper gives a reason why it holds.
It may state two separate claims as one.
A conclusion the paper draws from its own results — it cites no other source for it, so there is none to check. The quote shows it is in the paper.
In the paper
“Overall, this reinforces our previous conclusion that, in practical settings, the selection of sample queries must carefully include the most popular ones.”
§ IEEE TRANSACTIONS ON KNOWLEDGE AND DATA ENGINEERING 1 Estimating the Total Volume of Queries to a Search Engine > 5.3 Estimating V
plainstates a cause- Asserted: passes — The authors put it forward as true.
- Checkable: passes — It can be checked against evidence.
- Load-bearing: passes — The paper’s conclusions depend on it.
- Based: passes — The paper gives a reason why it holds.
Probably not a substantial claim.
A conclusion the paper draws from its own results — it cites no other source for it, so there is none to check. The quote shows it is in the paper.
In the paper
“The domain considered in this paper has well-defined boundaries that make it reasonably coherent.”
§ IEEE TRANSACTIONS ON KNOWLEDGE AND DATA ENGINEERING 1 Estimating the Total Volume of Queries to a Search Engine > 8 CONCLUSION
plain- Asserted: passes — The authors put it forward as true.
- Checkable: fails — It may be too vague to check against evidence.
- Load-bearing: passes — The paper’s conclusions depend on it.
- Based: fails — The paper may give no reason why it holds.
Probably not a substantial claim. It may be too vague to check against evidence. The paper may give no reason why it holds.
- The authors state this as an assumption: The unobserved rank distribution of query volumes in the reference population follows a Zipf's law.
None of the sources cited for this claim have been checked yet.
In the paper
“Ref. [24] points out that the granularity and extent of a reference population should exhibit a “coherence” property.”
§ IEEE TRANSACTIONS ON KNOWLEDGE AND DATA ENGINEERING 1 Estimating the Total Volume of Queries to a Search Engine > 8 CONCLUSION
What the sources say
- Not checked yetcites [24] source
Checked before — its earlier verdict is held back until a new check runs.
plain- Asserted: passes — The authors put it forward as true.
- Checkable: fails — It may be too vague to check against evidence.
- Load-bearing: passes — The paper’s conclusions depend on it.
- Based: passes — The paper gives a reason why it holds.
Probably not a substantial claim. It may be too vague to check against evidence.
- Not checked yet
A conclusion the paper draws from its own results — it cites no other source for it, so there is none to check. The quote shows it is in the paper.
In the paper
“The third critical issue is concerned with understanding (eg., through statistical tests) which type of bias is likely to be present in empirical data provided by a specific SEO tool.”
§ IEEE TRANSACTIONS ON KNOWLEDGE AND DATA ENGINEERING 1 Estimating the Total Volume of Queries to a Search Engine > 8 CONCLUSION
hedged- Asserted: fails — The authors may not put it forward as true.
- Checkable: fails — It may be too vague to check against evidence.
- Load-bearing: fails — The paper’s conclusions may not depend on it.
- Based: passes — The paper gives a reason why it holds.
Probably not a substantial claim. The authors may not put it forward as true. It may be too vague to check against evidence. The paper’s conclusions may not depend on it.
A conclusion the paper draws from its own results — it cites no other source for it, so there is none to check. The quote shows it is in the paper.
In the paper
“NLS has two advantages over CSN.First, intercept c and coefficient β are estimated together in the same procedure.Second, the regression directly estimates β, while in the CSN method β is estimated with a formula involving the estimator of α.”
§ IEEE TRANSACTIONS ON KNOWLEDGE AND DATA ENGINEERING 1 Estimating the Total Volume of Queries to a Search Engine > Power law of volume distribution,
plain- Asserted: passes — The authors put it forward as true.
- Checkable: passes — It can be checked against evidence.
- Load-bearing: passes — The paper’s conclusions depend on it.
- Based: passes — The paper gives a reason why it holds.
It may state two separate claims as one.
A conclusion the paper draws from its own results — it cites no other source for it, so there is none to check. The quote shows it is in the paper.
In the paper
“The first critical issue for extending our analysis to other domains consists of checking the hypothesis that the population of queries in the domain is Zipfian.”
§ IEEE TRANSACTIONS ON KNOWLEDGE AND DATA ENGINEERING 1 Estimating the Total Volume of Queries to a Search Engine > 8 CONCLUSION
plain- Asserted: passes — The authors put it forward as true.
- Checkable: passes — It can be checked against evidence.
- Load-bearing: passes — The paper’s conclusions depend on it.
- Based: passes — The paper gives a reason why it holds.
Probably not a substantial claim.
- The authors state this as an assumption: The unobserved rank distribution of query volumes in the reference population follows a Zipf's law.
A statement the paper makes itself — it cites no source for it, so there is none to check. The quote shows it is in the paper.
In the paper
“Binned-CSN only provides an estimation for the coefficient β, while Chi-square provides an estimator for the intercept c as well.”
§ IEEE TRANSACTIONS ON KNOWLEDGE AND DATA ENGINEERING 1 Estimating the Total Volume of Queries to a Search Engine > 6.3 Constrained Chi-square Minimization
plain- Asserted: passes — The authors put it forward as true.
- Checkable: passes — It can be checked against evidence.
- Load-bearing: passes — The paper’s conclusions depend on it.
- Based: passes — The paper gives a reason why it holds.
It may state two separate claims as one.
The paper states this without a source or data behind it here, so there is nothing to check it against. The quote shows it is in the paper.
In the paper
“In fact, in web marketing practice, the adoption of a specific SEO tool is mainly based on reputation and trust on the tool.”
§ IEEE TRANSACTIONS ON KNOWLEDGE AND DATA ENGINEERING 1 Estimating the Total Volume of Queries to a Search Engine > 7.2 SearchVolume (binned data)
plainstates a cause- Asserted: passes — The authors put it forward as true.
- Checkable: fails — It may be too vague to check against evidence.
- Load-bearing: fails — The paper’s conclusions may not depend on it.
- Based: fails — The paper may give no reason why it holds.
Probably not a substantial claim. It may be too vague to check against evidence. The paper’s conclusions may not depend on it. The paper may give no reason why it holds.
The authors state this as an assumption.
The distribution of searches follows a Zipf's law.
“Our statistical model assumes that the distribution of searches follows a Zipf's law”
“We start from the basic assumption that the rank-volume distribution of the whole population of queries (i.e.observed and unobserved) follows a Zipf's law.”
“We assume that the distribution of searches follows a Zipf's law”
The authors state this as an assumption.
The observed sample volumes are biased according to three possible scenarios.
“Our statistical model assumes that the distribution of searches follows a Zipf's law, and that the observed sample volumes are biased accordingly to three possible scenarios.”
The authors state this as an assumption.
The sample of observed volumes is not uniform, but depends on the rank of queries over the population (non-uniform sampling).
“We are able to model this behavior by assuming that the sample of observed volumes is not uniform, but it depends on the rank of queries over the population (non-uniform sampling).”
The authors state this as an assumption.
The sampling probability decays exponentially with rank (geometric sampling).
“we consider a geometric sampling p i ∝ p(1 -p) i-1 , i.e., the sampling probability decays exponentially with the rank.”
The authors state this as an assumption.
The smallest volume of a query in the population V_N is known and equals 1.
“We assume that V N , the smallest volume of a query in the population, is known.This assumption is realistic for absolute frequencies, since V N = 1.”
The paper relies on this without support.
Low-volume queries are monitored with low probability by SEO tools, and for such queries SEO tools return no observed volume.
“Low volume queries are monitored with low probability by SEO tools.For such queries, SEO tools return no observed volume.”
The paper relies on this without support.
The biases behind observed volumes reported by SEO tools remain unknown.
“The biases behind observed volumes reported by SEO tools remain unknown.”
The paper relies on this without support.
Most SEO tools do not provide an absolute observed volume of a query, but rather provide an interval estimate of the volume (binned observed volumes).
“Most SEO tools do not provide an absolute observed volume of a query, but rather they provide an interval estimate of the volume, i.e., binned observed volumes.”
The paper relies on this without support.
Intervals ameliorate the noise introduced in the estimation process.
“The motivation is that intervals ameliorate for the noise introduced in the estimation process.”
The authors state this as an assumption.
There are M bins, and for j ∈ [1, M], the j-th bin consists of the interval [ℓ_{j-1}, ℓ_j), where ℓ_0 = V_N.
“We assume that there are M bins, and that for j ∈ [1, M ], the j-th bin consists of the interval [ℓ j-1 , ℓ j ), where ℓ 0 = V N (the smallest volume).”
The paper relies on this without support.
SEO tools typically report as observed volume the upper bound ℓ_j of the bin.
“SEO tools typically report as observed volume the upper bound ℓ j of the bin.”
The authors state this as an assumption.
The errors ∆β on β and ∆c on c are independent.
“Using the propagation of errors under the assumption that the errors ∆β on β and ∆c on c are independent, the error on N is:”
The authors state this as an assumption.
The unobserved rank distribution of query volumes in the reference population follows a Zipf's law.
“By doing the sensible assumption that the unobserved rank distribution of query volumes follows a Zipf's law”
“This motivated our assumption that the reference population, namely the queries searched in a reference domain, follows a Zipf's law.”
The authors state this as an assumption.
Observed volumes are biased only as modeled in Section 4.
“It is worth noting that these conclusions hold under the assumption that observed volumes are biased only as modeled in Section 4.”
The authors state this as an assumption.
There is no information on the sampling bias.
“Assuming no information on the sampling bias”
Self-check
Percentages, sums and reported differences re-computed from the paper’s own numbers.
Each contradiction between two passages listed here was confirmed by an independent check.
Rated minor: it would not touch a result — a value no result rests on, a p-value that stays on the same side of the significance level, or a conflict that is clerical, resolved elsewhere in the paper, or outside its own findings.
In the paper
§ IEEE TRANSACTIONS ON KNOWLEDGE AND DATA ENGINEERING 1 Estimating the Total Volume of Queries to a Search Engine > 5.3 Estimating V
“We plot Eq. 8 as a function of V, under the assumption that V N is known, in Figure 7.”
§ IEEE TRANSACTIONS ON KNOWLEDGE AND DATA ENGINEERING 1 Estimating the Total Volume of Queries to a Search Engine > 5.2 Estimating N
“Fig. 7.Estimated volume (Eq.8) as a function of β, assuming ĉ = c.”
Rated minor: it would not touch a result — a value no result rests on, a p-value that stays on the same side of the significance level, or a conflict that is clerical, resolved elsewhere in the paper, or outside its own findings.
In the paper
§ IEEE TRANSACTIONS ON KNOWLEDGE AND DATA ENGINEERING 1 Estimating the Total Volume of Queries to a Search Engine > 5.3 Estimating V
“For sketchy sampling, the overestimation is very large: it is out of the bounds of the plot.Again, this can be traced back to a larger underestimation of β compared to the CSN method.”
§ IEEE TRANSACTIONS ON KNOWLEDGE AND DATA ENGINEERING 1 Estimating the Total Volume of Queries to a Search Engine > 5.3 Estimating V
“Consider now the case of using in the first step of the procedure the CSN method coupled with the max-estimator.”
Rated minor: it would not touch a result — a value no result rests on, a p-value that stays on the same side of the significance level, or a conflict that is clerical, resolved elsewhere in the paper, or outside its own findings.
In the paper
§ IEEE TRANSACTIONS ON KNOWLEDGE AND DATA ENGINEERING 1 Estimating the Total Volume of Queries to a Search Engine > 6.2 Chi-square Minimization
“the estimation of β performs comparably well to the Binned-CSN method for non-uniform and noisy sampling (see Figure 11).”
§ IEEE TRANSACTIONS ON KNOWLEDGE AND DATA ENGINEERING 1 Estimating the Total Volume of Queries to a Search Engine > SOFTWARE CODE
“Fig. 11.Simulations on estimation of c for binned data: error bars (mean ± stdev).The horizontal line is the true value of c.”
Rated minor: it would not touch a result — a value no result rests on, a p-value that stays on the same side of the significance level, or a conflict that is clerical, resolved elsewhere in the paper, or outside its own findings.
In the paper
§ IEEE TRANSACTIONS ON KNOWLEDGE AND DATA ENGINEERING 1 Estimating the Total Volume of Queries to a Search Engine > 8 CONCLUSION
“In this paper, we considered three possible scenarios: uniform sampling alone, or together with normally distributed noise (noisy sampling), or together with count-min sketch like approximation (sketchy sampling).”
§ IEEE TRANSACTIONS ON KNOWLEDGE AND DATA ENGINEERING 1 Estimating the Total Volume of Queries to a Search Engine > 4 BIASES IN SAMPLING FROM A ZIPF
“We call such model the sketchy and non-uniform sampling, hereafter just sketchy sampling.”
Citations
Cites
Power-Law Distributions in Empirical Data
Clauset, A., Shalizi, C. R., & Newman, M. E. J. (2009) · SIAM Review · doi:10.1137/070710111 · Cited by 8,019
Power-law distributions in empirical data
Clauset, A. J., Shalizi, C. R., & Newman, M. E. J. (2018) · Figshare · doi:10.1184/r1/6586835.v1 · Cited by 6,710
Newman (2005) · doi:10.1080/00107510500052444 · Cited by 5,749
An improved data stream summary: the count-min sketch and its applications
Cormode, G., & Muthukrishnan, S. (2005) · Journal of Algorithms · doi:10.1016/j.jalgor.2003.12.001 · Cited by 1,743
Broido, A. D., & Clauset, A. (2019) · Nature Communications · doi:10.1038/s41467-019-08746-5 · Cited by 875
Rank − 1 / 2: A Simple Way to Improve the OLS Estimation of Tail Exponents
Gabaix, X., & Ibragimov, R. (2009) · Journal of Business and Economic Statistics · doi:10.1198/jbes.2009.06157 · Cited by 572
Synopses for Massive Data: Samples, Histograms, Wavelets, Sketches
Cormode, G., Garofalakis, M., Haas, P. J., & Jermaine, C. (2011) · Foundations and Trends in Databases · doi:10.1561/1900000004 · Cited by 500
Problems with fitting to the power-law distribution
Goldstein, M. L., Morris, S. A., & Yen, G. G. (2004) · The European Physical Journal B · doi:10.1140/epjb/e2004-00316-5 · Cited by 495
Fitting Heavy Tailed Distributions: The poweRlaw Package
Gillespie, C. S. (2015) · Journal of Statistical Software · doi:10.18637/jss.v064.i02 · Cited by 483
The impact of caching on search engines
Baeza-Yates, R. A., Gionis, A., Junqueira, F., Murdock, V., Plachouras, V., & Silvestri, F. (2007) · International ACM SIGIR Conference on Research and Development in Information Retrieval (SIGIR) · doi:10.1145/1277741.1277775 · Cited by 212
Power-law distributions in binned empirical data
Virkar, Y., & Clauset, A. (2014) · The Annals of Applied Statistics · doi:10.1214/13-aoas710 · Cited by 209
Extracting semantic relations from query logs
Baeza-Yates, R., & Tiberi, A. (2007) · Proceedings of the 13th ACM SIGKDD international conference on Knowledge discovery and data mining · doi:10.1145/1281192.1281204 · Cited by 208
Voitalov, I., van der Hoorn, P., van der Hofstad, R., & Krioukov, D. (2019) · Physical Review Research · doi:10.1103/physrevresearch.1.033034 · Cited by 207
Minimum Chi-Square, not Maximum Likelihood!
Berkson, J. (1980) · The Annals of Statistics · doi:10.1214/aos/1176345003 · Cited by 193
DNS performance and the effectiveness of caching
Jung, J., Sit, E., Balakrishnan, H., & Morris, R. (2002) · IEEE/ACM Transactions on Networking · doi:10.1109/tnet.2002.803905 · Cited by 182
Rare and everywhere: Perspectives on scale-free networks
Holme, P. (2019) · Nature Communications · doi:10.1038/s41467-019-09038-8 · Cited by 181
There is More than a Power Law in Zipf
Cristelli, M., Batty, M., & Pietronero, L. (2012) · Scientific Reports · doi:10.1038/srep00812 · Cited by 143
Data mining from web search queries: A comparison of google trends and baidu index
Vaughan, L. Q., & Chen, Y. (2014) · Journal of the Association for Information Science and Technology · doi:10.1002/asi.23201 · Cited by 132
Optimal prediction of the number of unseen species
Orlitsky, A., Suresh, A. T., & Wu, Y. (2016) · Proceedings of the National Academy of Sciences · doi:10.1073/pnas.1607774113 · Cited by 124
Efficient Private Statistics with Succinct Sketches
Melis, L., Danezis, G., & Cristofaro, E. D. (2016) · Network and Distributed System Security Symposium · doi:10.14722/ndss.2016.23175 · Cited by 113
PARETO OR LOG‐NORMAL? BEST FIT AND TRUNCATION IN THE DISTRIBUTION OF ALL CITIES*
Fazio, G., & Modica, M. (2015) · Journal of Regional Science · doi:10.1111/jors.12205 · Cited by 47
Power Law Distributions in Information Retrieval
Petersen, C., Simonsen, J. G., & Lioma, C. (2016) · ACM Transactions on Information Systems · doi:10.1145/2816815 · Cited by 46
Synopses for Massive Data: Samples, Histograms, Wavelets, Sketches
Cormode, G. (2011) · doi:10.1561/9781601985170 · Cited by 29
Batch query processing for web search engines
Ding, S., Attenberg, J., Baeza-Yates, R., & Suel, T. (2011) · Proceedings of the fourth ACM international conference on Web search and data mining · doi:10.1145/1935826.1935858 · Cited by 22
Evaluating the effectiveness of information retrieval systems using simulated queries
Gordon, M. D. (1990) · Journal of the American Society for Information Science · doi:10.1002/(sici)1097-4571(199007)41:5 · Cited by 12
Constrained Private Mechanisms for Count Data
Cormode, G., Kulkarni, T., & Srivastava, D. (2018) · IEEE International Conference on Data Engineering (ICDE) · doi:10.1109/icde.2018.00081 · Cited by 5
Estimating the Total Volume of Queries to Google
Lillo, F., & Ruggieri, S. (2019) · International World Wide Web Conference (WWW) · doi:10.1145/3308558.3313535 · Cited by 5
Self-citation(2002)
Cited by
Sorted by citations
The Spanish population’s interest in climate change based on Internet searches
Álvarez-García, O., Negre, J. S., Forgas, R. C., & Trobat, M. F. O. (2023) · Humanities and Social Sciences Communications · doi:10.1057/s41599-023-01736-5 · Cited by 9
RAC: Relation-Aware Cache Replacement for Large Language ModelsPreprint
Wu, Y., Xu, Z., Ni, W., Cheng, P., Chen, L., Lin, X., Shen, H. T., & Ren, K. (2026) · arXiv (Cornell University) · doi:10.48550/arxiv.2602.21547
Gómez-Pantoja, C., Inostrosa‐Psijas, A., Gil-Costa, V., & Marín, M. (2026) · IEEE Access · doi:10.1109/access.2026.3702877
Algorithmic interception: ad-tech, climate, and the case of Canada’s oil sands
McCurdy, P. M., Russill, C., & Kliever, J. (2026) · Environmental Research Letters · doi:10.1088/1748-9326/ae7b58
Metadata
- Authors
- Lillo, F., & Ruggieri, S.
- Affiliations
- University of Bologna (IT)
- University of Pisa (IT)
- Venue
- IEEE Transactions on Knowledge and Data Engineering
- Published
- 2022-11-01
- Volume
- 34
- Issue
- 11
- Pages
- 5351-5363
- ISSN
- 1041-4347 (ISSN-L)
- 1558-2191
- 2326-3865
- OpenAlex
- W3122354058
- Cited by
- 4
- References
- 28
- Citations by year
- 2026: 3 · 2023: 1
- FWCI
- 0.16
- Type
- journal article
- Language
- en
- Open access
- green
- arxiv.org
- Licence
- Locations
- IEEE Transactions on Knowledge and Data Engineering (publishedVersion)
- arXiv (Cornell University) (submittedVersion, cc-by)
- Archivio istituzionale della ricerca (Alma Mater Studiorum Università di Bologna) (submittedVersion, other-oa)
- arXiv (Cornell University) (submittedVersion)
- CINECA IRIS Institutial research information system (University of Pisa) (submittedVersion, other-oa)
- Scuola Normale Superiore di Pisa (submittedVersion, other-oa)
- arXiv (Cornell University) (cc-by)
- Funders
- ForTop S.R.L.
- Topics
- Physical Sciences › Computer Science › Information Systems › Information Retrieval and Search Behavior
- Physical Sciences › Mathematics › Statistics and Probability › Census and Population Estimation
- Physical Sciences › Computer Science › Information Systems › Web visibility and informetrics
- Keywords
- web search queries, Zipf's law, power-law distribution, sampling bias, nonlinear least squares, chi-square minimization, Google Trends, keyword research, Italian language
About these checks
Registry, retraction, Cites and statistics results are computed, not judged, with one exception: a printed reference that no index lists is read once by a model before it counts as a citation error. Claims are extracted by a model and kept only when their quote appears verbatim in the text; each cited source is then checked, with a model’s help, for whether it says what the claim relies on. Those verdicts can be wrong — read the claim’s quote and the cited source before relying on one.
A language model drew the claims from the paper on 2026-11-11, under version 3 of the claim definition (model deepseek-v4.1-flash, prompt extract-v3).
A second model labelled each claim on 2026-11-11 (model jev-1.13-20260917, definition revision gold-guideline-v0.2).
Cited sources are checked with a language model’s help (gpt-6-sol).
Statistics and arithmetic are recomputed, not judged.
Confidence bands are shown only for fields calibrated on our annotated test set. None is calibrated yet, so no band is shown.
What counts as a claim ›How we measure confidence ›How we check this ›
Are you an author, or do you see a problem with this page? Request a review
