

Empirical Wavelet Transform
Open accessThe DOI matches its Crossref record; 16 of the 17 references it cites were found in a registry or an index.
Abstract
Some recent methods, like the empirical mode decomposition (EMD), propose to decompose a signal accordingly to its contained information. Even though its adaptability seems useful for many applications, the main issue with this approach is its lack of theory. This paper presents a new approach to build adaptive wavelets. The main idea is to extract the different modes of a signal by designing an appropriate wavelet filter bank. This construction leads us to a new wavelet transform, called the empirical wavelet transform. Many experiments are presented showing the usefulness of this method compared to the classic EMD.
Overview
The claims and statistics of this paper haven’t been checked yet.
Free: it reads the open-access text and checks the first 5 claims that cite a source we can check. Create a free account to check every claim.
Integrity signals
Registry
Cites
Statistics
Figures
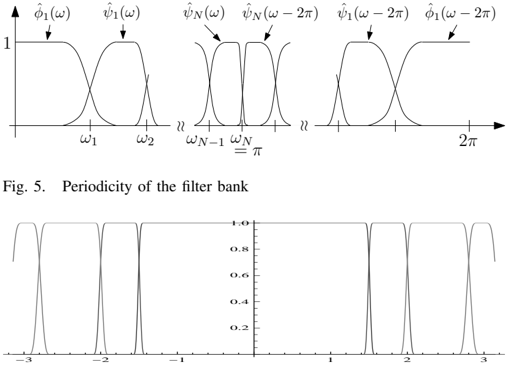
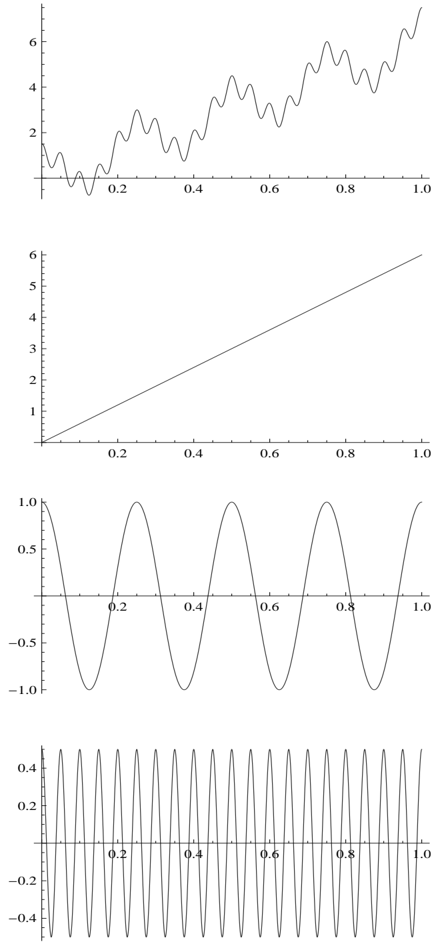
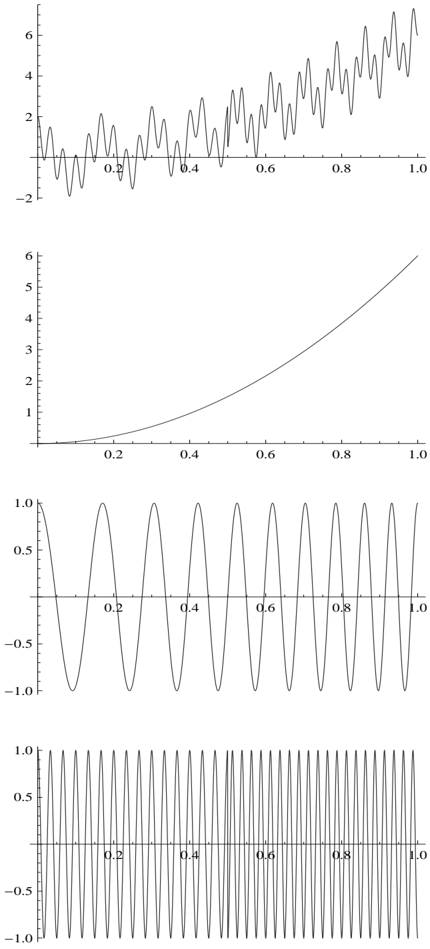
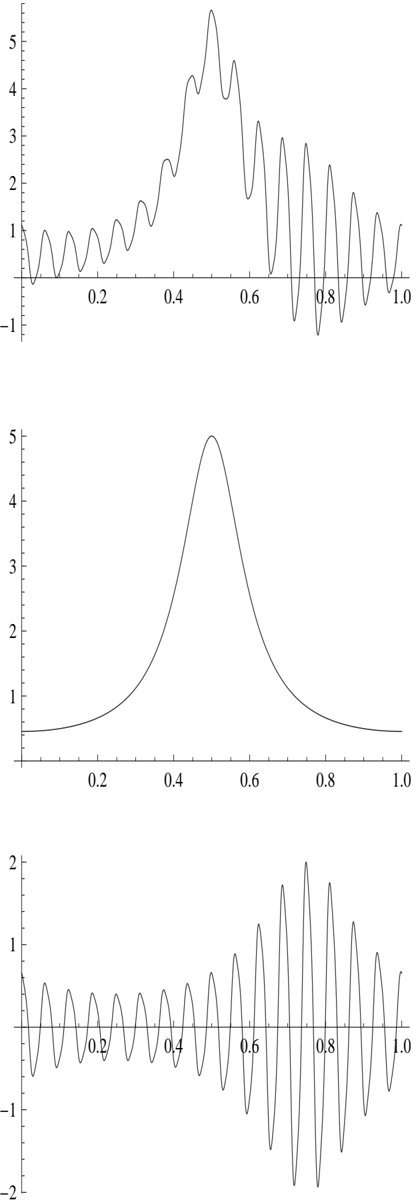
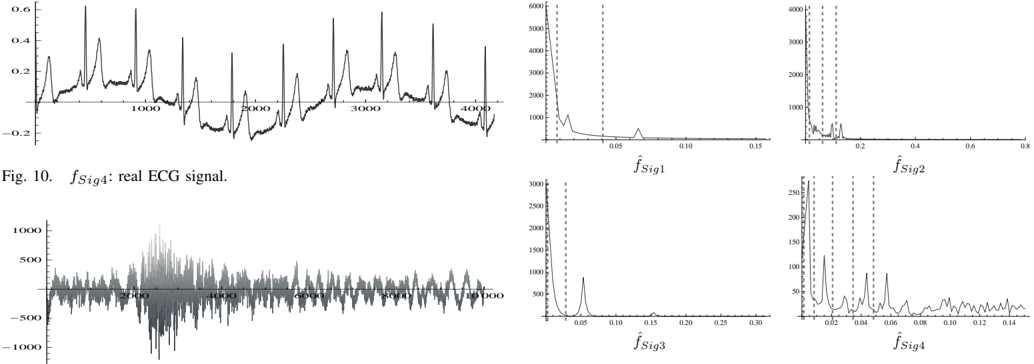
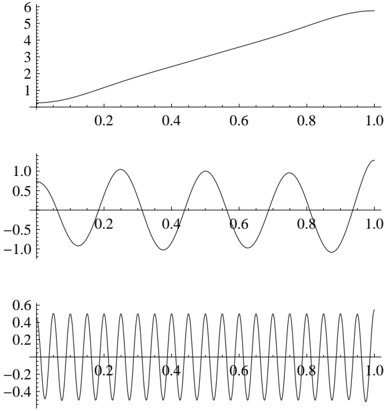
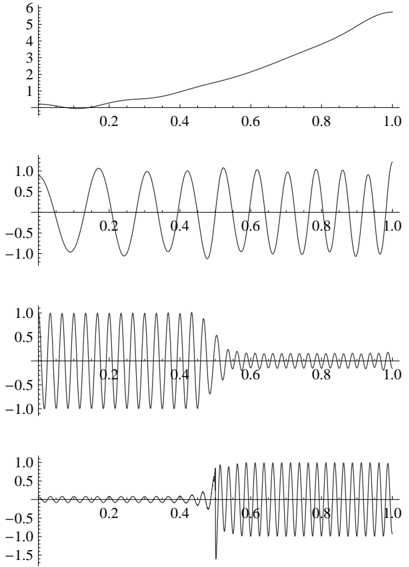
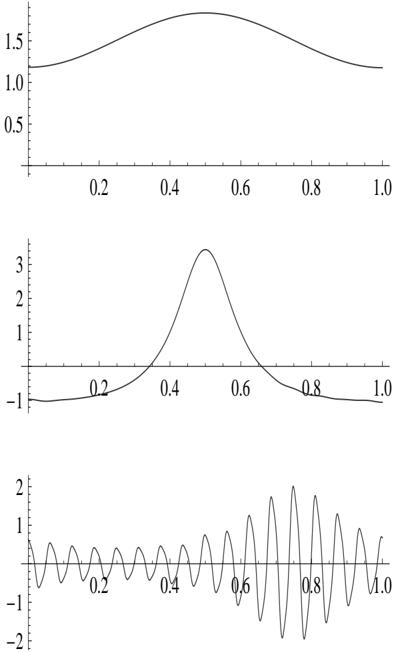
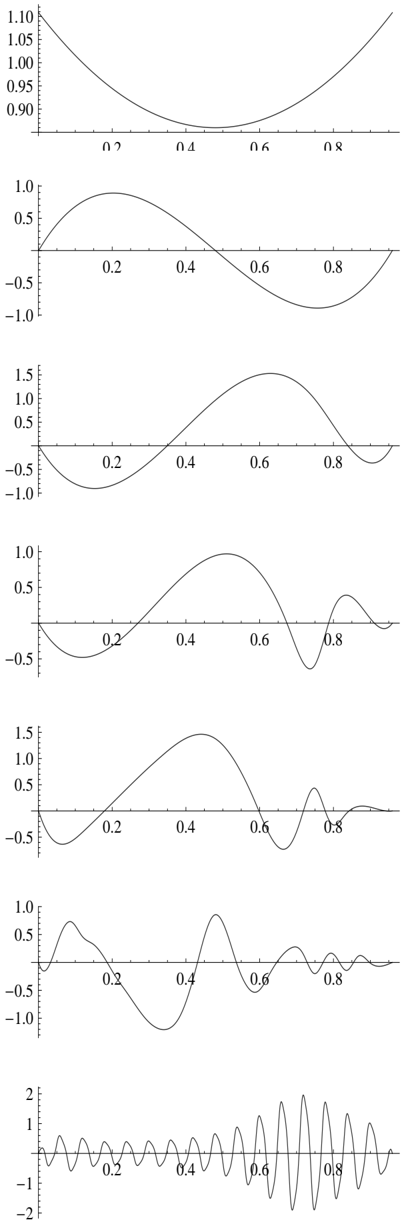
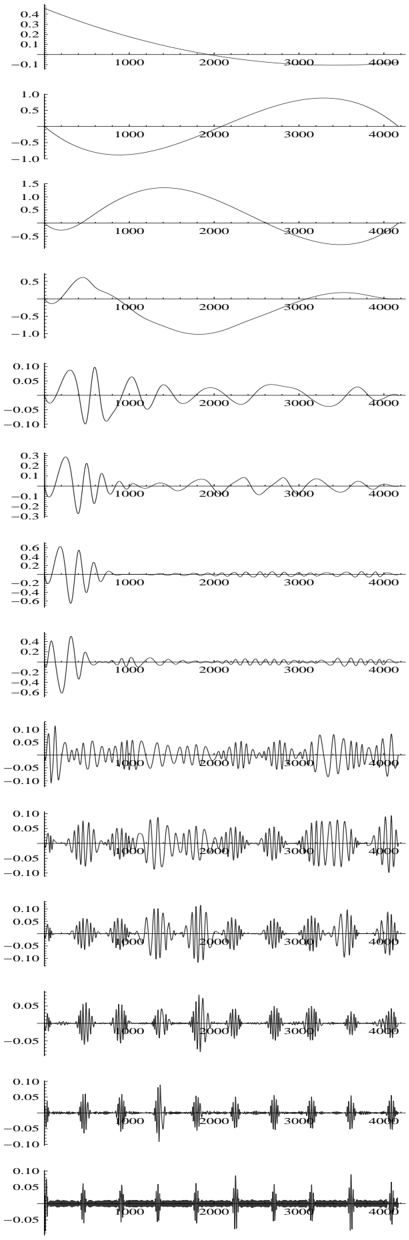
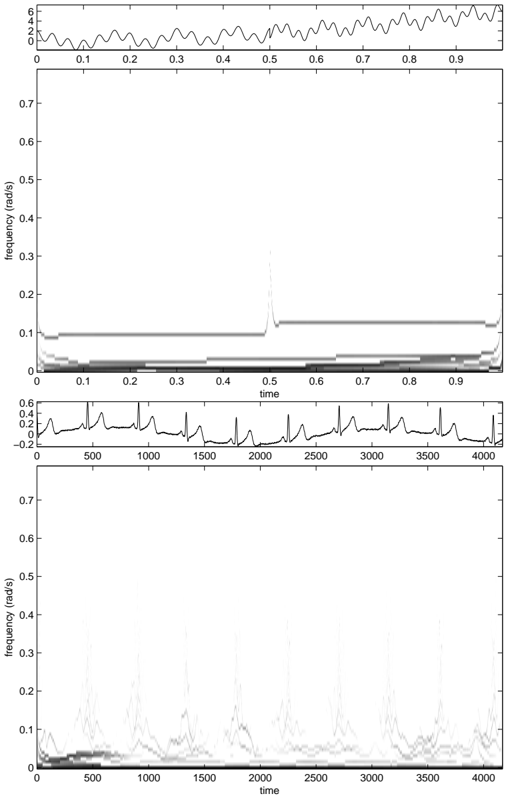
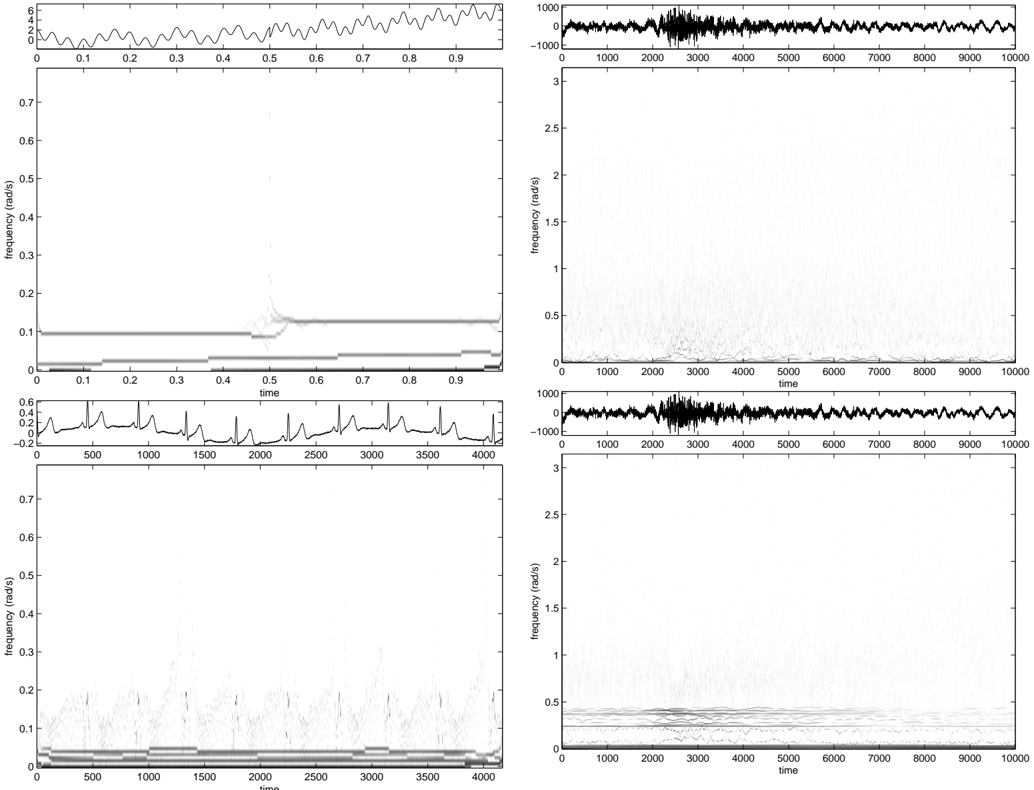

Verification
Claims the paper makes
The claims and statistics of this paper haven’t been checked yet.
Free: it reads the open-access text and checks the first 5 claims that cite a source we can check. Create a free account to check every claim.
Claims other papers make about this one
Each is checked against this paper’s own text: does it say what the citing paper says it does?
The source backs part of the claim, not all of it — or backs it for a different population, condition or comparison.
In the citing paper
“Empirical wavelet transform (EWT), proposed by Gilles in 2013 [35], is an adaptive method that can select frequency bands, overcome mode mixing, and reduce computational complexity.”
From Prediction of Heat and Cold Loads of Factory Mushroom Houses Based on EWT Decomposition (2023) · cites this paper as [35]
Experimental — accuracy not yet measured
Self-check
Percentages, sums and reported differences re-computed from the paper’s own numbers.
The self-check needs the paper’s full text.
Citations
Cites
Huang, N. E., Shen, Z., Long, S. R., Wu, M. C., Shih, H. H., Zheng, Q., Yen, N.-C., Tung, C. C., & Liu, H. H. (1998) · Proceedings of the Royal Society of London. Series A: Mathematical, Physical and Engineering Sciences · doi:10.1098/rspa.1998.0193 · Cited by 23,564 · cited 4×
“In this paper, as we will use the Fourier formalism in Section III, we adopt the description used in [4] which is slightly different from the original used in [9].”
MethodInfluentialDaubechies, I. (1992) · doi:10.1137/1.9781611970104 · Cited by 15,979
Entropy-based algorithms for best basis selection
Coifman, R. R., & Wickerhauser, M. V. (1992) · IEEE Transactions on Information Theory · doi:10.1109/18.119732 · Cited by 3,188 · cited 1×
“We also want to mention the differences with local cosine (sine) bases [1], [2].”
BackgroundA complete ensemble empirical mode decomposition with adaptive noise
Torres, M. E., Colominas, M. A., Schlotthauer, G., & Flandrin, P. (2011) · 2011 IEEE International Conference on Acoustics, Speech and Signal Processing (ICASSP) · doi:10.1109/icassp.2011.5947265 · Cited by 2,801 · cited 1×
“To deal with this problem, an Ensemble EMD (EEMD) was proposed in [17].”
MethodA Wavelet Tour of Signal Processing : The Sparse Way
Mallat, S., & Gabriel Peyré, A. (2008) · Cited by 2,734
Empirical Mode Decomposition as a Filter Bank
Flandrin, P., Rilling, G., & Goncalves, P. (2004) · IEEE Signal Processing Letters · doi:10.1109/lsp.2003.821662 · Cited by 2,583
Synchrosqueezed wavelet transforms: An empirical mode decomposition-like tool
Daubechies, I., Lu, J., & Wu, H.-T. (2011) · Applied and Computational Harmonic Analysis · doi:10.1016/j.acha.2010.08.002 · Cited by 2,489 · cited 3×
“In this paper, as we will use the Fourier formalism in Section III, we adopt the description used in [4] which is slightly different from the original used in [9].”
BackgroundMethodThakur, G., Brevdo, E., Fučkar, N. S., & Wu, H.-T. (2013) · Signal Processing · doi:10.1016/j.sigpro.2012.11.029 · Cited by 526
Lapped transforms for efficient transform/subband coding
Malvar, H. S. (1990) · IEEE Transactions on Acoustics, Speech, and Signal Processing · doi:10.1109/29.56057 · Cited by 398 · cited 1×
“Another approach, called the Malvar-Wilson wavelets [10], [13], tries to build an adaptive representation by segmenting the temporal signal itself in order to separate the time intervals containing different spectral information.”
BackgroundKing, F. W. (2009) · Cambridge University Press eBooks · doi:10.1017/cbo9780511735271 · Cited by 311
Cited by
Items 1,001–1,001 of 1,001
Prediction of Heat and Cold Loads of Factory Mushroom Houses Based on EWT Decomposition
Zuo, H., Zheng, W., Wang, M., & Zhang, X. (2023) · Sustainability · doi:10.3390/su152115270 · Cited by 8
Metadata
- Authors
- Gilles, J.
- Affiliations
- University of California, Los Angeles (US)
- Corresponding author
- Gilles, Jérôme
- ORCID
- Gilles, Jérôme
- Venue
- IEEE Transactions on Signal Processing
- Published
- 2013-08
- Volume
- 61
- Issue
- 16
- Pages
- 3999-4010
- ISSN
- 1053-587X (ISSN-L)
- 1941-0476
- OpenAlex
- W2019900743
- Cited by
- 2,210
- References
- 17
- Citations by year
- 2026: 162 · 2025: 266 · 2024: 270 · 2023: 282 · 2022: 282 · 2021: 232 · 2020: 193 · 2019: 173 · 2018: 135 · 2017: 98 · 2016: 53 · 2015: 42 · 2014: 17 · 2013: 4
- FWCI
- 70.55
- Type
- journal article
- Language
- en
- Open access
- green
- arxiv.org
- Licence
- Locations
- IEEE Transactions on Signal Processing (publishedVersion)
- arXiv (Cornell University) (submittedVersion, cc-by-nc-nd)
- HAL (submittedVersion, other-oa)
- arXiv (Cornell University)
- Funders
- National Science Foundation (0914856, 1118971)
- W. M. Keck Foundation
- Multidisciplinary University Research Initiative
- Office of Naval Research (N0014-09-1, N00014)
- Topics
- Physical Sciences › Mathematics › Applied Mathematics › Mathematical Analysis and Transform Methods
- Physical Sciences › Engineering › Control and Systems Engineering › Machine Fault Diagnosis Techniques
- Physical Sciences › Computer Science › Computer Vision and Pattern Recognition › Image and Signal Denoising Methods
- Keywords
- empirical wavelet transform, adaptive wavelets, wavelet filter banks, empirical mode decomposition, signal decomposition
About these checks
Registry, retraction, Cites and statistics results are computed, not judged, with one exception: a printed reference that no index lists is read once by a model before it counts as a citation error. Claims are extracted by a model and kept only when their quote appears verbatim in the text; each cited source is then checked, with a model’s help, for whether it says what the claim relies on. Those verdicts can be wrong — read the claim’s quote and the cited source before relying on one.
Statistics and arithmetic are recomputed, not judged.
Confidence bands are shown only for fields calibrated on our annotated test set. None is calibrated yet, so no band is shown.
What counts as a claim ›How we measure confidence ›How we check this ›
Are you an author, or do you see a problem with this page? Request a review
Data sources
Bibliographic data: Semantic Scholar, OpenAlex, Crossref.
Contains information from the Semantic Scholar Academic Graph Datasets, made available under the ODC Attribution License (ODC-BY 1.0).
Semantic Scholar’s data is described in: Kinney, R., et al. (2023). The Semantic Scholar Open Data Platform. arXiv:2301.10140.
